Yet Another plyr Example
Mar 4, 2010 metroadmin
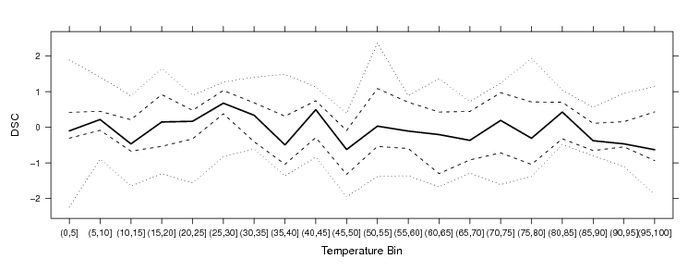
Figure: another plyr example quantiles (0.05, 0.25, 0.5, 0.75, 0.95) of DSC by temperature bin
There are plenty of good examples on how to use functions from the plyr package. Here is one more, demonstrating how to use ddply with a custom function. Note that there are two places where the example function may blow up if you pass in poorly formatted or strange data: calls to 1) t.test() and 2) quantile(). Also note the use of the transpose function, t(), for converting column-wise data into row-wise data-- suitable for inclusion into a dataframe containing a single row.
Example Code
#libraries
library(plyr)
library(lattice)

# simulate DSC data from several files
r <- data.frame(temp=rep(1:100, times=2), dsc=rnorm(200))
r$file <- factor(rep(c('file 1','file 2'), each=100))

# bin temperature in 5 degree slices
groups <- seq(0, 100, by=5)
r$group <- cut(r$temp, groups)

# custom summary function
# updated to work with arbitrary column names
f <- function(i, column)
        {

        # conf interval
        # careful with this t.test -- may blow up with some datasets
        i.conf <- data.frame(t(t.test(i[, column], conf.level=0.95, na.action='na.omit')$conf.int))
        names(i.conf) <- c('lower', 'upper')

        # quantiles
        p <- c(0.05, 0.25, 0.5, 0.75, 0.95)
        i.quant <- data.frame(t(quantile(i[, column], probs=p, na.rm=TRUE)))
        names(i.quant) <- paste('q', round(p * 100), sep='_')

        # make a dataframe
        d <- data.frame(
        mean=mean(i[, column], na.rm=TRUE),
        min=min(i[, column], na.rm=TRUE),
        max=max(i[, column], na.rm=TRUE),
        sd=sd(i[, column], na.rm=TRUE),
        i.quant,
        i.conf
        )

        # give back to caller
        return(d)
        }


# apply our function by groups
r.agg <- ddply(r, .(group), .fun=f, column='dsc')

# visualization of some of the results
xyplot(q_50 + q_5 + q_95 ~ group, data=r.agg, type='l', lty=c(1,2,2), col=1)
xyplot(q_5 + q_25 + q_50 + q_75 + q_95 ~ group, data=r.agg, type='l', lty=c(3,2,1,2,3), lwd=c(1,1,2,1,1), col=1)
xyplot(mean + lower + upper ~ group, data=r.agg, type='l', lty=c(1,2,2), col=1)
xyplot(mean + lower + upper ~ group, data=r.agg, type='p', cex=c(1,2,2), pch=c('o','-','-'), col=1)

