
Soil Texture Example
Premise
Compute a series of weighted-average soil texture fractions (sand, silt, clay), for every component, of every map unit in Yolo County. These values will be further weighted by the spatial distribution of each map unit.
CREATE TABLE yolo_wt_mean_texture AS
-- join with polygons, and compute areas weights
SELECT mapunit_poly.mukey,
sum(ST_Area(wkb_geometry)) / (SELECT ST_Area(wkb_geometry) FROM mapunit_bound_poly WHERE areasymbol = 'ca113') AS area_wt,
sand, silt, clay
FROM
mapunit_poly
JOIN
        (
        -- compute component percent weighted mean
        SELECT mukey,
        sum(comppct_r * sand) / sum(comppct_r) AS sand,
        sum(comppct_r * silt) / sum(comppct_r) AS silt,
        sum(comppct_r * clay) / sum(comppct_r) AS clay
        FROM
        component
        JOIN
                (
                -- compute hz thickness weighted mean
                SELECT cokey,
                sum((hzdepb_r - hzdept_r) * sandtotal_r) / sum(hzdepb_r - hzdept_r) AS sand,
                sum((hzdepb_r - hzdept_r) * silttotal_r) / sum(hzdepb_r - hzdept_r) AS silt,
                sum((hzdepb_r - hzdept_r) * claytotal_r) / sum(hzdepb_r - hzdept_r) AS clay
                FROM chorizon
                WHERE sandtotal_r IS NOT NULL
                AND silttotal_r IS NOT NULL
                AND claytotal_r IS NOT NULL
                AND areasymbol = 'ca113'
                GROUP BY cokey
                ) AS co_agg
        ON component.cokey = co_agg.cokey
        GROUP BY component.mukey
        ) AS mu_agg
ON mapunit_poly.mukey = mu_agg.mukey
GROUP BY mapunit_poly.mukey, sand, silt, clay;
Simple Visualization with R
# dump the data:
# echo 'select * from yolo_wt_mean_texture' |  psql -A -F "," -U xxx -h xxx dbname > temp/yolo_texture.csv
#
# remember to trim off the last line!

# load some libs:
library(plotrix)

# read in the data
x <- read.csv('yolo_texture.csv')

# simple soil texture, with symbol size weighted by area weight
soil.texture(x[,3:5], cex=sqrt(50*x$area_wt), pch=16, col.symbol=rgb(65,105,225, alpha=100, max=255),
show.lines=T, show.names=T, col.lines='black', col.names='black', main='Yolo County Soil Textures')

triax.points(cbind(weighted.mean(x$sand, x$area_wt), weighted.mean(x$silt, x$area_wt), weighted.mean(x$clay, x$area_wt)),
col.symbols='orange', pch=16, cex=2)
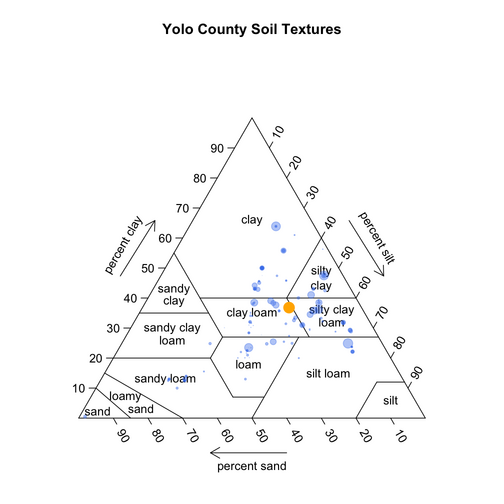
Yolo County Common Soil Textures: Blue symbols mark common soil textures and their relative size denotes abundance. The orange symbol marks the weighted average soil texture for all of Yolo County.
