Finding pockets of soil between the Pinnacles
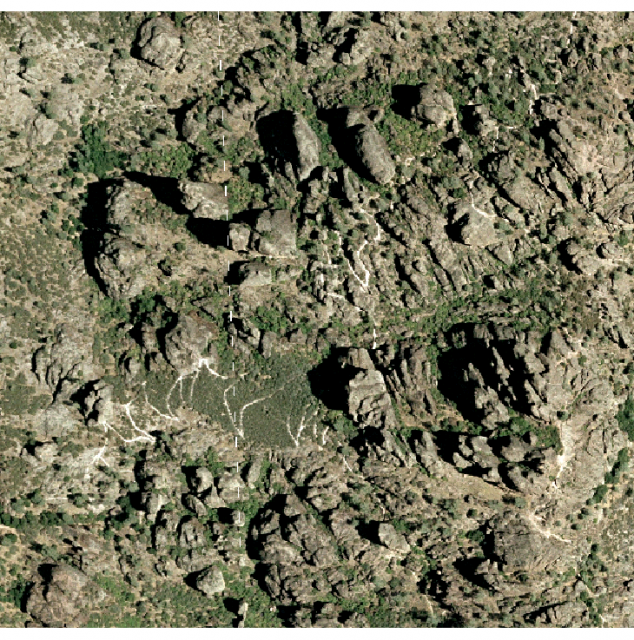
From afar, the massive rock formations which form the Pinnacles seem to dominate the ridge tops. Upon closer examination, clumps of chamise, annual grasses, and even the occasional grey pine are visible in the cracks and crevices between boulders. The presence of vascular plants, especailly those with a woody stem or trunk suggests that there are pockets of soil deep enough and fine textured enough to hold a large amount of water. However, it is difficult to visually estimate just how much of this complex landform is covered by soil. Figure 1 is a panchromatic (true color) aerial image of the Pinnacles, recorded at a resolution of about 0.6 meters.
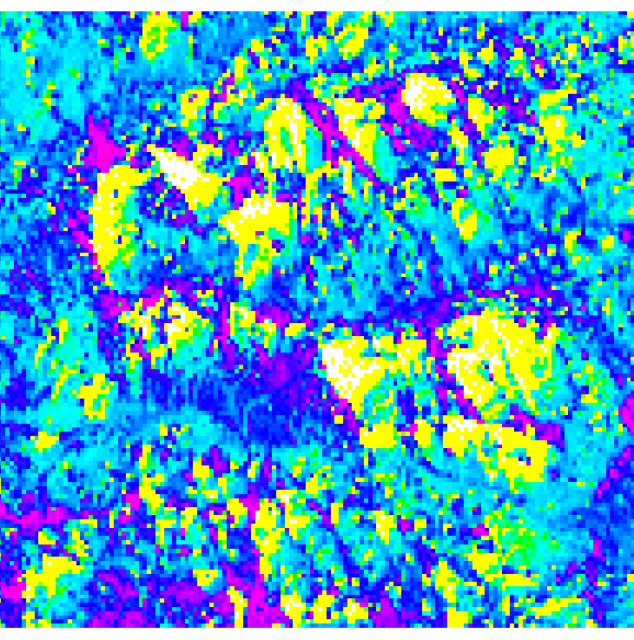
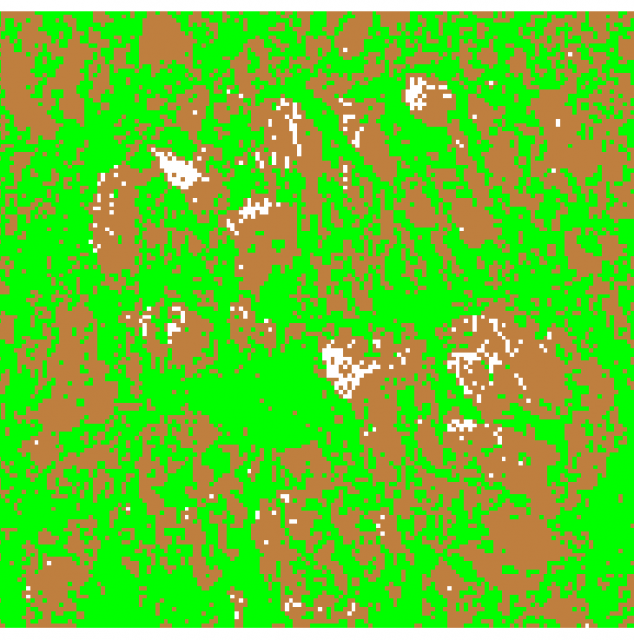
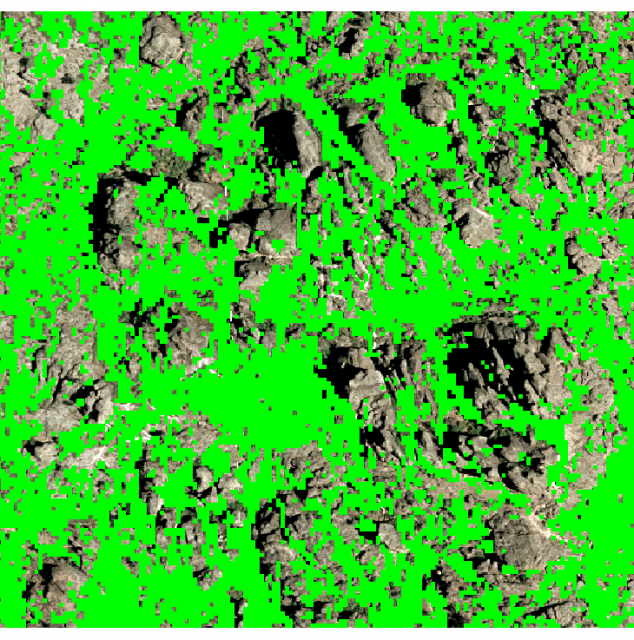
A simple approach to finding an approximate numerical percentage of area covered by soil makes use of the Normalized Difference Vegetation Index, or NDVI. An NDVI image highlights the location and relative intensity of chlorophyll production, i.e. where the plants are. Figure 2 shows an example NDVI image, where the blues and pink hues represent vegetation and the yellow hues represent non-vegetation. 4 meter resolution, false-infrared IKONOS imagery of the region, provided by the NPS staff, provides sufficient spectral and spatial resolution for this calculation. The next step is to visually locate an approximate cut-off which differentiates rock outcrop pixels from vegetation pixels. A re-class of the NDVI image, based on the previous cut-off value defining the vegetaion-rock boundary yields a simple soil/non-soil map. This map is shown in Figure 3; non-soil colored brown, and soil areas colored green. This style of calculation is based on the fundamental assumption that the presence of a large enough chlorophyll signature in the NDVI image suggests that there is soil beneath the overlying plant's canopy. Figure 4 shows the distribution of soil areas (green) on top of the panchromatic image, emphasizing the differences between "soil" and "non-soil" areas. A simple, cell-based calculation reveals that in this small region about 51% of the area is covered with soil. Figure 5 demonstrates a simple analysis of vegetaion class found within the "soil" and "non-soil" categories. A step-by-step listing of GRASS commands, along with the area report are given below
 Fig 1: panchromatic image |
 Fig 2: NDVI map |
 Fig 3: soil / non-soil areas |
 Fig 4: composite image |
Sample GRASS Session:
Additional information: report of soil vs. non-soil as compared to Schumaker Vegetation Map
Projects
- BMP's for Irrigated Agriculture
- Pedology and Soil Survey
- Geographic Nutrient Management Zones for Winegrape Production
- GIS and Digital Soil Survey Projects
- New Technologies in Soil Survey
- Other Information
- Pinnacles National Monument
- Terrain Classification Experiment 2: GRASS, R, and the raster package
- Images from Pinnacles Soil Profile Analysis
- Accessing PINN Soils Data in Google Earth
- Computing terrain-specific slope classes by region
- Finding pockets of soil between the Pinnacles
- Islands of Fertility: Oak Tree vs. Buckwheat Savannah Soils
- Pedon Data collection and entry graphs
- Restored 1933 Geologic Map of Pinnacles
- Soil Color Ideas
- Soil Properties by Parent Material and Rock Type
- Some panoramic pictures
- Insolation Time Experiments
- Pinnacles National Monument
- Rangeland Soil Management and Hydrology

