
Premise:
Setting the magnetic declination on a compass is a critical step in accurate measurement of bearings that can be translated to map or survey. As the location of the magnetic north pole is constantly moving, the magnetic declination reported on older topographic maps or compass housings are probably out of date. Current declination values for a single point, or for large regions can be found on the NOAA sites:
These resources are helpful, but a current, detailed (state-level) map of magnetic declination would be interesting.
Get the Data for California:
The NOAA website also has a service for generating magnetic declination estimates along a user-defined grid system. The result is a simple list containing longitude, latitude and declination values, one for each user-defined grid cell. This list of data can easily be imported into a GIS, converted to raster, and contoured at some level of detail. The result would then be a nice map of magnetic declination for the state of California-- representing the current magnetic properties of the Earth.
The grid of coordinates and declinations, along with a PDF map are attached at the bottom of this page.
UPDATE: it is also possible to get world-wide grids of various magnetic field properties from this site. This data can be directly read in as raster or vector points, and even plotted from GMT. Read in the GMT grid file into GRASS like this:
grd2xyz D_map_mf_2005/D_Grid_mf_2005.grd | r.in.xyz in=- out=mf_2005 fs='\t'
Stefan Maus has put together an excellent website on the Earth's magnetic field, containing much more detailed (and interesting) information.
Process in GRASS/GMT:
# LL location
g.region n=44:00:00N s=32:00:00N w=125:00:00W e=113:00:00W res=0.5


# read in as raster:
r.in.xyz in=temp/mag_dec/ca_1deg.xyz out=declin type=FCELL x=2, y=1, z=3


# read in the data as a vector:
v.in.ascii in=ca_1deg.xyz out=dec_points x=2 y=1 columns="x double, y double, declin double"


# note that the cells are not centered on the points
d.rast declin
d.vect dec_points icon=basic/point
d.grid  size=2 fontsize=12


# save a GMT-style grid for plotting
# note syntax, and preservation of NULL cells
# set the region to something just a little smaller than CA
g.region n=42 s=32.5 w=-124.5 e=-115 res=0.5
r.out.bin in=declin out=- null=-9999 | xyz2grd -Gdeclin.grd -R-124.5/-115/32.5/42 -I0.5/0.5 -ZTLf -F -N-9999
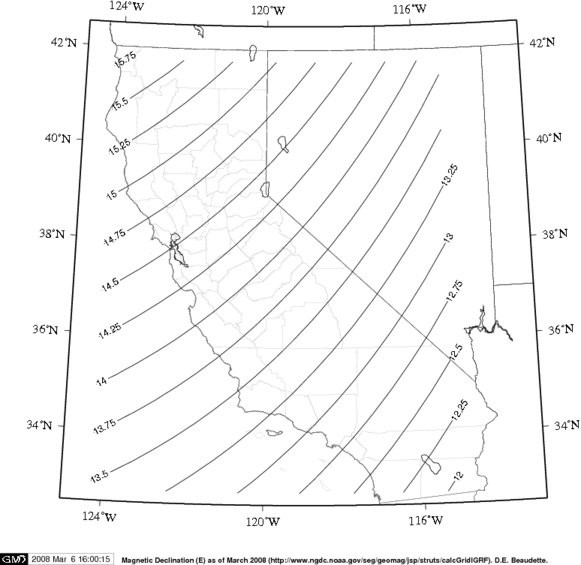
Figure CA Magnetic Declination Map
Make Map with GMT:
#setup the contouring
annotated_contour_interval=0.25 #deg

#setup the contour line colors
contour_color1="1/1/1"


# simple map of the unique locations
# define some global settings:
gmtset ANNOT_FONT_PRIMARY Times-Roman \
HEADER_FONT_SIZE 16 \
ANNOT_FONT_SIZE_PRIMARY 12 \
LABEL_FONT_SIZE 14 \
BASEMAP_TYPE plain \
PLOT_DEGREE_FORMAT DF \
PAPER_MEDIA letter+


#
# sample map centered on the western USA
pscoast -JB-119/38/36/40/6.5i \
-R-125/-113/32.5/42.5 -B4/2 \
-Gwhite -W0.5p \
-U"Magnetic Declination (E) as of March 2008 (http://www.ngdc.noaa.gov/seg/geomag/jsp/struts/calcGridIGRF). D.E. Beaudette." \
-A250 -Dh -Na -Xc -Yc -P -K > map.eps

# plot counties
psxy counties.xy -M -J -R -W1/200/200/200 -P -O -V -K >> map.eps
# countour the declination grid
grdcontour declin.grd -J -R -GN+1 -A${annotated_contour_interval}+k$contour_color1+s9 -Wa2/$contour_color1 -O -V >> map.eps


# crop map to a tight bounding-box, and convert to PDF
ps2raster map.eps -A -Tf
Attachments:
Links:
Generic Mapping Tools: high quality map production
Generic GRASS-GMT Plotting System
