
Premise:
Updated version of a previous attempt to use a traveling-salesman approach to visiting data-loggers in steep terrain. This time we use a vector/raster approach (v.rast.stats) to compute the total "cost" incurred along each segment of a network connecting all of our data-loggers. Although this approach requires more computation time (v.rast.stats is slow), we can generate a more detailed cost surface to model movement. In this case we are using a cumulative-traversed-slope derived cost, with a 90% reduction along a local road.
New Approach:
- generate a cumulative cost surface, originating at data-logger locations, based on slope angle (r.slope.aspect, r.cost)
- generate a network of lines connecting all data-loggers, along with a local road (v.delaunay, v.digit, v.patch)
- modify the cost surface along the local road, such that cumulative cost is reduced 90% within 5m of the road (r.buffer, r.mapcalc)
- densify the line segments along the network (v.split)
- compute the total cost along each line segment of our network (v.rast.stats)
- connect data-logger points to delaunay network (v.net)
- solve the traveling salesman problem (v.net.salesman)
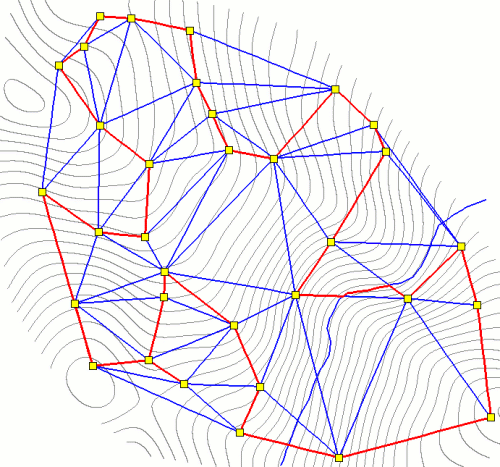
Optimal Route version 2: 10-meter contours in grey, network in blue, optimal cycle between data-loggers (yellow) in red.
Setup the cost surface and network
# generate cost surface based on slope
r.slope.aspect elev=rtk_elev_var_smooth@rtk slope=slope format=percent
r.cost --o -k in=slope start_points=temperature_sites_maybe output=slope_cost

# make a vector of roads within the watershed:
v.digit -n map=roads  bgcmd="d.rast naip2005.green"

# use this to modify the cost surface
v.to.rast --o in=roads out=roads use=val val=1

# generate buffer 5 meters from road
r.buffer --o in=roads out=roads_buff distances=5 units=meters

# reduce slope cost to 1% of its value along the buffered road
r.mapcalc "new_cost = if(isnull(roads_buff), slope_cost, (0.01) * slope_cost)"

# generate simple network connecting all points
v.delaunay --o -l in=temperature_sites_maybe out=tri

# combine road network, with delaunay network
v.patch in=tri,roads out=tri_1
v.clean --o in=tri_1 out=tri_1_clean tool=break thresh=1

# densify line segments
v.split --o in=tri_1_clean out=tri_2 length=20

# add categories
v.category --o in=tri_2 out=tri_3 option=add type=line

# add table
v.db.addtable map=tri_3 columns="cat integer"
Compute the total cost along each line segment, solve traveling salesman problem
# better approach to assigning cost, based on cost surface:
# really slow, as it uses vect->rast conversion to compute statistics
# about 3.5 minutes for 588 line features =  features / minute

# set the region to 2m, so that rasterized lines are wider
g.region res=2
v.rast.stats vect=tri_3 layer=1 rast=new_cost colprefix=s
# reset region
g.region res=1

# make network
v.net --o in=tri_3 points=temperature_sites_maybe out=net --o operation=connect thresh=10

# check network-- has categories?
v.category net op=report

# solve traveling salesman problem -- does not work with 3D maps
# use regular path-distance cost:
v.net.salesman --o in=net out=simple_salesman ccats=1-33

# use the total cost surface values / line segment
v.net.salesman --o in=net out=salesman acol=s_sum ccats=1-33
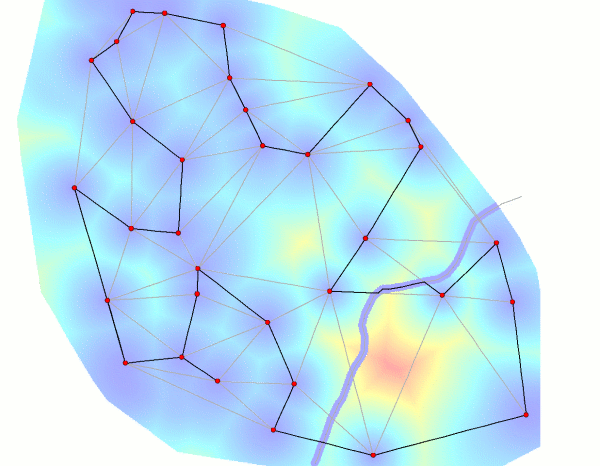
Optimal Route with cost surface: optimal route in black, cost surface colors: blue = low, red = high.
Links:
Traveling Salesman Approach to Visiting Data-loggers
Vector Operations
Working with transects
