Computing terrain-specific slope classes by region
Background
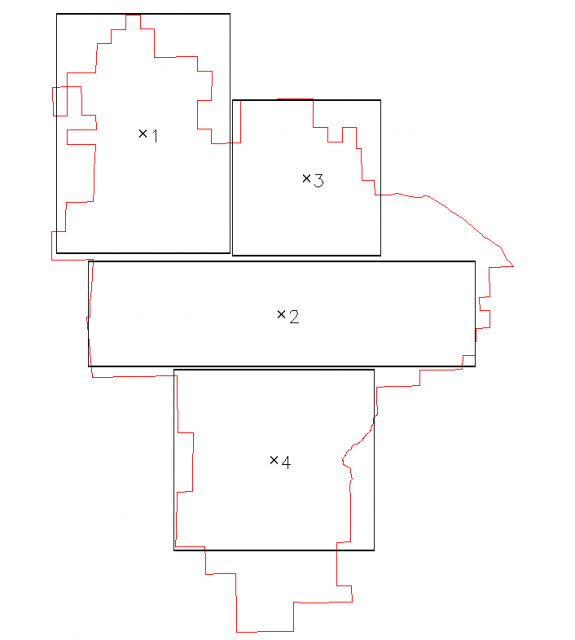
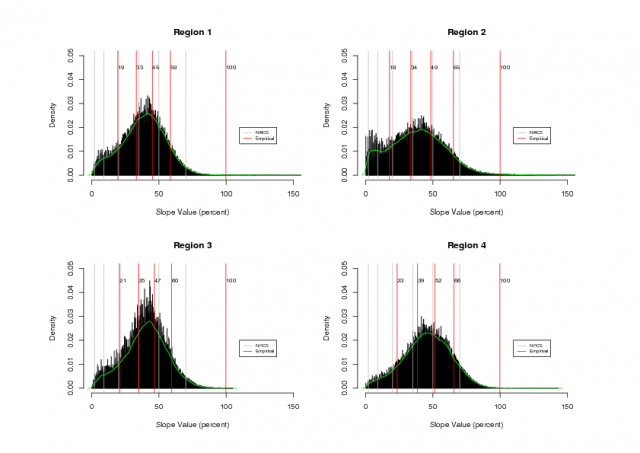
Four regions were selected within the PINN boundary for analysis of intrinsic slope classes, based on terrain type.Figure 1 illustrates the four regions that were choosen. Figure 2 shows histograms of each region along with intrinsic slope class breaks (red) and NRCS slope class breaks (gray). Note that NRCS slope classes were derived from a similar analysis (k-means clustering) of slope values from the entire park: e.g. without regard for specific landform. See attached PDF version of Figure 2 at the bottom of this page.
Intrinsic slope classes were evaluated with a k-means clustering algorithm based on the percent slope values within each region for 5 classes. Large variation in the resulting class boundaries was mitigated by applying the k-means algorithm to slope values which were less than 100% (45 deg slope) for each region. While the slope class boundaries are not exactly the same across regions, they are within about 5% of each other for each slope class. See Figure 2 for a visual comparison of intrinsic slope classes with the 7 slope classes choosen by the NRCS.
Notes
1. a better approach would be to use the k-medoids algorithm from the 'custer' package
2. with the kmeans() function, it would be best to set a large number of iterations
 Figure 1: 4 sample regions |
 Figure 2: slope data from each region |
Methods
Compute a base slope map in percent:
Patch the regions together into a single vector map, and add labels that match their region number
#fix categories to reflect region number
v.category in=slope_regions out=tt type=centroid option=del
v.category in=tt out=ff type=centroid option=add
#cleanup
g.remove vect=tt,slope_regions ; g.rename vect=ff,slope_regions
Make a mask of the park, for reporting
g.rename rast=pinn_bnd_mask,MASK
Dump cell values from slope_pct:
r.stats -n -1 in=slope_pct > all_cell_values.dat
#then the values from each region
for x in `seq 1 4`;
do
g.region vect=region_$x
r.stats -n -1 in=slope_pct > r${x}_cell_values.dat
done
#paste cell values into a single file and cleanup
paste r?_cell_values.dat > region_cell_values.dat
rm r?_cell_values.dat
Analyze the results in R:
all <- read.table("all_cell_values.dat")
all <- all$V1
#read in the data region by region: remember to remove NA values
temp <- read.table("region_cell_values.dat", sep="\t")
r1 <- temp$V1[which(is.na(temp$V1) == F)]
r2 <- temp$V2[which(is.na(temp$V2) == F)]
r3 <- temp$V3[which(is.na(temp$V3) == F)]
r4 <- temp$V4[which(is.na(temp$V4) == F)]
rm(temp)
#k-means clustering of the entire park's data
km5.bks <- kmeans(all,5)
brks <- (tapply(all, factor(match(km5.bks$cluster, order(km5.bks$centers))),range))
#analize the data region by region
par(mfrow=c(2,2))
#a function for summarizing a single slope dataset
slope_viz <- function(slope, main="Histogram of slope")
{
#plot the distribution
hist(slope, breaks=1000, freq=F, main=main, xlab="Slope Value (percent)", xlim=c(0,150), ylim=c(0,.05) )
lines(density(slope, bw=1), col="green")
#k-means clustering, leave out all slopes higher than 100% (45 deg)
km5.bks <- kmeans(slope[which(slope < 100)],5)
brks <- (tapply(slope[which(slope < 100)], factor(match(km5.bks$cluster, order(km5.bks$centers))),range))
#add the slope class lines as computed for the entire region, accepted by the NRCS
abline(v=c(2,9,20,35,50,70), col="gray")
#add the slope class lines for each region
for (i in 1:length(brks) )
{
abline(v=brks[[i]][2], col="red")
text(x=brks[[i]][2], y=0.045, labels=round(brks[[i]][2]), adj=0, cex=0.8)
}
#add a legend
legend(x=110,y=0.02, legend=c("NRCS","Empirical"), col=c("gray","red"), lty=1, cex=0.6)
}
slope_viz(r1, main="Region 1")
slope_viz(r2, main="Region 2")
slope_viz(r3, main="Region 3")
slope_viz(r4, main="Region 4")
Attachment:
Projects
- BMP's for Irrigated Agriculture
- Pedology and Soil Survey
- Geographic Nutrient Management Zones for Winegrape Production
- GIS and Digital Soil Survey Projects
- New Technologies in Soil Survey
- Other Information
- Pinnacles National Monument
- Terrain Classification Experiment 2: GRASS, R, and the raster package
- Images from Pinnacles Soil Profile Analysis
- Accessing PINN Soils Data in Google Earth
- Computing terrain-specific slope classes by region
- Finding pockets of soil between the Pinnacles
- Islands of Fertility: Oak Tree vs. Buckwheat Savannah Soils
- Pedon Data collection and entry graphs
- Restored 1933 Geologic Map of Pinnacles
- Soil Color Ideas
- Soil Properties by Parent Material and Rock Type
- Some panoramic pictures
- Insolation Time Experiments
- Pinnacles National Monument
- Rangeland Soil Management and Hydrology

