Working with Landsat Data
Background
- Landsat TM and ETM+ sensor information
- Data information and citation examples
- Pan-sharpening example in GRASS via Brovey transform
- Simple landscape classification example
Data Sources in order of ease of use
- University of Maryland's Global Land Cover Facility
- CaSiL Landsat Archive for CA
- USGS Global Viewer: free ortho-rectifed imagery
Sample GRASS commands
#display a true color composite image from Landsat TM data:
d.rgb r=landsat_band_3 g=landsat_band_2 b=landsat_band_1
#fuse bands into a single image:
r.composite r=landsat_band_3 g=landsat_band_2 b=landsat_band_1 out=landsat_bands_321
#blend landsat composite image with DEM data
#note that blending will require some tweaking: good results obtained with:
r.blend second=shaded_relief first=landsat_321 out=landsat_shade perc=6
#re-composite the blended results
r.composite landsat_shade.r g=landsat_shade.g b=landsat_shade.b out=landsat_shade.rgb
#create histogram equalized inputs (Fig 5)
r.colors map=landsat_band_1 color=grey.eq
r.colors map=landsat_band_2 color=grey.eq
r.colors map=landsat_band_3 color=grey.eq
r.composite r=landsat_band_3 g=landsat_band_2 b=landsat_band_1 out=landsat_eq_321
Simple comparison between the default output from r.composite on landsat bands 3,2,1 and the enhanced output from i.landsat.rgb.
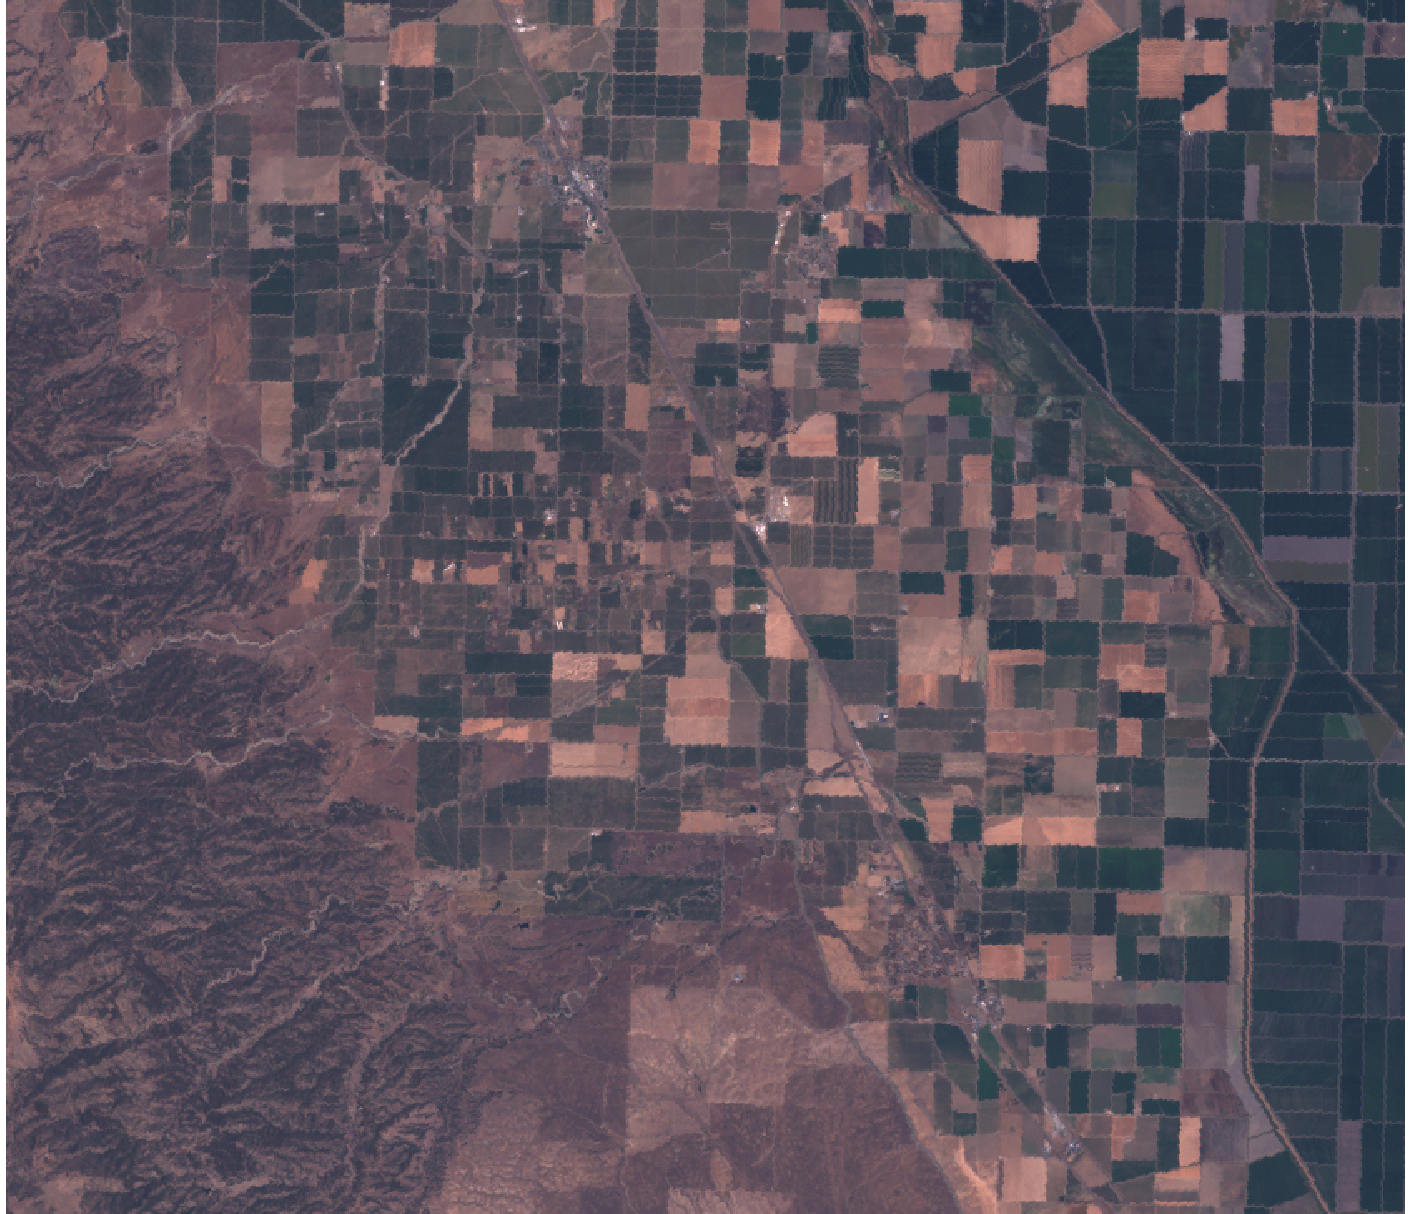 Fig.1 Bands 3,2,1 |
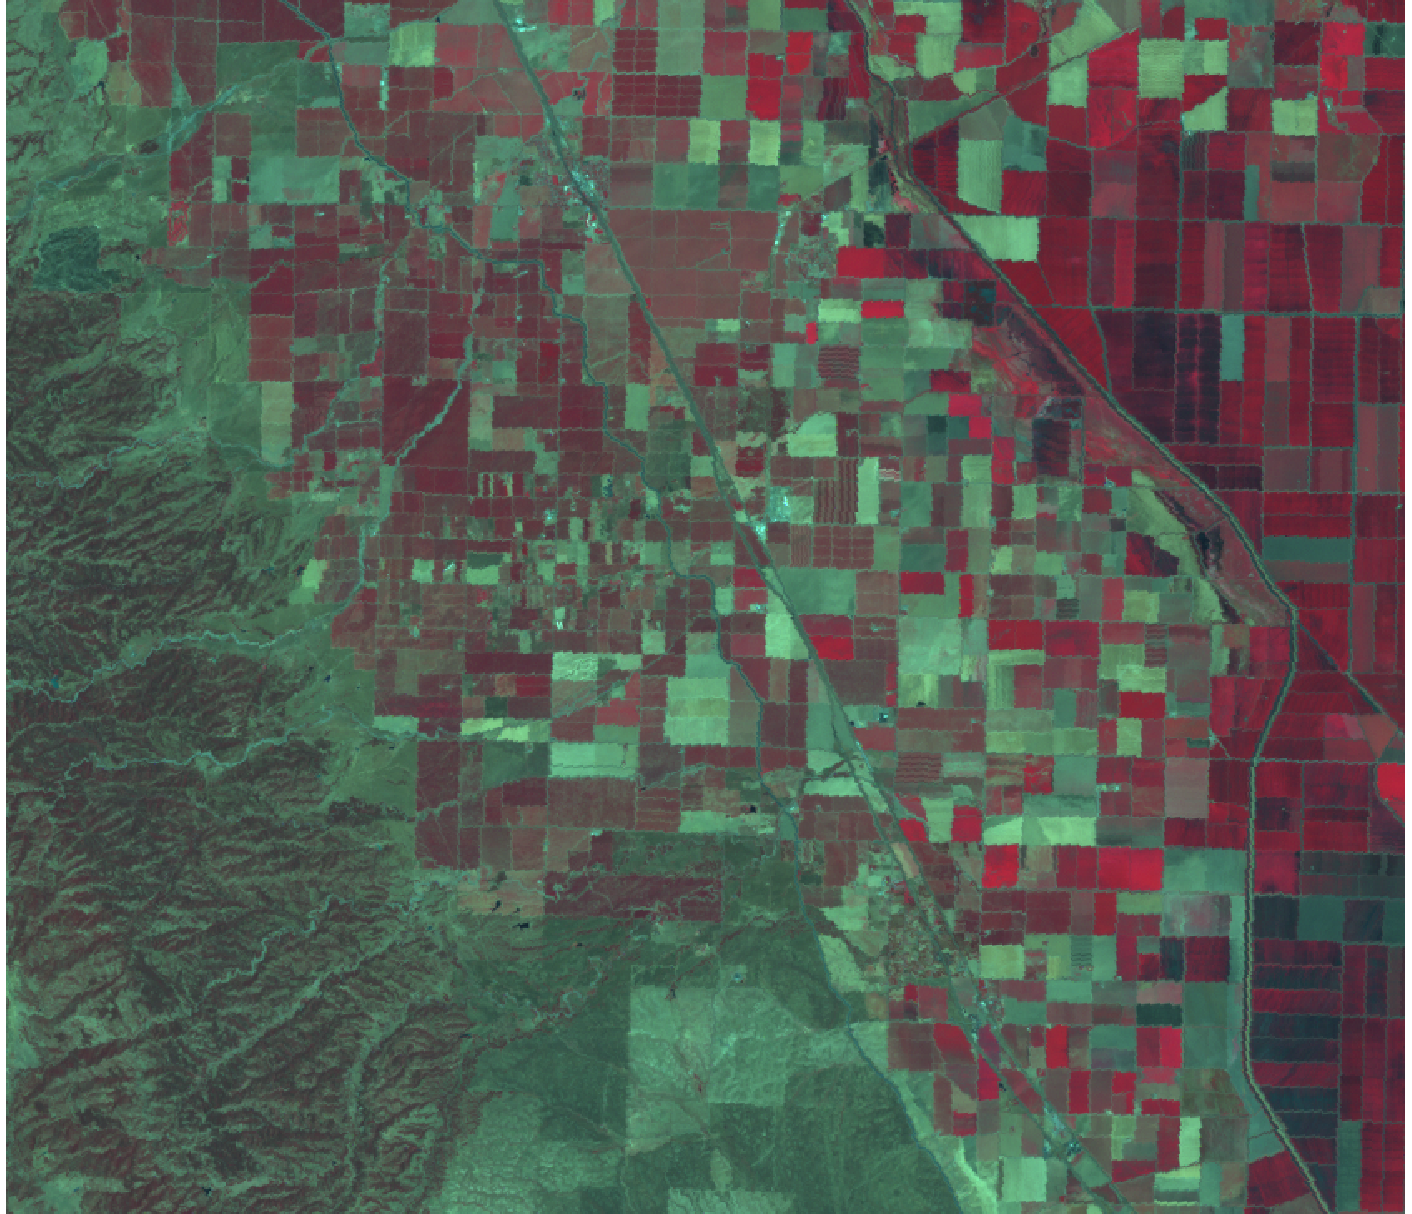 Fig.2 Bands 4,3,2 |
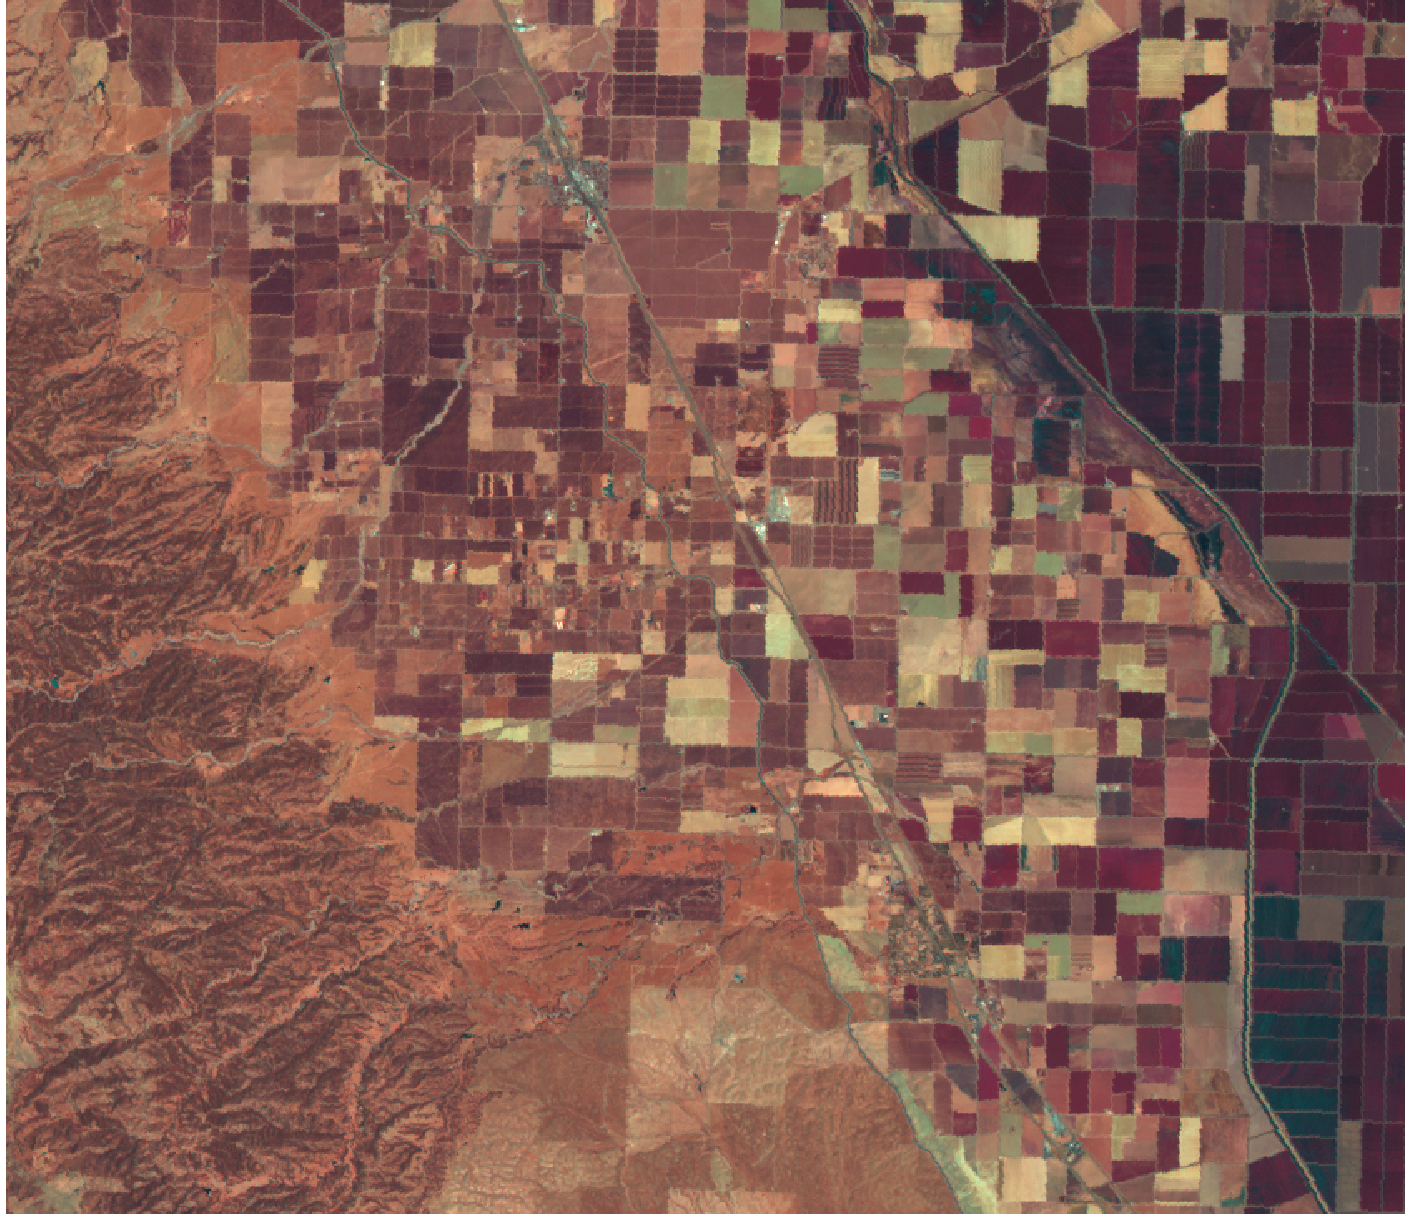 Fig.3 Bands 5,3,2 |
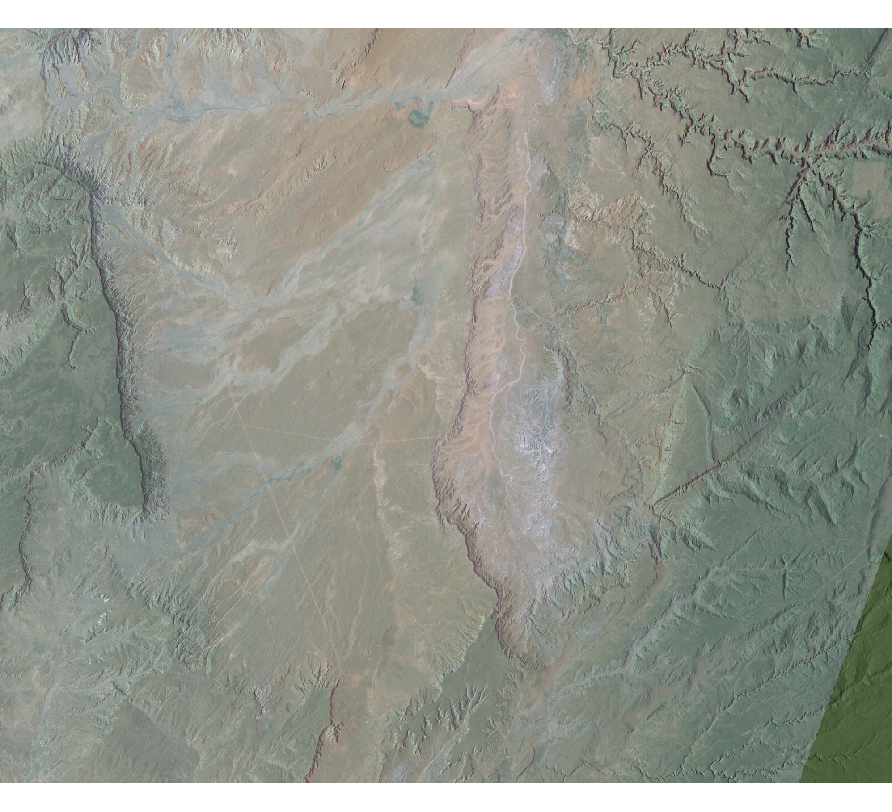 Fig.4 Blend with hillshade |
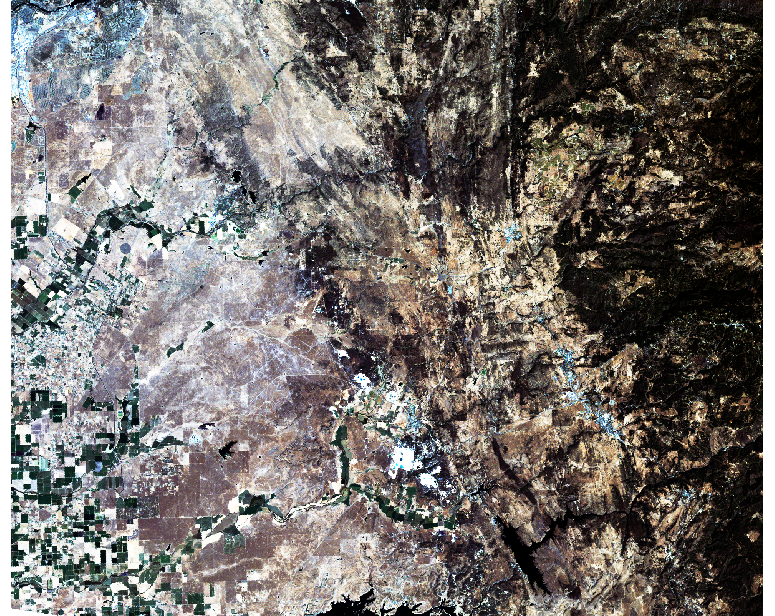 Fig.5 Histogram equalized 321 |
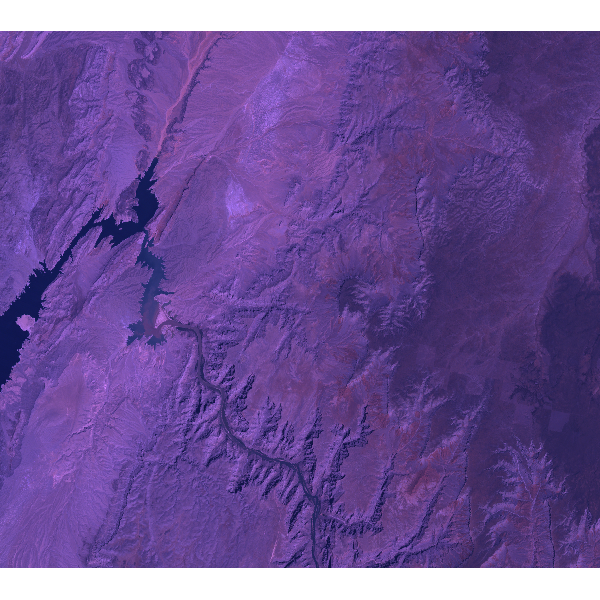 r.composite default |
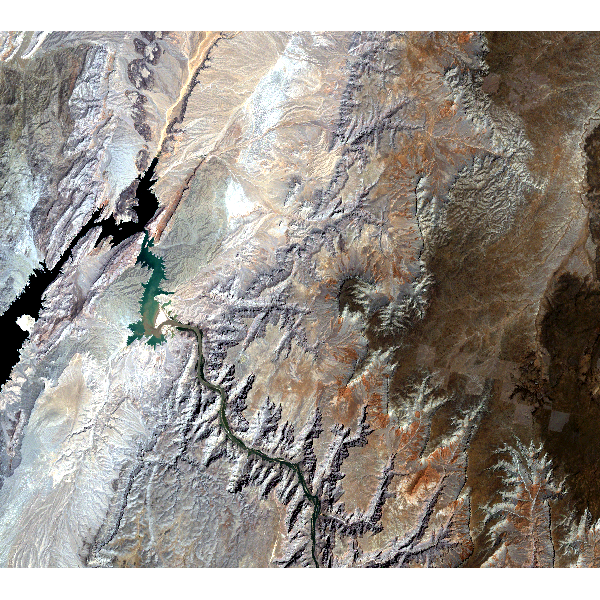 i.landsat.rgb enhanced |
Software
- General Purpose Programming with Scripting Languages
- LaTeX Tips and Tricks
- PostGIS: Spatially enabled Relational Database Sytem
- PROJ: forward and reverse geographic projections
- GDAL and OGR: geodata conversion and re-projection tools
- R: advanced statistical package
- GRASS GIS: raster, vector, and imagery analysis
- Generic Mapping Tools: high quality map production

