Home » Software » R: advanced statistical package » Color Functions » Using ColorBrewer to assist with thematic map color selection
Using ColorBrewer to assist with thematic map color selection
Choosing the right colors for classes in a thematic map can be a difficult task. The ColorBrewer website provides an interactive tool for browsing numerous color combinations. Each of the color combinations presented on the ColorBrewer website are the culmination of numerous color interpretation studies. In addition, there is a list of special color combinations suitible for audiences which may include color blind individuals.
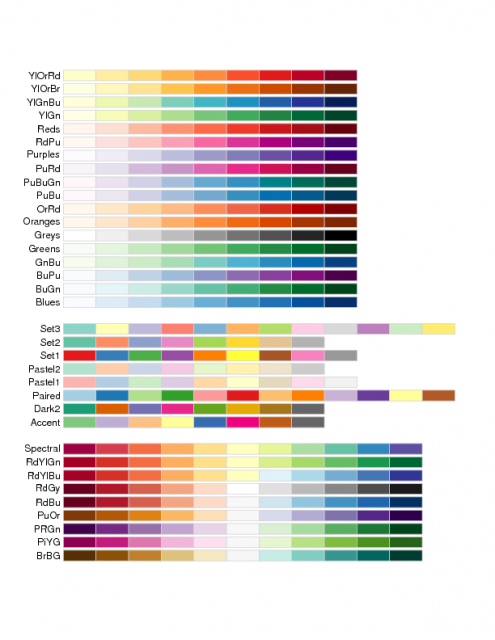
The R package RColorBrewer adds the color brewer color combinations as well as functions for generating new combinations to R. Figure 1 demonstrates the available color combinations, as returned by the function display.brewer.all.
 RColorBrewer color combinations |
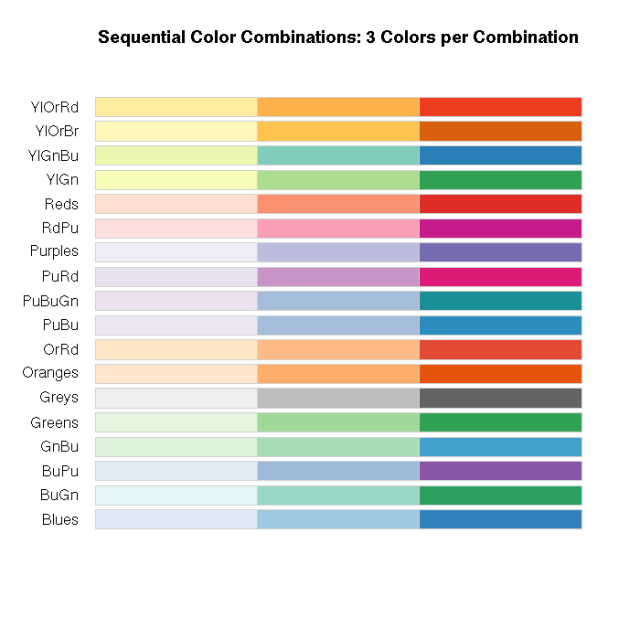
 Figure 2: 3 colors per combination |
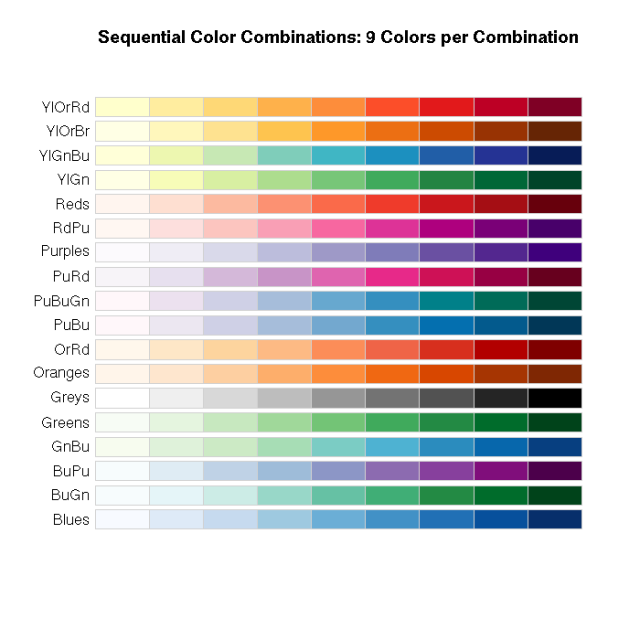
 Figure 3: 9 colors per combination |
An example R session:
#load the RColorBrewer package [must be installed first with install.packages()]
library(RColorBrewer)

#display the "sequential" color combinations, with 3 colors per combination
#See Figure 2
display.brewer.all(n=3,type="seq",exact.n=TRUE)
title("Sequential Color Combinations: 3 Colors per Combination")

#display the "sequential" color combinations, with 9 colors per combination
#See Figure 3
display.brewer.all(n=9,type="seq",exact.n=TRUE)
title("Sequential Color Combinations: 9 Colors per Combination")


# convert R colors into RGB triplets;
col2rgb( brewer.pal("Accent", n=5) )
Software
- General Purpose Programming with Scripting Languages
- LaTeX Tips and Tricks
- PostGIS: Spatially enabled Relational Database Sytem
- PROJ: forward and reverse geographic projections
- GDAL and OGR: geodata conversion and re-projection tools
- R: advanced statistical package
- Access Data Stored in a Postgresql Database
- Additive Time Series Decomposition in R: Soil Moisture and Temperature Data
- Aggregating SSURGO Data in R
- Cluster Analysis 1: finding groups in a randomly generated 2-dimensional dataset
- Color Functions
- Comparison of Slope and Intercept Terms for Multi-Level Model
- Comparison of Slope and Intercept Terms for Multi-Level Model II: Using Contrasts
- Creating a Custom Panel Function (R - Lattice Graphics)
- Customized Scatterplot Ideas
- Estimating Missing Data with aregImpute() {R}
- Exploration of Multivariate Data
- Interactive 3D plots with the rgl package
- Making Soil Property vs. Depth Plots
- Numerical Integration/Differentiation in R: FTIR Spectra
- Plotting XRD (X-Ray Diffraction) Data
- Using lm() and predict() to apply a standard curve to Analytical Data
- Working with Spatial Data
- Comparison of PSA Results: Pipette vs. Laser Granulometer
- GRASS GIS: raster, vector, and imagery analysis
- Generic Mapping Tools: high quality map production

