
Some recent updates to SoilWeb. New visualizations will be incorporated into SoilWeb soon.
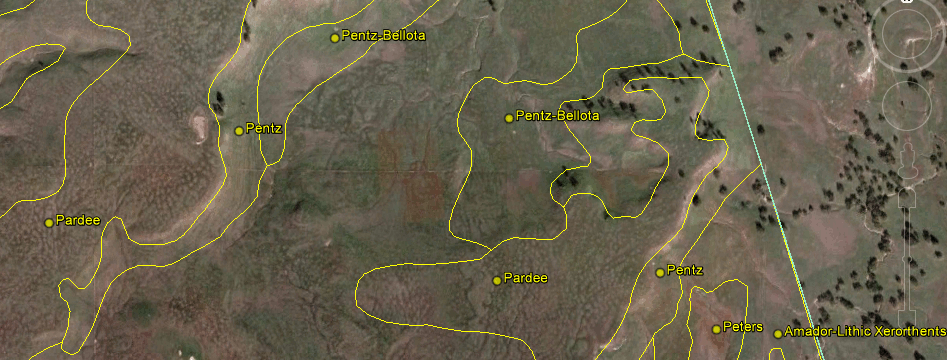
- New map unit labels in the Google Earth interface, now based on major component names rather than map unit symbols. The new labeling style makes it much simpler to see patterns on the landscape and visually search for specific soils by series name. Thanks to Ben Marshall for the great idea.
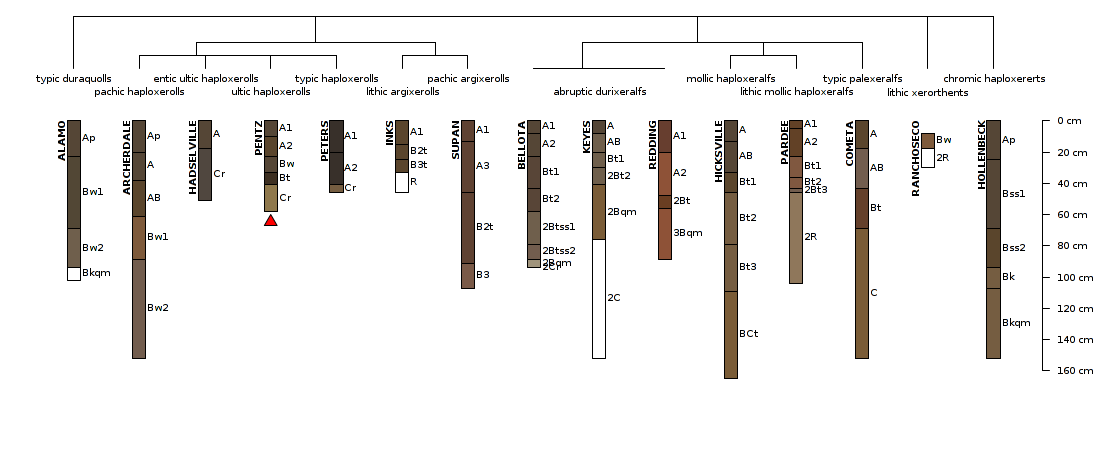
- Soil profile sketches and taxonomic breakdown for a named soil series via URL. The resulting image depicts taxonomic relationships between those soils that are mapped with the named series, utilizing functions from the AQP family of packages for R. Copy the image URL below and modify the series=pentz argument to generate similar diagrams for other soil series.
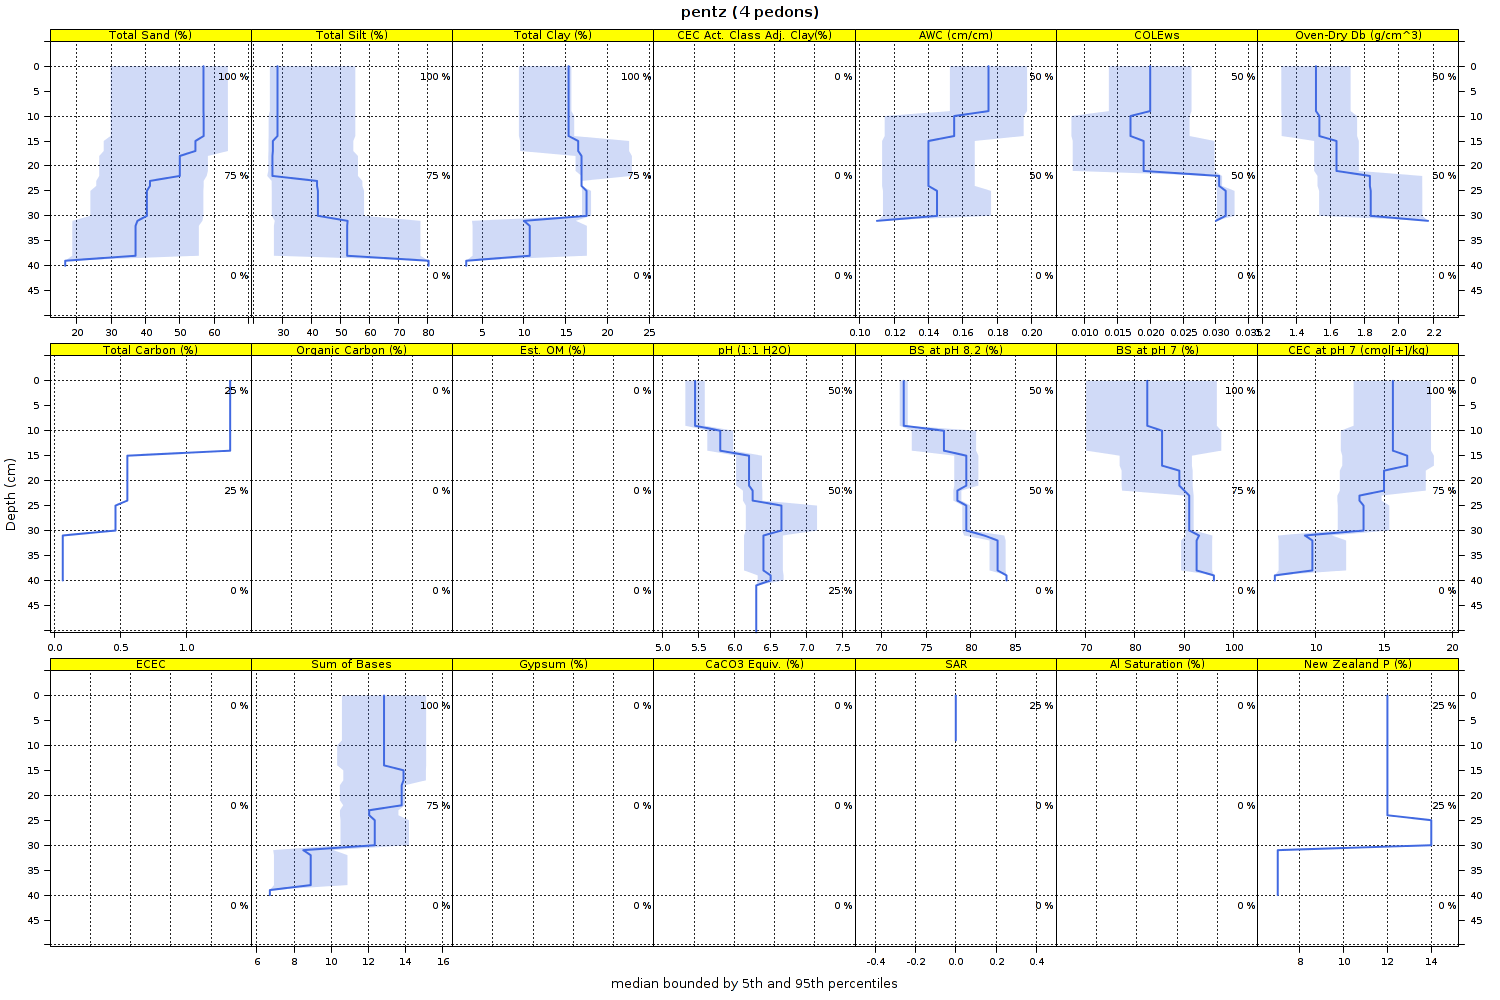
- Soil property data (aggregated by depth-slice) via URL. Depth-wise aggregation and associated visualization of soils data are performed on-the-fly, using the aqp package for R. Adjust the image URL below to customize.
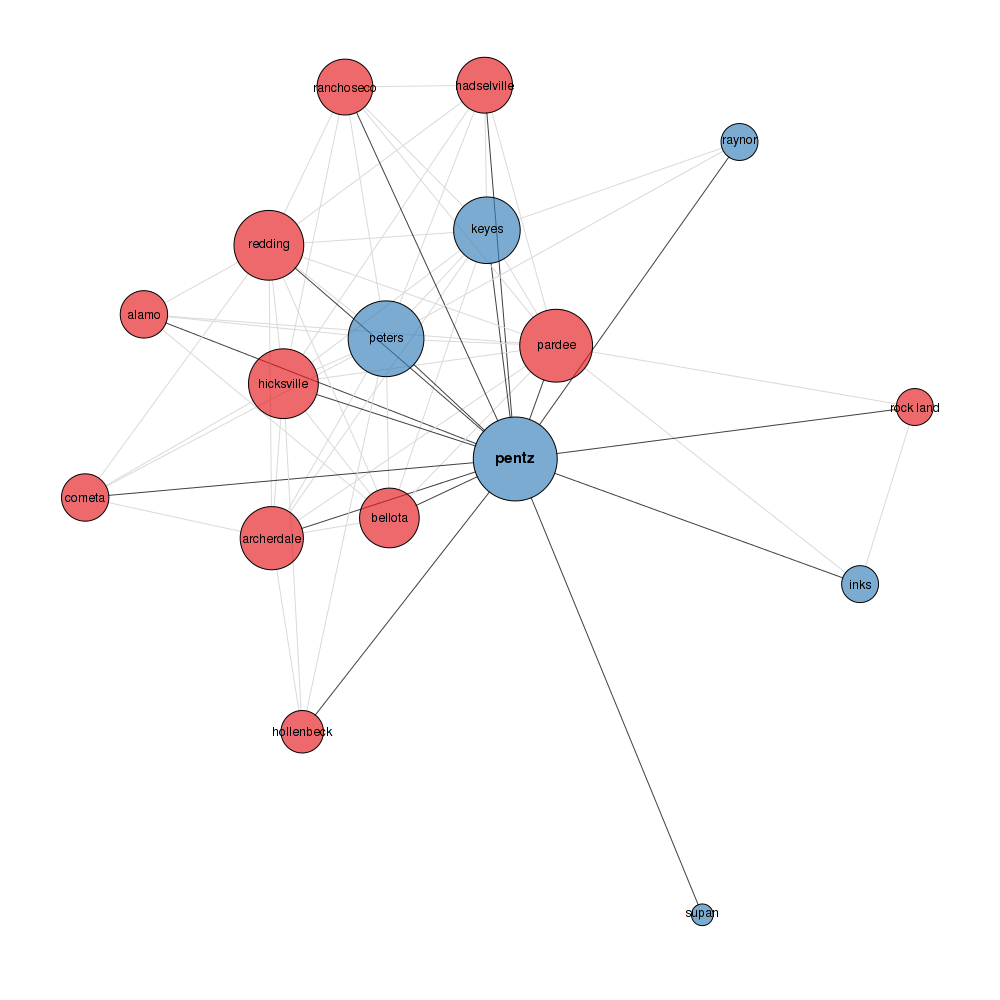
- Associated soils network diagram via URL. Node proximity within the network diagram is based on how frequently each pair of components occur together within the same map unit; closer proximity denotes higher co-occurrence. Adjust URL below to customize.
- All of these new features plus more, now available on the Series Summary Page. Adjust URL to customize.
