
Update to a previous post on mapping wireless network information with GRASS, kismet, and a custom python script. This time, some modifications to the python XML-processing script so that we can work directly with the Kistmet-xxx.gps files. Processing the .gps files allows one to produce a shapefile from each trip to the field. The shapefiles can be combined in a GIS (like GRASS) with simple vector processing (i.e. patching). Example steps are presented below, complete with an RST-based interpolation of wifi card signal and noise observations.
Approximately 7500 observations (signal, noise, location, network id, location) were collected with kismet/gpsd and processed with a custom python script (see attached file at bottom of page). Wireless signal maps for a specific network were created in GRASS via interpolation.
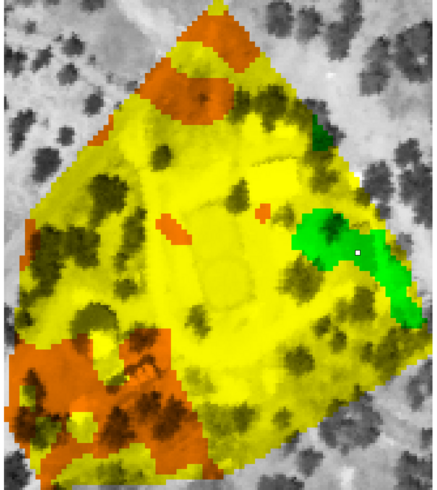
wifi signal quality map: good quality (green), fair (yellow), poor (orange)
Vector Processing
# convert Kismet .gps file into shapefiles
./process_kismet_gpslog.py -f Kismet-Aug-09-2007-4.gps -o wifi1.shp
./process_kismet_gpslog.py -f Kismet-Aug-10-2007-1.gps -o wifi2.shp
#
# import into GRASS
v.in.ogr dsn=wifi1.shp out=wifi1 --o
v.in.ogr dsn=wifi2.shp out=wifi2 --o
#
# patch them into a single file: not forgetting the attribute table
v.patch -e in=wifi1,wifi2 out=wifi
#
# make a convex hull to use as an interpolation mask
v.hull in=wifi out=wifi_hull
Raster Processing
# setup interpolation res
g.region res=2 vect=wifi
# convert wifi convex hull into raster mask
v.to.rast in=wifi_hull out=interp_mask use=val val=1
# interpolate via RST
# signal level, but only for a single network
v.surf.rst in=wifi zcol=signal elev=food_sig maskmap=interp_mask where="ssid = '00:13:10:88:AB:E2'" --o
# set new colormap
r.colors map=food_sig color=rainbow
#
# noise level, for all networks
v.surf.rst in=wifi zcol=noise elev=noise maskmap=interp_mask --o
#
# generate contours for later
r.contour in=food_sig out=food_sig_cont levels=-190,-200,-210 --o
Overview map with NAIP imagery contours suggest areas of optimal network coverage
g.region res=1
d.rgb r=naip.red g=naip.green b=naip.blue
d.vect food_sig_cont width=2 col=black
d.vect net_center icon=basic/box fcol=red size=10
d.vect wifi col=blue icon=basic/cross1 size=5 where="ssid = '00:13:10:88:AB:E2'"
d.out.file res=2 out=wifi_overview format=png --o
Signal and Noise maps interpolated via RST
# make the signal map
g.region res=1
d.erase
d.his i=naip.gr h=food_sig
d.vect net_center icon=basic/box fcol=white
d.barscale bcolor=none tcol=white
d.legend map=food_sig at=5,8,35,95 col=white
d.out.file out=wifi_signal format=png --o
#
# make the noise map:
d.erase
d.his i=naip.gr h=noise
d.vect net_center icon=basic/box fcol=white
d.barscale bcolor=none tcol=white
d.legend map=noise at=5,8,35,95 col=white
d.out.file out=wifi_noise format=png --o
