
Access Data Stored in a Postgresql Database
Overview
Perform some temporal aggregation (by day and by week) of the amount of data entry completed in Postgresql, and plot the results in R. See resulting figure at the bottom of the page. Note that this requires the Rdbi and RdbiPgSQL packages. Hints on installing these packages can be found on this page...
Weekly Aggregation hints from the psql manual page
SELECT week, count(week) AS entered
FROM
(
SELECT pedon_id, creation_date, extract( week FROM creation_date) AS week
FROM description
ORDER BY creation_date ASC
) AS a
GROUP BY a.week
ORDER BY week;
Daily Aggregation hints from the psql manual page
SELECT doy, count(doy) AS entered
FROM
(
SELECT pedon_id, creation_date, extract( doy FROM creation_date) AS doy
FROM description
ORDER BY creation_date ASC
) AS a
GROUP BY a.doy
ORDER BY doy;
R Example
##### load the samme data in from PgSQL #####

library(Rdbi)
library(RdbiPgSQL)

# conn becomes an object which contains the DB connection:
conn <- dbConnect(PgSQL(), host="localhost", dbname="xxx", user="xxx", password="xxx")
# see if the connection works (should report the list of table(s) if table(s) are existing):
# dbListTables(conn)

## create an object which contains the SQL query:
query <- dbSendQuery(conn, "select pedon_id, hz_number, name, top, bottom, ((bottom - top)/2 + top) as avgdepth, matrix_wet_color_hue, matrix_wet_color_value, matrix_wet_color_chroma, matrix_dry_color_hue, matrix_dry_color_value, matrix_dry_color_chroma from horizon  order by pedon_id, hz_number ")

# fetch data according to query:
x <- dbGetResult(query)

# create an object which contains the SQL query:
query <- dbSendQuery(conn, "select doy, count(doy) as entered from (select pedon_id, creation_date, extract( doy from creation_date) as doy from description order by creation_date asc ) as a group by a.doy order by doy;")

# fetch data according to query:
y <- dbGetResult(query)

# setup plot environment
par(mfrow=c(2,1))

# plot cumulative progress, by week
plot(x$week, cumsum(x$entered), type='b', xlab='Week', ylab='Pedon Forms Completed', main='Weekly Progress')

# plot cumulative progress, by day
plot(y$doy, cumsum(y$entered), type='b', xlab='Day of Year', ylab='Pedon Forms Completed', main='Daily Progress')
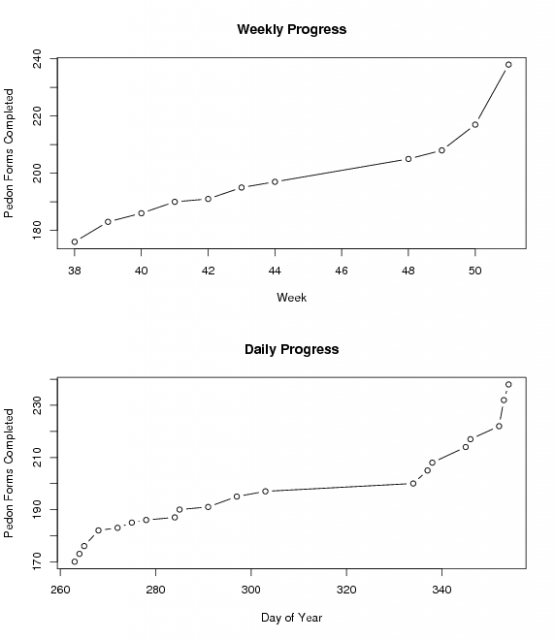
Pedon entry progress
