
Generic Mapping Tools: high quality map production
The creation of print quality maps can be a daunting task, especially when a scaleble output format (such as PDF) is required. Fortunately the Generic Mapping tools can be used to transform geographic data into conveniently packaged EPS or PDF files. Link to Perl-GMT example page. Excellent tutorial on grdimage.
Simple unix style commands are used to overlay subsequent layers of geographic information into either a Postscript or an EPS file. An example map consisting of California county boundaries, a hillshade of topography, and GPS points is presented below. the GMT commands required to prepare this map are listed below. Command names are in boldface type, input files are red, and output files are in green. A more detailed example on using data generated with GRASS in GMT can be found here: GRASS Users Group of Davis, CA.
PDF file: ssc105_map.pdf
Commands below
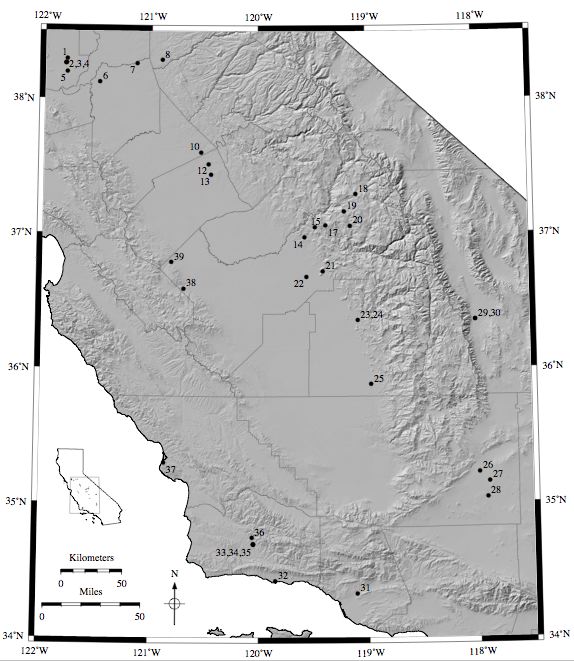
An example map created with GMT
GMT Commands:
- Setup some default parameters for GMT
ANNOT_FONT_SIZE_PRIMARY 10 ANNOT_FONT_SIZE_SECONDARY 10 HEADER_FONT Times-Roman \
LABEL_FONT Times-Roman LABEL_FONT_SIZE 10 HEADER_FONT_SIZE 10 PAPER_MEDIA letter \
UNIX_TIME_POS 0i/-1i PS_COLOR CMYK Y_AXIS_TYPE ver_text PLOT_DEGREE_FORMAT DF
- Create a basemap, with lat/lon tics
- Plot the landform raster data with a grayscale color table
grdimage shade.grd=2 -Cgrey.cpt -J -R -K -O -V >> ssc105s.ps
- Create scale bars in miles and kilometers
psbasemap -J -R -Lf-121.5/34.25/34/50m:"Miles": -O -K -P -V >> ssc105s.ps
- Plot some vector data: Ca outline, Ca counties, and pit locations
psxy ca.xy -M -J -R -W3/0/0/0 -P -O -K -V >> ssc105s.ps
psxy pit_locations.xy -J -R -Sc0.15c -W1/0/0/0 -G0/0/0 -P -O -K -V >> ssc105s.ps
- Label the pit locations
- Make a small context map showing the entire state
psxy pit_locations.xy -J -R -Sc0.01c -W1/0/0/0 -G0/0/0 -P -O -K -V >> ssc105s.ps
psxy zoom_extent.xy -M -JB -R -W1/0/0/0 -P -O -V >> ssc105s.ps
Getting Background Raster Data from NASA (From a Lon/Lat Location in GRASS)
- After setting up the region, get the global mosaic base (true color) map.
mapserver=http://wms.jpl.nasa.gov/wms.cgi output=wms_global_mosaic \
format=png
- Simple export to GMT compatible format. Since we are using integer data, and separate R/G/B rasters, the process is very simple:
r.out.bin -i -h in=wms_global_mosaic.red out=grd_red
r.out.bin -i -h in=wms_global_mosaic.blue out=grd_blue
- Add to a GMT map with:
