
Pedon Data collection and entry graphs
Overview
Two illustrations describing the progress over time for two tasks: the collection of pedon data in the field, and the input of this data into PedLogic. Number of pedons associated with individual workers are summarized by day. Note that data was usually collected in teams. Click on figures for larger version.
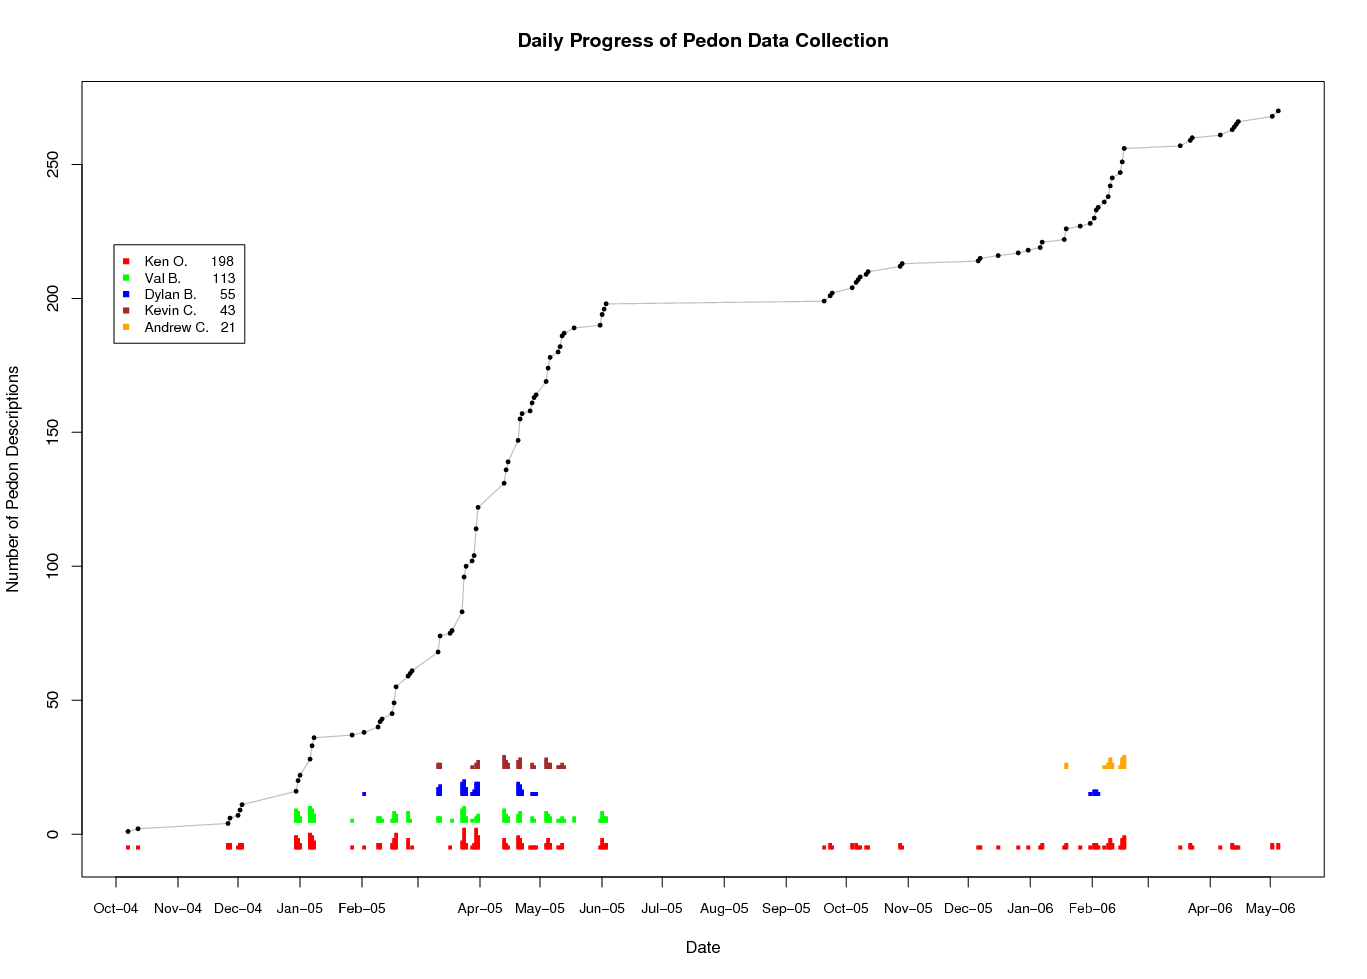
Pedon data collection: Simple graph summarizing the collection of pedon data at PINN.
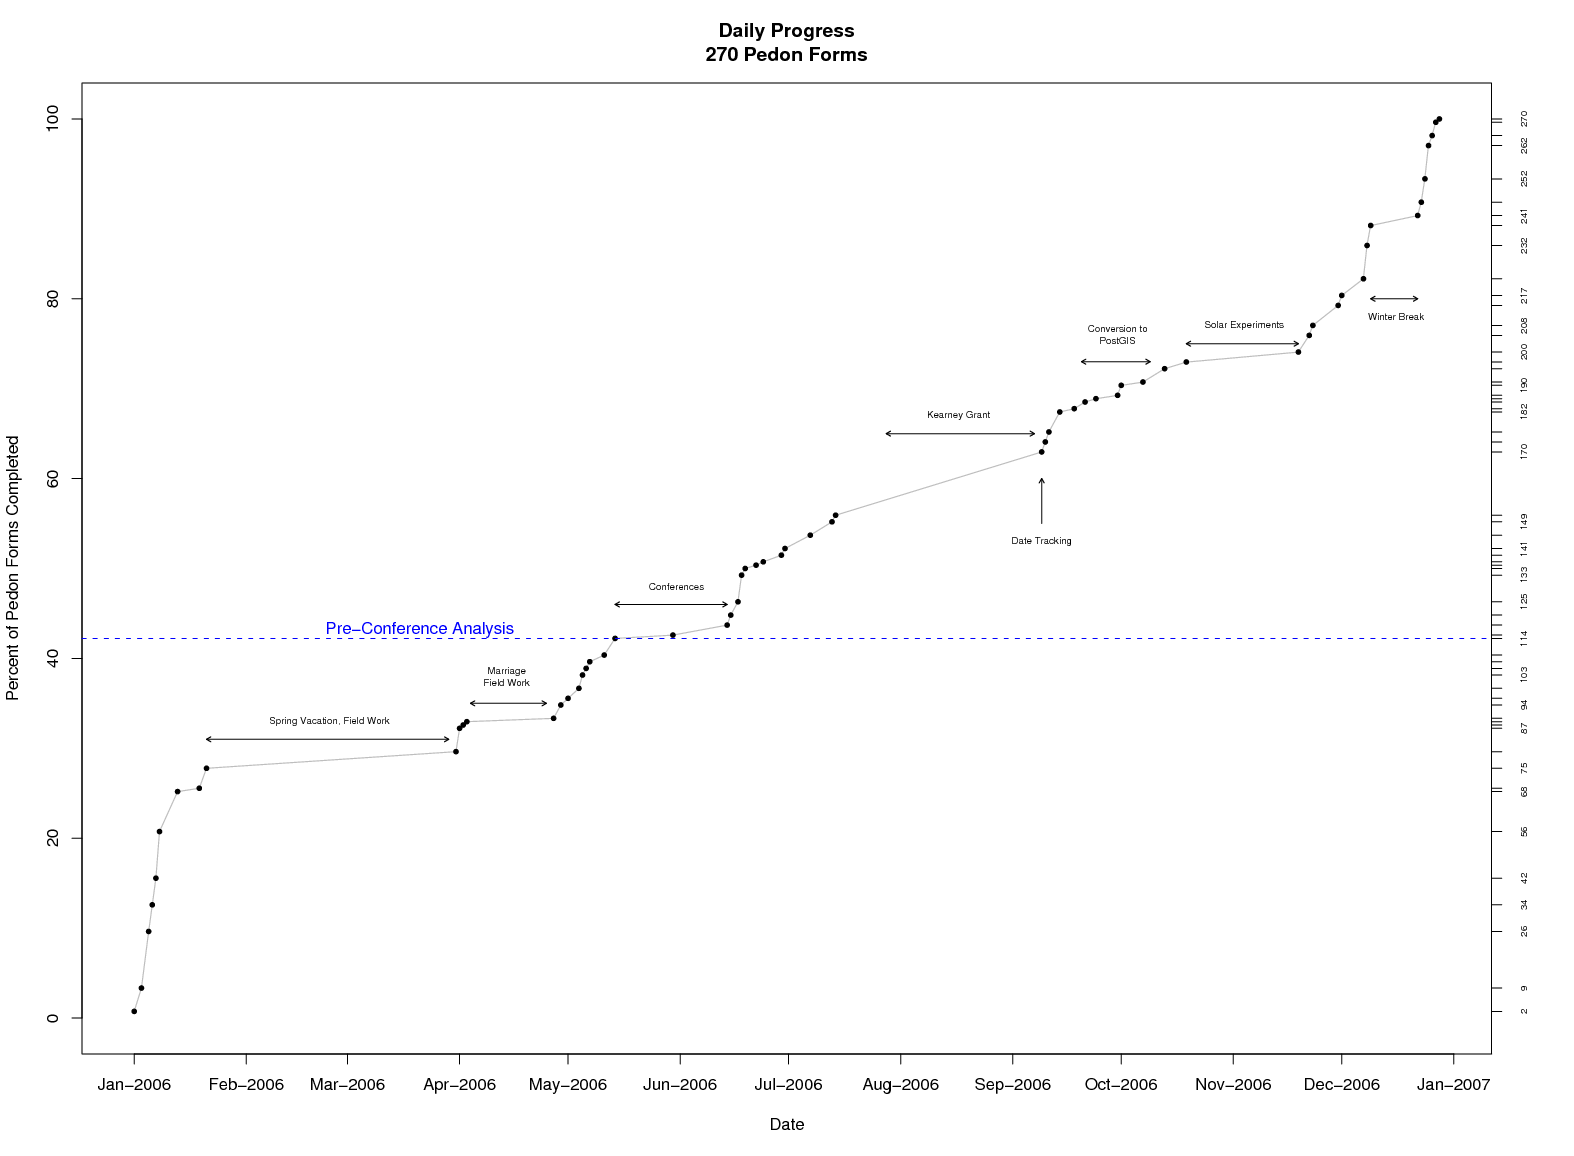
Pedon data entry into PedLogic: Simple illustration of my progress entering pedon data into our soil profile management system PedLogic.
Figures made in R
