Making Sense of Large Piles of Soils Information: Soil Taxonomy
May 27, 2009 metroadmin Soil Data
Field and lab characterization of soil profile data result in the accumulation of a massive, multivariate and three-dimensional data set. Classification is one approach to making sense of a large collection of this type of data. US Soil Taxonomy is the primary soil classification system used in the U.S.A and many other countries. This system is hierarchical in nature, and makes use on the presence or absence of diagnostic soil features. A comprehensive discussion of Soil Taxonomy is beyond the scope of this post. A detailed review of Soil Taxonomy can be found in Buol, S. W.; Graham, R. C.; McDaniel, P. A. & Southard, R. J. Soil Genesis and Classification Iowa State Press, 2003.
Visualization of Soil Profiles
We are working on a general-purpose soil profile visualization library (libSoil), based on PHP and PHP-GD. We are planning to release the source code for this library bundled with a related project PedLogic once they are completed (2010).

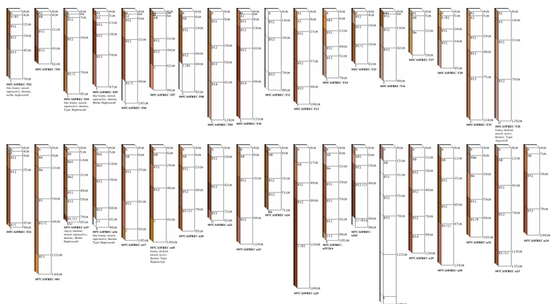
SFREC Soil Profile Examples: collection of soil profile summaries from the Sierra Field Station, near Marrysville, CA.
Visualization of Hierarchies
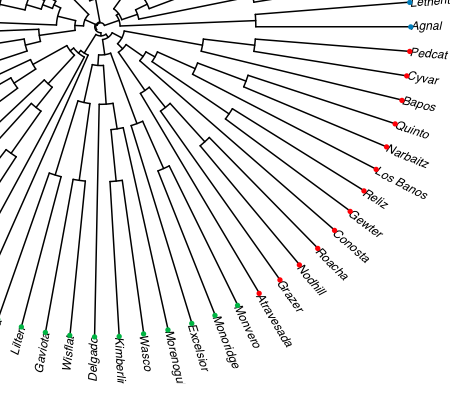
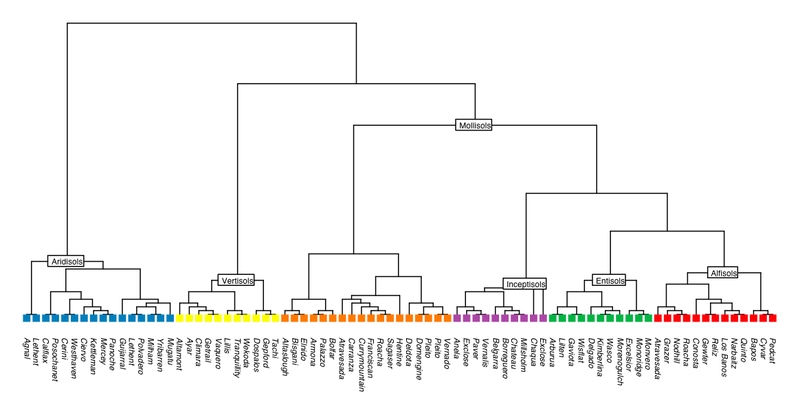
The ape library for R is an excellent tool for building and manipulating phylogenetic tree structures. Although Soil Taxonomy does not sort soils based on the notion of a "common ancestor", a phylogenetic tree is an effective tool for illustrating the hierarchical relationships between soils. The figure below shows the breakdown of named soils (soil series) from western Fresno county, along the hierarchy: order -- suborder -- greatgroup -- subgroup. The soil order labels on the figure below (nearly) match the "leaves" at the terminal ends of the tree. I need to spend some more time with the ape and geiger manuals; and will post back with some sample R code related to the presentation of soils data in tree structures.

Western Fresno Soil Hierarchy 1: taxonomic hierarchy, colors denote soil order

