
Something fun to play with before the new year: experimental code in aqp for simulating soil profile data from a single "template" profile. The basic idea: simulate horizon thickness data using a family of Gaussian functions with mean defined by horizon thickness values found in the template and standard deviation defined by the user. Larger hz.sd values will yield more drastic variation in the simulated results. Note that only "horizonation" (e.g. the sequence of horizons and their respective thickness) is simulated; horizon attributes (e.g. texture, pH, etc.) are copied from the "template" profile.
Basic usage is demonstrated below, see package manual page for details. This function is only available in the version of aqp hosted by R-Forge. It should be on CRAN by the new year.
Example
library(aqp)
# load sample data and convert into SoilProfileCollection
data(sp3)
depths(sp3) <- id ~ top + bottom
# select a profile to use as the basis for simulation
s <- sp3[3, ]
# reset horizon names
s$name <- paste('H', seq_along(s$name), sep='')
# simulate 25 new profiles, using 's' and function defaults
sim.1 <- sim(s, n=25)
# simulate 25 new profiles using 's' and variable SD for each horizon
sim.2 <- sim(s, n=25, hz.sd=c(1, 2, 5, 5, 5, 10, 2))
# plot
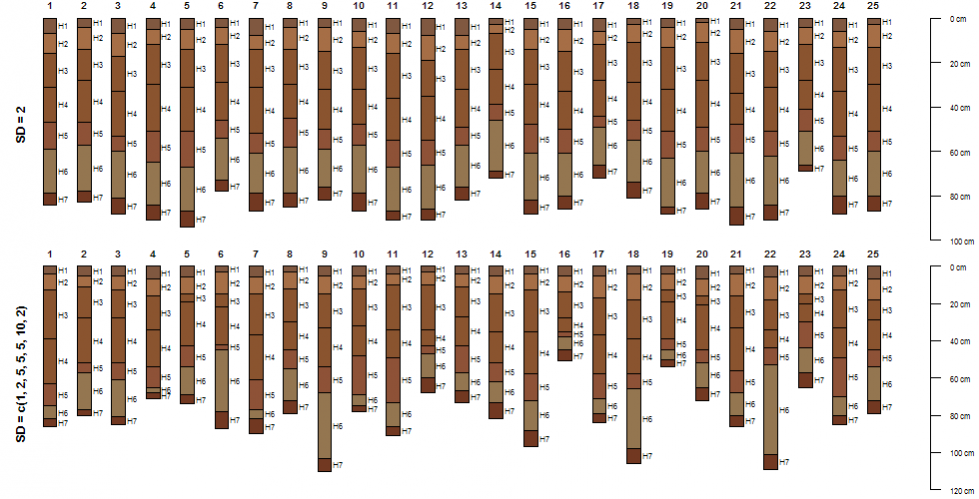
par(mfrow=c(2,1), mar=c(0, 0, 0, 0))
plot(sim.1)
mtext('SD = 2', side=2, line=-1.5, font=2, cex=0.75)
plot(sim.2)
mtext('SD = c(1, 2, 5, 5, 5, 10, 2)', side=2, line=-1.5, font=2, cex=0.75)
# aggregate horizonation of simulated data
# note: set class_prob_mode=2 as profiles were not defined to a constant depth
sim.2$name <- factor(sim.2$name)
a <- slab(sim.2, ~ name, class_prob_mode=2)
# convert to long format for plotting simplicity
library(reshape)
a.long <- melt(a, id.vars=c('top','bottom'), measure.vars=levels(sim.2$name))
# plot horizon probabilities derived from simulated data
# dashed lines are the original horizon boundaries
library(lattice)
xyplot(top ~ value, groups=variable, data=a.long, subset=value > 0,
ylim=c(100, -5), type=c('l','g'), asp=1.5,
ylab='Depth (cm)', xlab='Probability',
auto.key=list(columns=4, lines=TRUE, points=FALSE),
panel=function(...) {
panel.xyplot(...)
panel.abline(h=s$top, lty=2, lwd=2)
})
