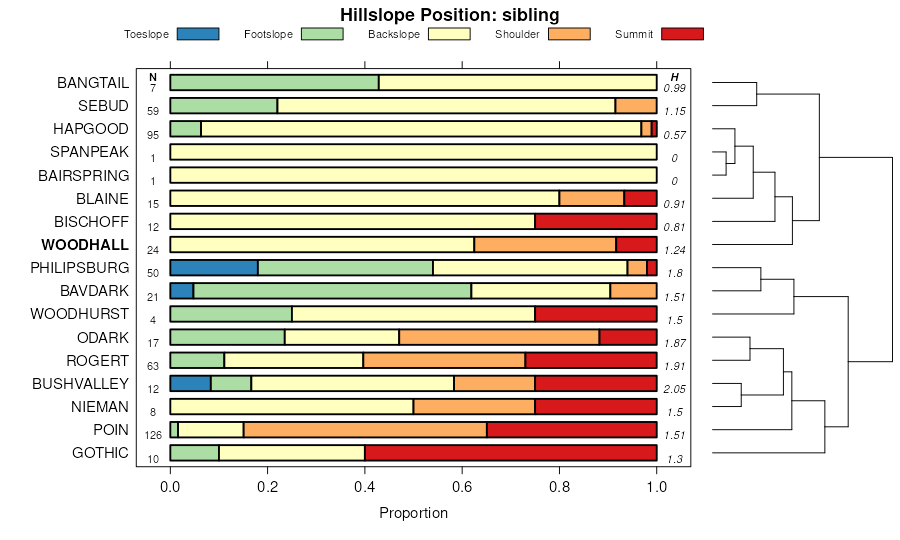
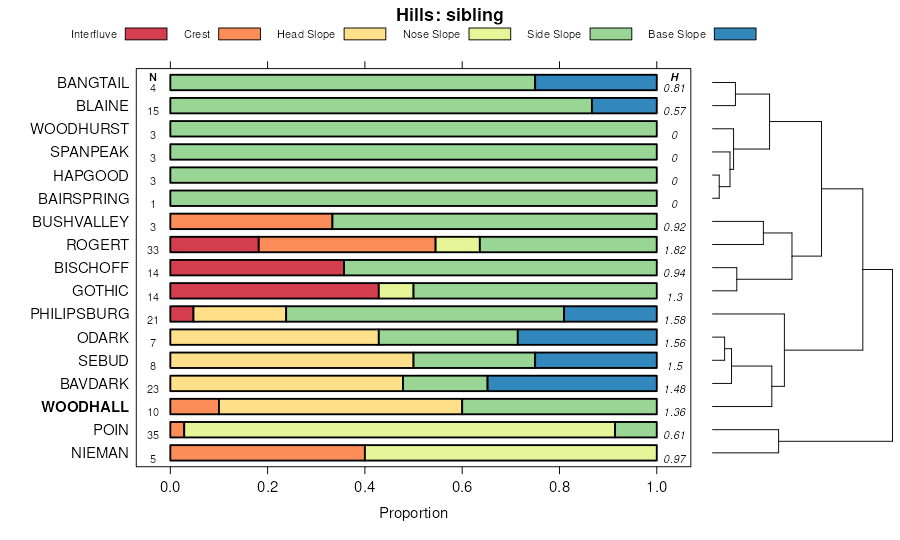
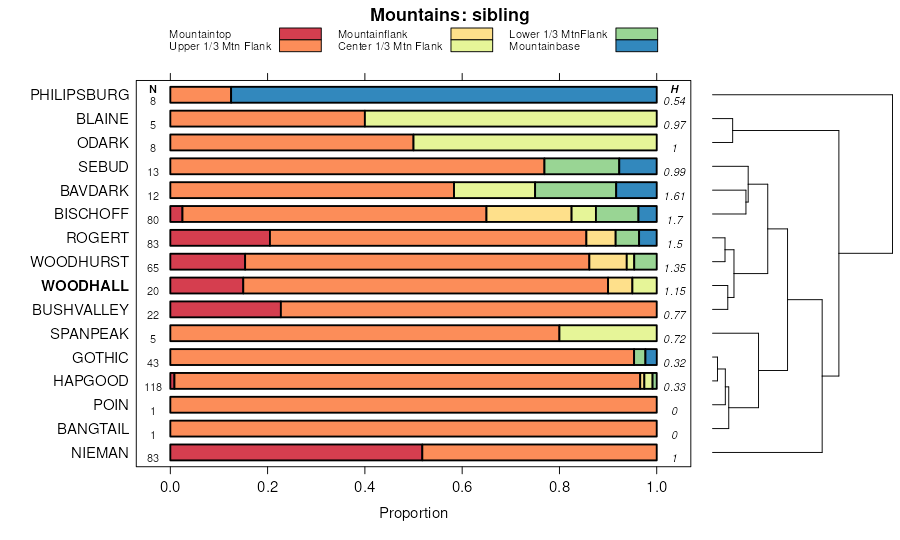
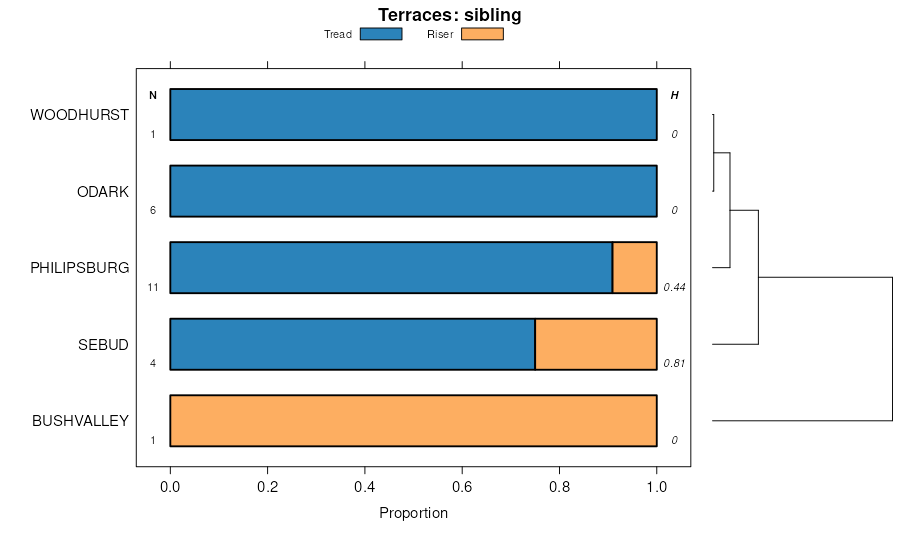
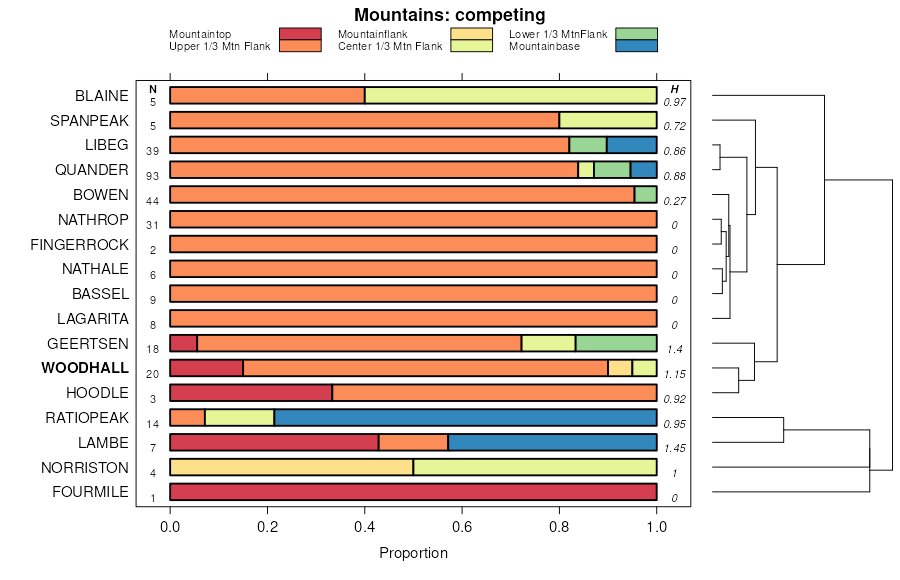
| Lambe-Woodhall complex, 5 to 65 percent slopes | LbF | 18126 | 1151629 | 17ncb | co023 | 2009 | 1:24000 |
Rogert-Woodhall complex, 25 to 65 percent slopes | 74 | 10725 | 496514 | jnnl | co627 | 1980 | 1:24000 |
Woodhall-Rock outcrop complex, 5 to 20 percent slopes | 94 | 638 | 496536 | jnp9 | co627 | 1980 | 1:24000 |
Rogert-Woodhall extremely cobbly sandy loams, 20 to 45 percent | 31 | 20181 | 498396 | jqm9 | co635 | 1979 | 1:24000 |
Woodhall-Rogert extremely cobbly sandy loams, 5 to 20 percent | 50 | 11400 | 498417 | jqmz | co635 | 1979 | 1:24000 |
Woodhall family very gravelly loam, 15 to 40 percent slopes | 225C | 462 | 509311 | k2zd | co647 | | 1:24000 |
Woodhall loam, 15 to 50 percent slopes | 92 | 6413 | 497922 | jq40 | co649 | 1977 | 1:24000 |
Woodhall loam, 6 to 15 percent slopes | 91 | 1119 | 497921 | jq3z | co649 | 1977 | 1:24000 |
Woodhall gravelly loam, 6 to 50 percent slopes, extremely stony | 112 | 4267 | 497942 | jq4n | co655 | 1984 | 1:24000 |
Woodhall-Bushvalley complex, 15 to 65 percent slopes | 201 | 22501 | 509573 | k37v | co660 | 1994 | 1:24000 |
Beachcanyon, extremely bouldery-Gothic-Woodhall, rubbly complex, 10 to 50 percent slopes | 919 | 564 | 2990846 | 2kmmt | co660 | 1994 | 1:24000 |
Woodhall, dry-Bushvalley complex, 5 to 40 percent slopes | 202 | 500 | 509575 | k37x | co660 | 1994 | 1:24000 |
Gothic-Woodhall, very stony complex, 3 to 25 percent slopes | 965 | 103 | 2927466 | 17mvw | co660 | 1994 | 1:24000 |
Woodhall extremely rocky loam, 5 to 50 percent slopes | WoF | 16722 | 498235 | jqg3 | co662 | 1968 | 1:24000 |
Beachcanyon, extremely bouldery-Gothic-Woodhall, rubbly complex, 10 to 50 percent slopes | 919 | 825 | 2990847 | 2kmmt | co662 | 1968 | 1:24000 |
Beachcanyon, extremely bouldery-Gothic-Woodhall, rubbly complex, 10 to 50 percent slopes | 919 | 8405 | 2990848 | 2kmmt | co674 | 1998 | 1:24000 |
Gothic-Woodhall, very stony complex, 3 to 25 percent slopes | 965 | 66 | 2927460 | 17mvw | co674 | 1998 | 1:24000 |
Gothic-Woodhall, very stony complex, 3 to 25 percent slopes | 965 | 1202 | 2927475 | 17mvw | co675 | 1986 | 1:24000 |
Beachcanyon, extremely bouldery-Gothic-Woodhall, rubbly complex, 10 to 50 percent slopes | 919 | 973 | 2927471 | 2kmmt | co675 | 1986 | 1:24000 |
Woodhall, rubbly-Gothic complex, 3 to 25 percent slopes | 956 | 162 | 2927478 | 17sj3 | co675 | 1986 | 1:24000 |
Woodhall, rubbly-Gothic complex, 3 to 25 percent slopes | 956 | 321 | 2990894 | 17sj3 | co676 | 1983 | 1:24000 |
Gothic-Woodhall, very stony complex, 3 to 25 percent slopes | 965 | 64 | 2990896 | 17mvw | co676 | 1983 | 1:24000 |
Beachcanyon, extremely bouldery-Gothic-Woodhall, rubbly complex, 10 to 50 percent slopes | 919 | 20945 | 2372362 | 2kmmt | co677 | 2018 | 1:24000 |
Woodhall, rubbly-Gothic complex, 3 to 25 percent slopes | 956 | 3574 | 1155621 | 17sj3 | co677 | 2018 | 1:24000 |
Gothic-Woodhall, very stony complex, 3 to 25 percent slopes | 965 | 2033 | 1151150 | 17mvw | co677 | 2018 | 1:24000 |
Woodhall-Cheadle-Rock outcrop complex, 3 to 25 percent slopes | 125 | 3542 | 496850 | jp0f | co684 | 1984 | 1:24000 |
Philipsburg-Nieman-Woodhall complex, 4 to 15 percent slopes, very stony | 550D | 397 | 3039582 | wfwc | mt602 | 1963 | 1:20000 |
Woodhall-Woodhurst, very stony-Bavdark complex, 8 to 15 percent slopes | 38D | 208 | 3039583 | 1hf4y | mt602 | 1963 | 1:20000 |
Woodhall-Woodhurst complex, 15 to 35 percent slopes, stony | 38E | 74 | 3039584 | 1hf54 | mt602 | 1963 | 1:20000 |
Woodhall gravelly loam, 4 to 15 percent slopes | 156 | 326 | 1859670 | 20f4c | mt605 | 2007 | 1:24000 |
Woodhall-Blaine-Hapgood complex, 4 to 25 percent slopes | 157 | 133 | 1859671 | 4xcn | mt605 | 2007 | 1:24000 |
Woodhall-Woodhurst, very stony-Bavdark complex, 8 to 15 percent slopes | 38D | 95 | 3039704 | 2pg61 | mt613 | 1975 | 1:24000 |
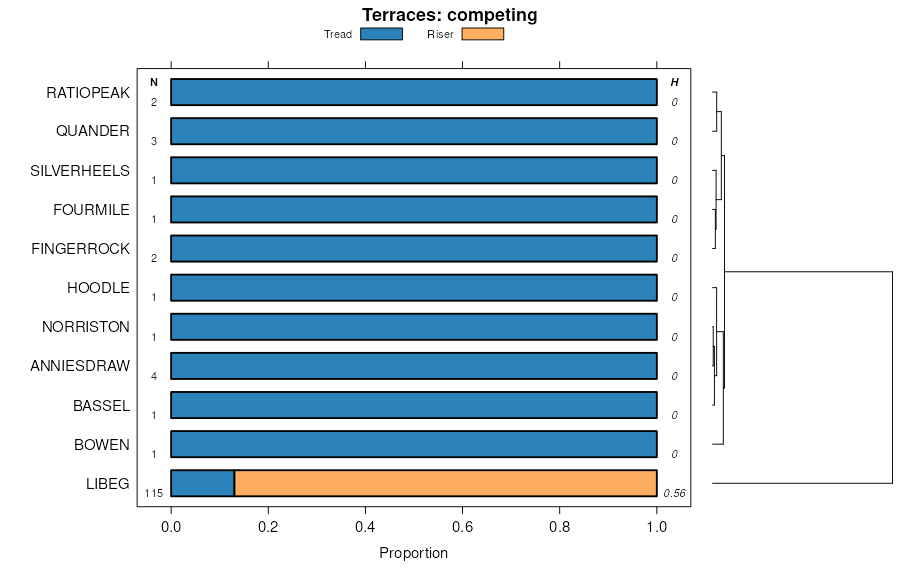
Libeg-Woodhall complex, 4 to 8 percent slopes | 560C | 642 | 2493430 | 2pqdg | mt624 | 2021 | 1:24000 |
Philipsburg, very bouldery-Nieman, very stony-Woodhall, very stony complex, 4 to 15 percent slopes | 550D | 25 | 2979644 | 2l9xv | mt624 | 2021 | 1:24000 |
Woodhall-Woodhurst complex, 15 to 35 percent slopes, stony | 38E | 10 | 3176848 | 1hf54 | mt624 | 2021 | 1:24000 |
Woodhall-Woodhurst, very stony-Bavdark complex, 8 to 15 percent slopes | 38D | 3793 | 2486294 | 2pg61 | mt632 | | 1:24000 |
Surdal-Woodhall-Poin complex, 20 to 60 percent slopes | 171F | 3423 | 2392786 | 2l9wn | mt632 | | 1:24000 |
Woodhall-Woodhurst complex, 15 to 35 percent slopes, stony | 38E | 2842 | 2392756 | 2l9vp | mt632 | | 1:24000 |
Philipsburg, very bouldery-Nieman, very stony-Woodhall, very stony complex, 4 to 15 percent slopes | 550D | 1870 | 2392823 | 2l9xv | mt632 | | 1:24000 |
Nieman, very bouldery-Woodhall, very bouldery-Sebud complex, 15 to 45 percent slopes | 165E | 1432 | 2486245 | 2pg4g | mt632 | | 1:24000 |
Philipsburg-Woodhall, stony-Bangtail complex, 15 to 35 percent slopes | 538E | 1060 | 2486264 | 2pg52 | mt632 | | 1:24000 |
Odark-Bischoff-Woodhall, stony families, complex, 2 to 8 percent slopes | 3150C | 295 | 2724639 | 2sh7z | mt632 | | 1:24000 |
Woodhall-Blaine-Hapgood complex, 4 to 25 percent slopes | 157 | 11722 | 146433 | 4xcn | mt636 | 1983 | 1:24000 |
Woodhall gravelly loam, 4 to 15 percent slopes | 156 | 5421 | 146432 | 4xcm | mt636 | 1983 | 1:24000 |
Woodhall-Woodhurst, very stony-Bavdark complex, 8 to 15 percent slopes | 38D | 8072 | 1383032 | 1hf4y | mt637 | 2014 | 1:24000 |
Woodhall-Woodhurst complex, 15 to 35 percent slopes, stony | 38E | 7957 | 1383038 | 1hf54 | mt637 | 2014 | 1:24000 |
Bairspring-Woodhall-Poin complex, 20 to 60 percent slopes | 171F | 6019 | 1383373 | 1hfhy | mt637 | 2014 | 1:24000 |
Nieman, very bouldery-Woodhall, very bouldery-Sebud complex, 15 to 45 percent slopes | 165E | 5495 | 637271 | pd44 | mt637 | 2014 | 1:24000 |
Philipsburg-Woodhall, stony-Bangtail complex, 15 to 35 percent slopes | 538E | 2945 | 1389503 | 1hmwp | mt637 | 2014 | 1:24000 |
Philipsburg-Nieman-Woodhall complex, 4 to 15 percent slopes, very stony | 550D | 1743 | 817698 | wfwc | mt637 | 2014 | 1:24000 |
Woodhall, very bouldery-Nieman, extremely stony complex, 4 to 15 percent slopes | 165D | 830 | 637260 | pd3s | mt637 | 2014 | 1:24000 |
Odark-Bischoff-Woodhall, stony families, complex, 2 to 8 percent slopes | 3150C | 60 | 3094125 | 2sh7z | mt657 | 1990 | 1:24000 |
Wineglass-Woodhall-Spanpeak complex, 15 to 60 percent slopes | 5614F | 7643 | 156479 | 57tq | mt669 | | 1:24000 |
Bangtail, extremely stony-Woodhal, very stony-Dalys, extremely stony, complex, 4 to 70 percent slopes | 5705F | 1604 | 699352 | rgqr | mt669 | | 1:24000 |
Spanpeak, very stony - Woodhall, stony - Adel complex, 15 to 60 percent slopes | 8602F | 1075 | 156766 | 583z | mt669 | | 1:24000 |
Tepecreek-like-Woodhall complex, 2 to 8 percent slopes | 7201 | 404 | 3133274 | 2ynn2 | wy629 | | 1:24000 |
Woodhall-Zade-like-Chittum-like complex, 2 to 12 percent slopes | 7301 | 61 | 3133276 | 2ynn4 | wy629 | | 1:24000 |