| Moskee fine sandy loam, 0 to 6 percent slopes | P240B | 123 | 2733116 | 2rvdw | sd047 | 1980 | 1:24000 |
Moskee fine sandy loam, 0 to 6 percent slopes | 228 | 283 | 780143 | v5sx | wy011 | 1978 | 1:24000 |
Moskee sandy loam, 6 to 10 percent slopes | P242C | 108 | 2745708 | 2rvd3 | wy011 | 1978 | 1:24000 |
Nuncho-Moskee complex, moist, 6 to 10 percent slopes | P288C | 74 | 2745778 | 2rxs6 | wy011 | 1978 | 1:24000 |
Moskee fine sandy loam, 6 to 15 percent slopes | 250 | 48 | 780258 | v5xm | wy011 | 1978 | 1:24000 |
Moskee sandy loam, 2 to 6 percent slopes | P242B | 45 | 2745707 | 2rvd2 | wy011 | 1978 | 1:24000 |
Moskee-Manter fine sandy loams, 3 to 10 percent slopes | 164 | 18733 | 349642 | cqts | wy027 | 1993 | 1:24000 |
Moskee fine sandy loam, 0 to 3 percent slopes | 163 | 6786 | 349640 | cqtq | wy027 | 1993 | 1:24000 |
Moskee-Manter complex, dry, 0 to 6 percent slopes | 165 | 2844 | 349644 | cqtv | wy027 | 1993 | 1:24000 |
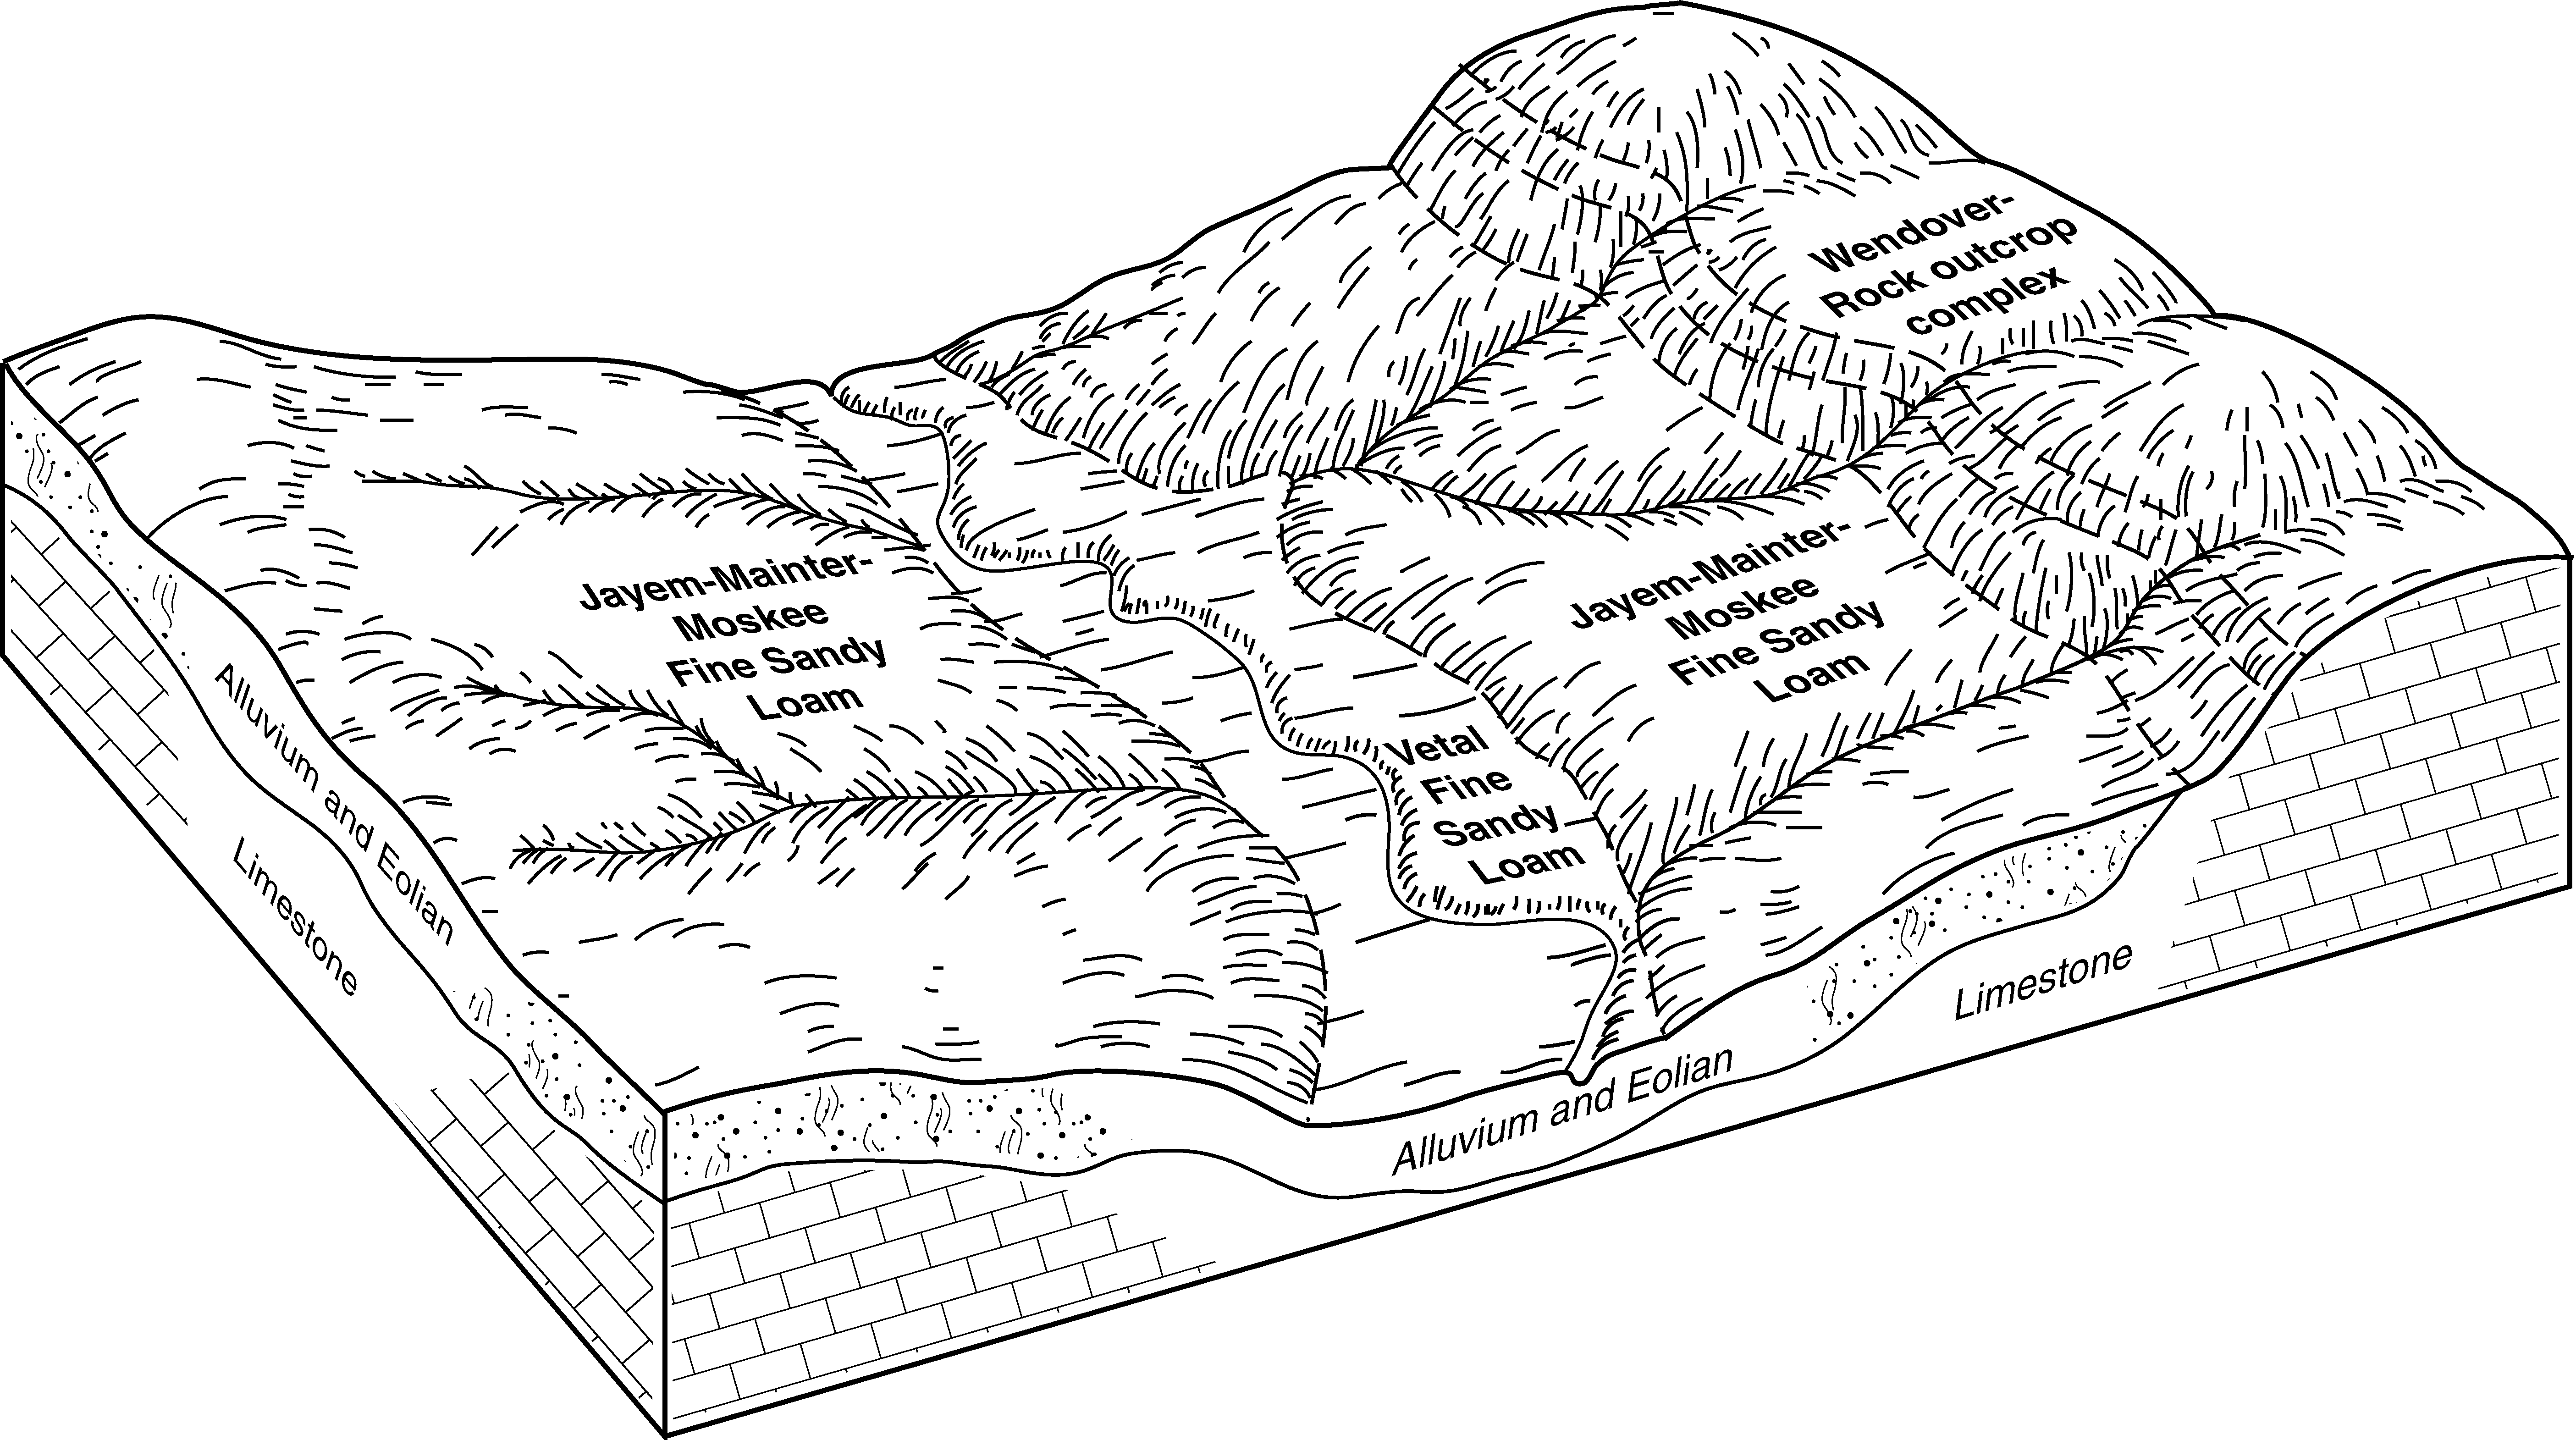
Jayem-Mainter-Moskee fine sandy loams, 0 to 6 percent slopes | 172 | 18655 | 104525 | 3hrs | wy031 | 1998 | 1:24000 |
Moskee fine sandy loam, 0 to 3 percent slopes | 193 | 6416 | 104549 | 3hsk | wy031 | 1998 | 1:24000 |
Moskee sandy loam, 0 to 6 percent slopes | 192 | 2640 | 104548 | 3hsj | wy031 | 1998 | 1:24000 |
Moskee fine sandy loam, 0 to 6 percent slopes | 185 | 2789 | 349881 | cr2h | wy605 | 1995 | 1:24000 |
Moskee fine sandy loam, 6 to 15 percent slopes | 186 | 124 | 349882 | 2ztz7 | wy605 | 1995 | 1:24000 |
Moskee-Manter fine sandy loams, 3 to 10 percent slopes | 200 | 7135 | 1669712 | 1t1gp | wy609 | 2006 | 1:24000 |
Moskee fine sandy loam, 0 to 3 percent slopes | 199 | 2194 | 1669713 | 1t1gq | wy609 | 2006 | 1:24000 |
Hargreave, family-Moskee fine sandy loams, 9 to 15 percent slopes | 149 | 10860 | 3460751 | 31hsn | wy633 | 1987 | 1:24000 |
Hargreave-Moskee sandy loams, 3 to 9 percent slopes | 148 | 10417 | 361137 | d3sl | wy633 | 1987 | 1:24000 |
Moskee-Noden complex, 0 to 9 percent slopes | 178 | 6847 | 361162 | d3td | wy633 | 1987 | 1:24000 |
Hargreave-Moskee association, dry, 3 to 15 percent slopes | 150 | 4752 | 361135 | d3sj | wy633 | 1987 | 1:24000 |
Moskee-Noden fine sandy loams, dry, 0 to 15 percent slopes | 180 | 3802 | 361178 | d3tx | wy633 | 1987 | 1:24000 |
Moskee sandy loam, 3 to 6 percent slopes | 176 | 3148 | 361164 | d3tg | wy633 | 1987 | 1:24000 |
Moskee-Noden fine sandy loams, 9 to 15 percent slopes | 179 | 2844 | 361161 | d3tc | wy633 | 1987 | 1:24000 |
Moskee-Worthenton, moist, association, 0 to 45 percent slopes | 183 | 2464 | 361175 | d3tt | wy633 | 1987 | 1:24000 |
Moskee sandy loam, 0 to 3 percent slopes | 175 | 2076 | 361165 | d3th | wy633 | 1987 | 1:24000 |
Moskee fine sandy loam, 6 to 15 percent slopes | 177 | 949 | 361163 | 2ztz7 | wy633 | 1987 | 1:24000 |
Moskee-Nuncho complex, 0 to 3 percent slopes | 181 | 738 | 361177 | d3tw | wy633 | 1987 | 1:24000 |
Moskee-Nuncho complex, 3 to 6 percent slopes | 182 | 169 | 361176 | d3tv | wy633 | 1987 | 1:24000 |
Moskee fine sandy loam, 0 to 6 percent slopes | 185 | 3529 | 817563 | wfr0 | wy705 | 2003 | 1:24000 |
Moskee fine sandy loam, 6 to 15 percent slopes | 186 | 28 | 3223113 | 2ztz7 | wy705 | 2003 | 1:24000 |
Jayem-Mainter-Moskee fine sandy loams, 0 to 6 percent slopes | 51 | 162 | 1414820 | 1jh7c | wy715 | 1974 | 1:20000 |
Moskee fine sandy loam, 0 to 3 percent slopes | 55 | 26 | 1414824 | 1jh7h | wy715 | 1974 | 1:20000 |
Moskee sandy loam, 3 to 6 percent slopes | 905 | 3185 | 1386566 | 1hjty | wy719 | 2013 | 1:24000 |
Moskee sandy loam, 0 to 3 percent slopes | 904 | 2669 | 1386565 | 1hjtx | wy719 | 2013 | 1:24000 |
Featherlegs, extremely stony-Moskee sandy loams, 6 to 15 percent slopes | 703 | 2098 | 1856745 | 20b30 | wy719 | 2013 | 1:24000 |
Moskee fine sandy loam, 6 to 15 percent slopes | 767 | 1990 | 1386817 | 2ztz7 | wy719 | 2013 | 1:24000 |
Hargreave-Moskee-Mittenbutte sandy loams, 3 to 25 percent slopes | 758 | 1628 | 1868154 | 20pz1 | wy719 | 2013 | 1:24000 |
Moskee fine sandy loam, 0 to 6 percent slopes | 766 | 1342 | 1386818 | 1hk32 | wy719 | 2013 | 1:24000 |
Featherlegs, extremely stony-Moskee sandy loams, 0 to 6 percent slopes | 712 | 1163 | 1868149 | 20pyw | wy719 | 2013 | 1:24000 |
Hargreave-Moskee sandy loams, 3 to 9 percent slopes | 759 | 807 | 1386240 | 1hjhf | wy719 | 2013 | 1:24000 |
Moskee sandy loam, 6 to 9 percent slopes | 906 | 698 | 1386567 | 1hjtz | wy719 | 2013 | 1:24000 |
Hargreave, family-Moskee fine sandy loams, 9 to 15 percent slopes | 760 | 42 | 3460749 | 31hsn | wy719 | 2013 | 1:24000 |
Moskee-Noden fine sandy loams, dry, 0 to 15 percent slopes | 748 | 9 | 1674097 | 1t614 | wy719 | 2013 | 1:24000 |
Moskee fine sandy loam, 0 to 3 percent slopes | 148 | 2469 | 104949 | 3j6g | wy721 | 1994 | 1:24000 |


