| Mitchell loam, 0 to 3 percent slopes | 68 | 22078 | 94552 | 35d2 | co075 | 1974 | 1:24000 |
Mitchell-Keota loams, 3 to 9 percent slopes | 70 | 18851 | 94555 | 35d5 | co075 | 1974 | 1:24000 |
Mitchell-Norka loams, 0 to 3 percent slopes | 71 | 8306 | 94556 | 35d6 | co075 | 1974 | 1:24000 |
Mitchell-Keota loams, 0 to 3 percent slopes | 69 | 1121 | 94553 | 35d3 | co075 | 1974 | 1:24000 |
Kim-Mitchell complex, 0 to 6 percent slopes | 31 | 64083 | 95123 | 35zh | co617 | 1980 | 1:24000 |
Kim-Mitchell complex, 6 to 9 percent slopes | 32 | 22482 | 95124 | 35zj | co617 | 1980 | 1:24000 |
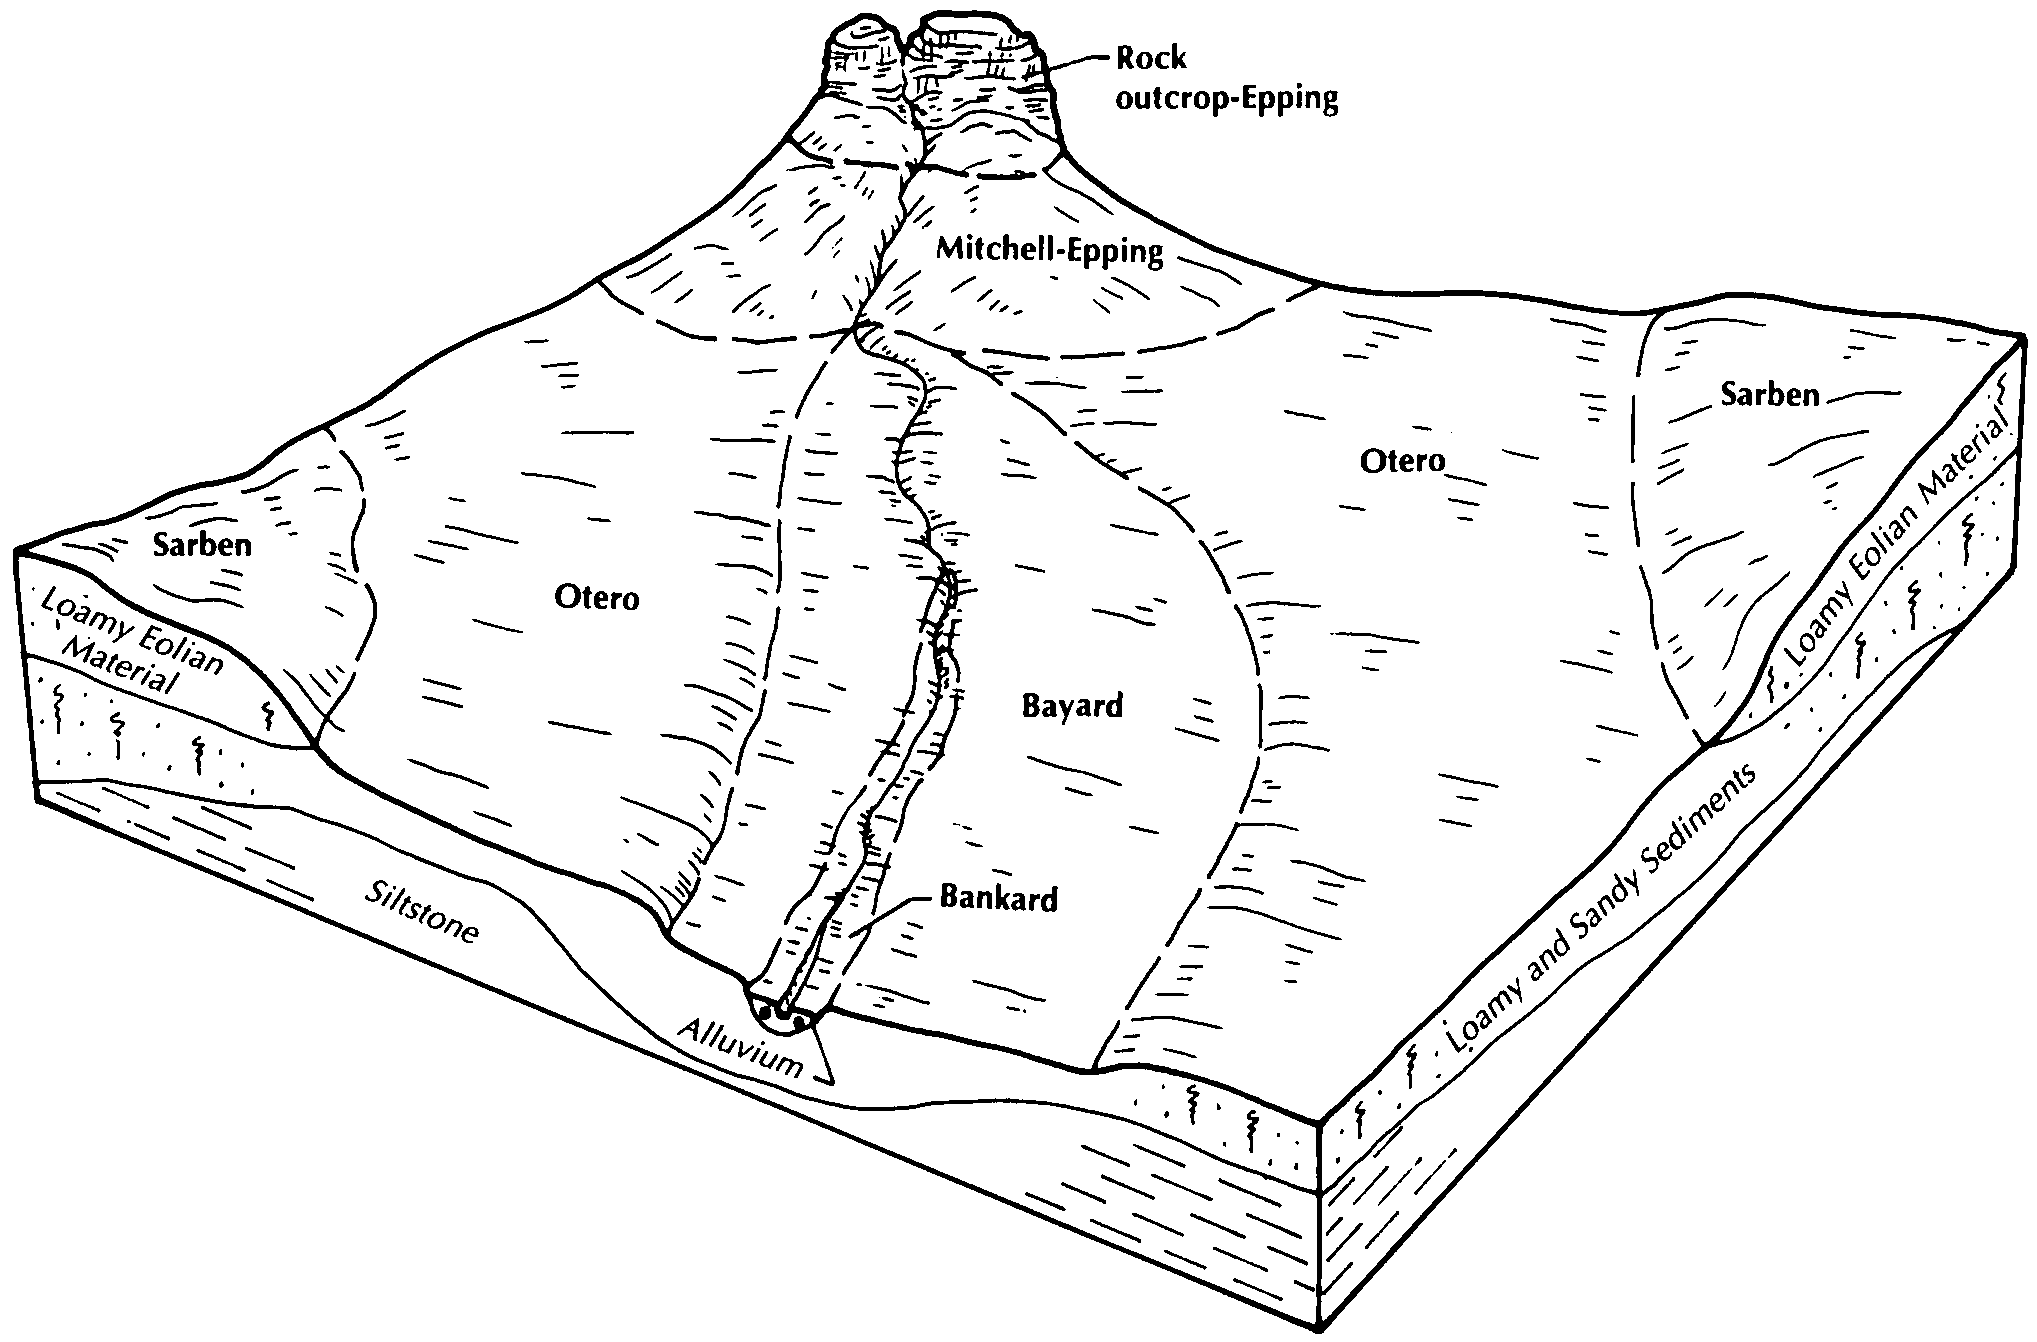
Mitchell-Epping complex, 9 to 30 percent slopes | 5849 | 9772 | 1692497 | 1tt5p | ne007 | 1988 | 1:20000 |
Mitchell very fine sandy loam, 3 to 6 percent slopes | 5845 | 4507 | 1692494 | 1tt5l | ne007 | 1988 | 1:20000 |
Mitchell very fine sandy loam, 6 to 9 percent slopes | 5846 | 3392 | 1692495 | 1tt5m | ne007 | 1988 | 1:20000 |
Mitchell very fine sandy loam, 1 to 3 percent slopes | 5844 | 2270 | 1692493 | 1tt5k | ne007 | 1988 | 1:20000 |
Mitchell-Epping complex, 3 to 9 percent slopes | 5848 | 1980 | 1692496 | 1tt5n | ne007 | 1988 | 1:20000 |
Mitchell very fine sandy loam, 0 to 1 percent slopes | 5843 | 1557 | 1692492 | 1tt5j | ne007 | 1988 | 1:20000 |
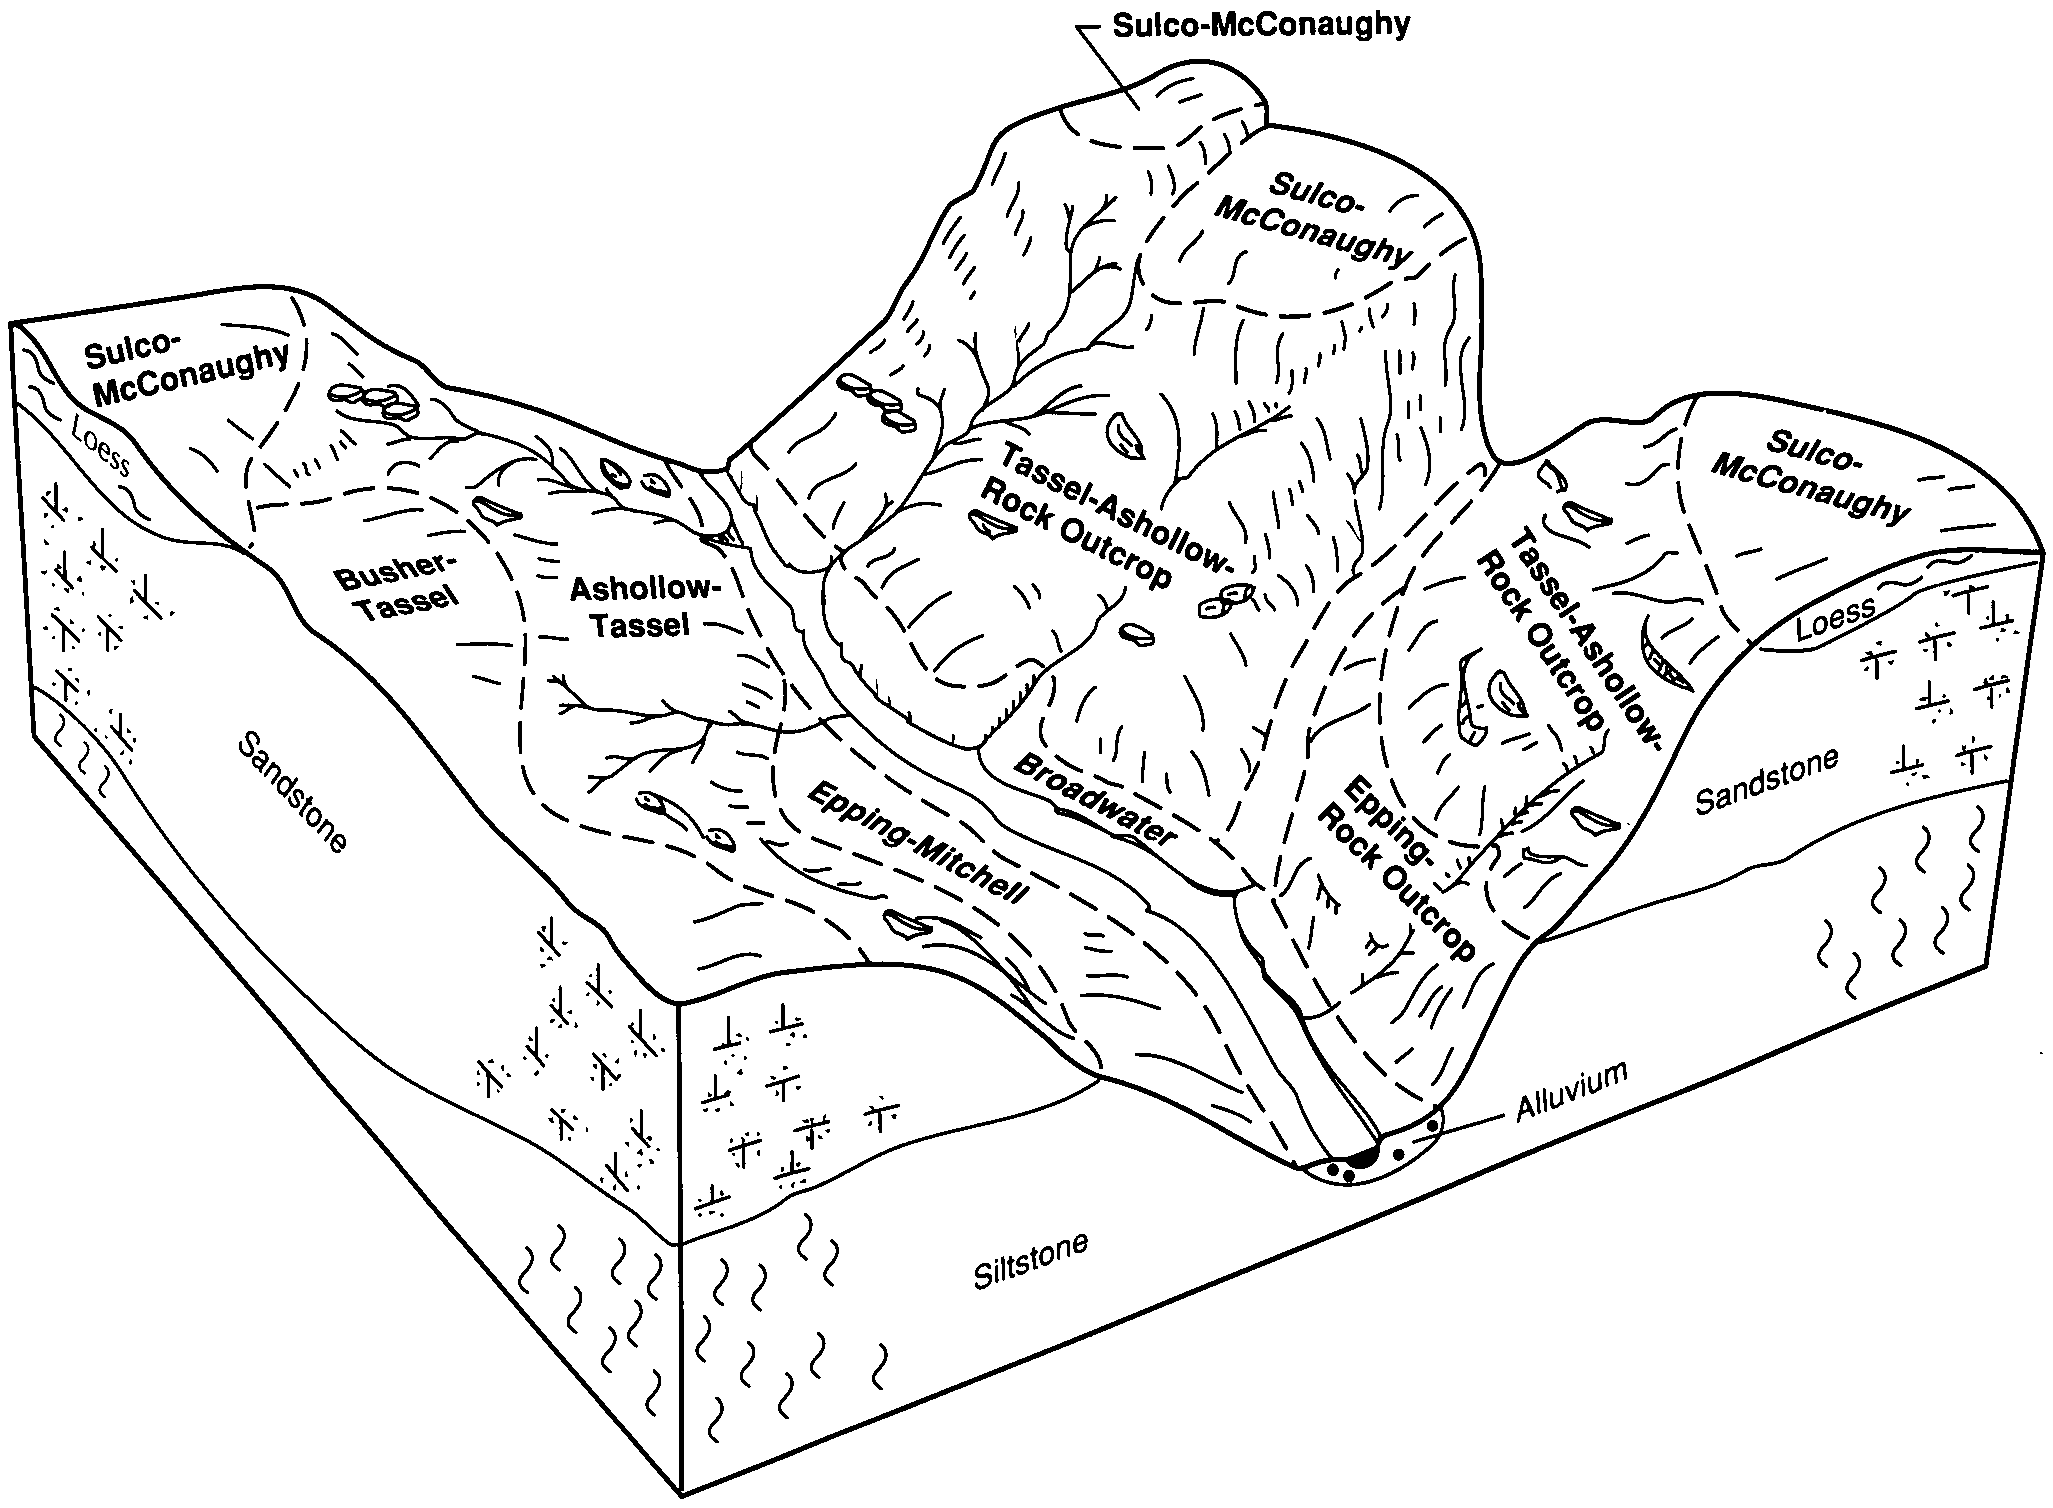
Epping-Mitchell complex, 3 to 20 percent slopes | 6205 | 2618 | 1698682 | 1v0m6 | ne033 | 1989 | 1:20000 |
Mitchell very fine sandy loam, 3 to 6 percent slopes | 5845 | 1212 | 1698699 | 1v0mr | ne033 | 1989 | 1:20000 |
Mitchell very fine sandy loam, 6 to 9 percent slopes | 5846 | 1168 | 1698700 | 1v0ms | ne033 | 1989 | 1:20000 |
Mitchell very fine sandy loam, 9 to 20 percent slopes | 5847 | 516 | 1698701 | 1v0mt | ne033 | 1989 | 1:20000 |
Mitchell silt loam, 9 to 20 percent slopes | 5839 | 15480 | 358132 | 2tvtt | ne045 | 1973 | 1:20000 |
Mitchell silt loam, 6 to 9 percent slopes | 5838 | 4098 | 358131 | d0nm | ne045 | 1973 | 1:20000 |
Mitchell silt loam, 0 to 1 percent slopes | 5834 | 2330 | 358129 | d0nk | ne045 | 1973 | 1:20000 |
Mitchell-Epping complex, 9 to 30 percent slopes | 5849 | 2124 | 358133 | d0np | ne045 | 1973 | 1:20000 |
Mitchell silt loam, 1 to 6 percent slopes | 5836 | 769 | 358130 | d0nl | ne045 | 1973 | 1:20000 |
Mitchell-Epping complex, 9 to 30 percent slopes | 5849 | 1268 | 1698765 | 1v0pw | ne069 | 1995 | 1:20000 |
Mitchell very fine sandy loam, 3 to 6 percent slopes | 5845 | 269 | 1698763 | 1v0pt | ne069 | 1995 | 1:20000 |
Mitchell very fine sandy loam, 6 to 9 percent slopes | 5846 | 148 | 1698764 | 1v0pv | ne069 | 1995 | 1:20000 |
Mitchell very fine sandy loam, 1 to 3 percent slopes | 5844 | 10334 | 1692637 | 1ttb6 | ne123 | 1981 | 1:20000 |
Mitchell very fine sandy loam, 3 to 6 percent slopes | 5845 | 8033 | 1692638 | 1ttb7 | ne123 | 1981 | 1:20000 |
Mitchell very fine sandy loam, 6 to 9 percent slopes | 5846 | 5125 | 1692639 | 1ttb8 | ne123 | 1981 | 1:20000 |
Mitchell very fine sandy loam, 9 to 20 percent slopes | 5847 | 3594 | 1692640 | 1ttb9 | ne123 | 1981 | 1:20000 |
Mitchell-Epping very fine sandy loams, 3 to 9 percent slopes | 5850 | 2950 | 1692641 | 1ttbb | ne123 | 1981 | 1:20000 |
Mitchell very fine sandy loam, 0 to 1 percent slopes | 5843 | 2741 | 1692636 | 1ttb5 | ne123 | 1981 | 1:20000 |
Mitchell-Epping very fine sandy loams, 9 to 20 percent slopes | 5851 | 1939 | 1692642 | 1ttbc | ne123 | 1981 | 1:20000 |
Mitchell silt loam, 0 to 1 percent slopes | 5834 | 32822 | 1653766 | 1shw9 | ne157 | 1965 | 1:20000 |
Mitchell silt loam, 1 to 3 percent slopes | 5835 | 28835 | 1653767 | 1shwb | ne157 | 1965 | 1:20000 |
Mitchell silt loam, 3 to 6 percent slopes | 5837 | 17376 | 1653768 | 1shwc | ne157 | 1965 | 1:20000 |
Mitchell silt loam, 6 to 9 percent slopes | 5838 | 12796 | 1653769 | 1shwd | ne157 | 1965 | 1:20000 |
Mitchell silt loam, thin, 6 to 9 percent slopes | 5841 | 4571 | 1653702 | 1sht7 | ne157 | 1965 | 1:20000 |
Mitchell silt loam, thin, 9 to 20 percent slopes | 5842 | 3963 | 1653703 | 1sht8 | ne157 | 1965 | 1:20000 |
Mitchell and Buffington soils, alkali, 0 to 3 percent slopes | 5830 | 3292 | 1653699 | 1sht4 | ne157 | 1965 | 1:20000 |
Mitchell fine sandy loam, 0 to 3 percent slopes | 5831 | 2619 | 1653770 | 1shwf | ne157 | 1965 | 1:20000 |
Mitchell silt loam, thin, 1 to 6 percent slopes | 5840 | 2243 | 1653701 | 1sht6 | ne157 | 1965 | 1:20000 |
Mitchell silt loam, wet variant, 0 to 1 percent slopes | 5852 | 1786 | 1653707 | 1shtd | ne157 | 1965 | 1:20000 |
Mitchell fine sandy loam, 3 to 6 percent slopes | 5832 | 1213 | 1653771 | 1shwg | ne157 | 1965 | 1:20000 |
Mitchell-Epping complex, 9 to 30 percent slopes | 5849 | 664 | 2227654 | 2ds1t | ne157 | 1965 | 1:20000 |
Mitchell fine sandy loam, 6 to 9 percent slopes | 5833 | 642 | 1653772 | 1shwh | ne157 | 1965 | 1:20000 |
Mitchell very fine sandy loam, 0 to 1 percent slopes | 5843 | 393 | 2227649 | 2ds1n | ne157 | 1965 | 1:20000 |
Mitchell very fine sandy loam, 1 to 3 percent slopes | 5844 | 331 | 2227650 | 2ds1p | ne157 | 1965 | 1:20000 |
Mitchell very fine sandy loam, 6 to 9 percent slopes | 5846 | 320 | 2227652 | 2ds1r | ne157 | 1965 | 1:20000 |
Mitchell-Epping complex, 3 to 9 percent slopes | 5848 | 30 | 2227653 | 2ds1s | ne157 | 1965 | 1:20000 |
Mitchell very fine sandy loam, 3 to 6 percent slopes | 5845 | 27 | 2227651 | 2ds1q | ne157 | 1965 | 1:20000 |
Mitchell silt loam, 9 to 20 percent slopes | 5839 | 3 | 2227665 | 2tvtt | ne157 | 1965 | 1:20000 |
Mitchell-Epping complex, 9 to 30 percent slopes | 5849 | 5375 | 100617 | 3cpq | ne161 | 1992 | 1:20000 |
Mitchell very fine sandy loam, 1 to 3 percent slopes | 5844 | 5388 | 357951 | d0gt | ne165 | 1993 | 1:20000 |
Mitchell-Epping complex, 9 to 30 percent slopes | 5849 | 4301 | 357963 | d0h6 | ne165 | 1993 | 1:20000 |
Mitchell silt loam, 9 to 20 percent slopes | 5839 | 3584 | 357959 | 2tvtt | ne165 | 1993 | 1:20000 |
Mitchell silt loam, 3 to 6 percent slopes | 5837 | 3265 | 357957 | d0h0 | ne165 | 1993 | 1:20000 |
Mitchell very fine sandy loam, 3 to 6 percent slopes | 5845 | 2921 | 357952 | d0gv | ne165 | 1993 | 1:20000 |
Mitchell-Epping complex, 3 to 9 percent slopes | 5848 | 2644 | 357962 | d0h5 | ne165 | 1993 | 1:20000 |
Mitchell silt loam, 1 to 3 percent slopes | 5835 | 2153 | 357956 | d0gz | ne165 | 1993 | 1:20000 |
Mitchell silt loam, 0 to 1 percent slopes | 5834 | 1446 | 357955 | d0gy | ne165 | 1993 | 1:20000 |
Mitchell very fine sandy loam, 0 to 1 percent slopes | 5843 | 1174 | 357950 | d0gs | ne165 | 1993 | 1:20000 |
Mitchell silt loam, 6 to 9 percent slopes | 5838 | 891 | 357958 | d0h1 | ne165 | 1993 | 1:20000 |
Mitchell very fine sandy loam, 2 to 6 percent slopes | MtB | 439 | 355126 | cxjp | sd047 | 1980 | 1:24000 |
Mitchell very fine sandy loam, 0 to 2 percent slopes | MtA | 249 | 355125 | cxjn | sd047 | 1980 | 1:24000 |
Epping-Mitchell silt loams, 9 to 30 percent slopes | Te | 3753 | 2925483 | 2tvtj | sd610 | 1965 | 1:20000 |
Mitchell-Epping silt loams, moist, 9 to 30 percent slopes | U195E | 277 | 2485207 | 2pf1z | sd612 | 2011 | 1:20000 |
Epping-Mitchell silt loams, 9 to 30 percent slopes | Te | 10518 | 2582737 | 2tvtj | sd613 | 2011 | 1:24000 |
Mitchell-Epping silt loams, moist, 9 to 30 percent slopes | U195E | 75 | 2582815 | 2pf1z | sd613 | 2011 | 1:24000 |
Mitchell very fine sandy loam, 6 to 10 percent slopes | 191 | 16986 | 104547 | 3hsh | wy031 | 1998 | 1:24000 |
Mitchell very fine sandy loam, 0 to 6 percent slopes | 190 | 5246 | 104546 | 3hsg | wy031 | 1998 | 1:24000 |
Mitchell silt loam, 0 to 3 percent slopes | MtA | 48692 | 104719 | 3hz1 | wy615 | 1965 | 1:20000 |
Mitchell silt loam, 3 to 6 percent slopes | MtB | 42235 | 104720 | 3hz2 | wy615 | 1965 | 1:20000 |
Mitchell silt loam, 6 to 10 percent slopes | MtC | 12755 | 104721 | 3hz3 | wy615 | 1965 | 1:20000 |
Mitchell-Shingle loams, 3 to 10 percent slopes | MsC | 8343 | 104718 | 3hz0 | wy615 | 1965 | 1:20000 |
Mitchell silt loam, 10 to 15 percent slopes | MtD | 2236 | 104722 | 3hz4 | wy615 | 1965 | 1:20000 |
Mitchell-Shingle loams, 0 to 3 percent slopes | MsA | 1250 | 104717 | 3hyz | wy615 | 1965 | 1:20000 |
Dwyer and Mitchell soils, 10 to 15 percent slopes | DyD | 1112 | 104694 | 3hy7 | wy615 | 1965 | 1:20000 |
Nucla-Mitchell fine sandy loams, 0 to 3 percent slopes | 31 | 6006 | 104821 | 3j2b | wy621 | 1980 | 1:24000 |
Mitchell very fine sandy loam, 0 to 3 percent slopes | 25 | 3532 | 104814 | 3j23 | wy621 | 1980 | 1:24000 |
Mitchell very fine sandy loam, 3 to 6 percent slopes | 26 | 3166 | 104815 | 3j24 | wy621 | 1980 | 1:24000 |
Nucla-Mitchell fine sandy loams, 3 to 6 percent slopes | 32 | 2599 | 104822 | 3j2c | wy621 | 1980 | 1:24000 |
Mitchell very fine sandy loam, 6 to 10 percent slopes | 27 | 1106 | 104816 | 3j25 | wy621 | 1980 | 1:24000 |
Kim-Mitchell complex, 0 to 6 percent slopes | 78 | 818 | 104794 | 3j1g | wy621 | 1980 | 1:24000 |
Mitchell variant-Tassel variant fine sandy loams, 0 to 3 percent slopes | 28 | 422 | 104817 | 3j26 | wy621 | 1980 | 1:24000 |
Kim-Mitchell complex, 6 to 9 percent slopes | 73 | 35 | 104791 | 3j1c | wy621 | 1980 | 1:24000 |
Mitchell loam, 0 to 6 percent slopes | 19B | 8616 | 104860 | 3j3l | wy715 | 1974 | 1:20000 |
Mitchell loam, 6 to 10 percent slopes | 19C | 4949 | 104861 | 3j3m | wy715 | 1974 | 1:20000 |
Mitchell loam, 10 to 20 percent slopes | 19D | 2093 | 104862 | 3j3n | wy715 | 1974 | 1:20000 |
Mitchell very fine sandy loam, 6 to 10 percent slopes | 38 | 110 | 1414808 | 1jh6z | wy715 | 1974 | 1:20000 |
Mitchell very fine sandy loam, 1 to 3 percent slopes | 89 | 38 | 1415375 | 1jht8 | wy715 | 1974 | 1:20000 |
Mitchell silt loam, 0 to 1 percent slopes | 91 | 17 | 1415377 | 1jhtb | wy715 | 1974 | 1:20000 |
Mitchell-Epping complex, 3 to 9 percent slopes | 90 | 16 | 1415376 | 1jht9 | wy715 | 1974 | 1:20000 |
Mitchell silt loam, 0 to 6 percent slopes | 147 | 5949 | 104948 | 3j6f | wy721 | 1994 | 1:24000 |


