Click the map at the location you wish to open the SoilWeb GMap application...
Share this map view by pasting the link below:
×
What does this application do?
The Soil Taxonomy Explorer is a convenient interface to thematic maps representing order, suborder, great group, and subgroup taxonomic extents for the Continental United States. Great group and subgroup formative element extent grids are also included, simplifying searches for e.g. "fragi-" at the great group level or "fragic-" at the subgroup level. Taxonomic extent maps are displayed via 800m grids, where cell values represent the percentage of cell area occupied by any given taxon or formative element. Only major components from the detailed soil survey of the United States (SSURGO) are used in the estimation of cell area percentages.
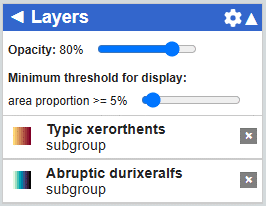
How do I select a minimum threshold for display?
For most taxa, cell area percentage values are within the range of 1-50%; values of 0 are encoded as NODATA and not displayed in this application. The "minimum threshold for display" setting can be used to display only those grid cells where the cell area fraction is >= some value. We suggest setting the threshold to 5% as a reasonable compromise between too little or too much detail. Clicking on the color bar will bring up a menu for selecting from a collection of color ramps and solid colors.
How were the taxonomic grids created?
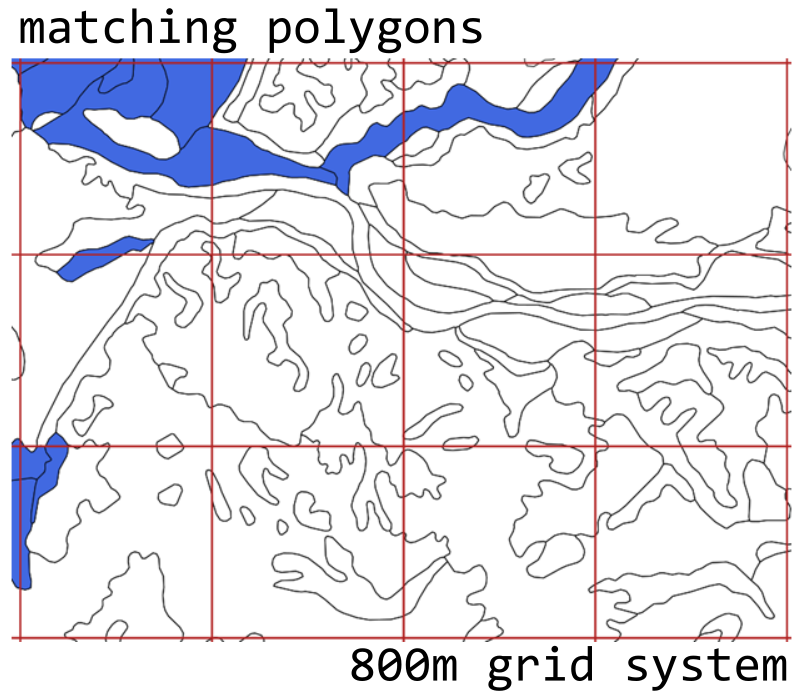
The 800m grid cells used in this application represent an area percentage of the detailed soil survey (SSURGO) map unit and component data that match some criteria, such as a specific soil order from Soil Taxonomy. Cell values are stored as integers between 0 and 100. Area percentage values are calculated from the product of SSURGO map unit polygon area and component percentage contained within each grid cell, just for major components. Consider the following figure, where SSURGO polygons are represented with black outlines, the 800m grid with red lines, and those map units / components matching some criteria highlighted in blue. Cell values in the 800m grid are proportional to the area of "blue" contained within each cell.
Family Mineralogy Class Queries
The family mineralogy class grids hosted by SoilWeb represent a simplification; major components with highly contrasting particle size classes (and thus multiple mineralogy classes) will match each class present in the family classification. For example, major components with 'glassy over mixed' and 'glassy' family mineralogy classes are included in the same extent grid. The 'mixed' mineralogy class is not currently included.