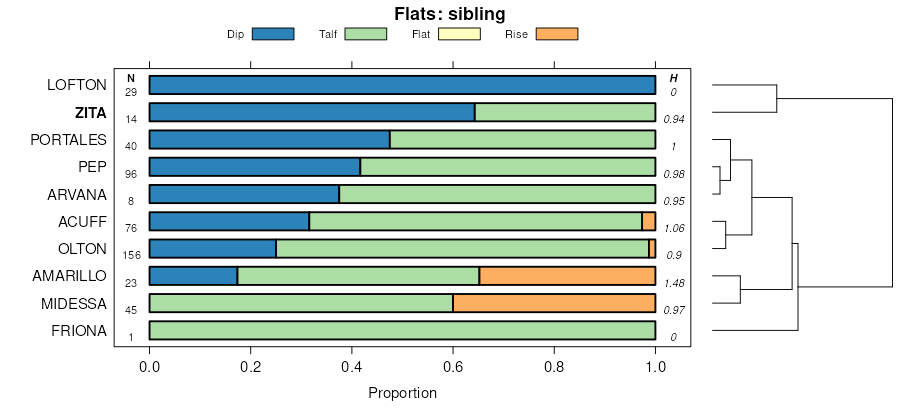
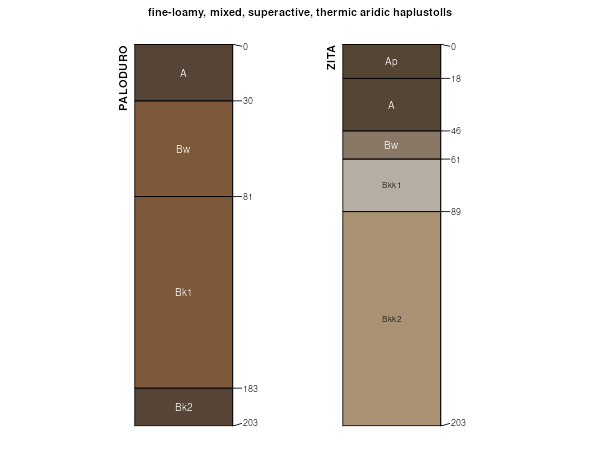
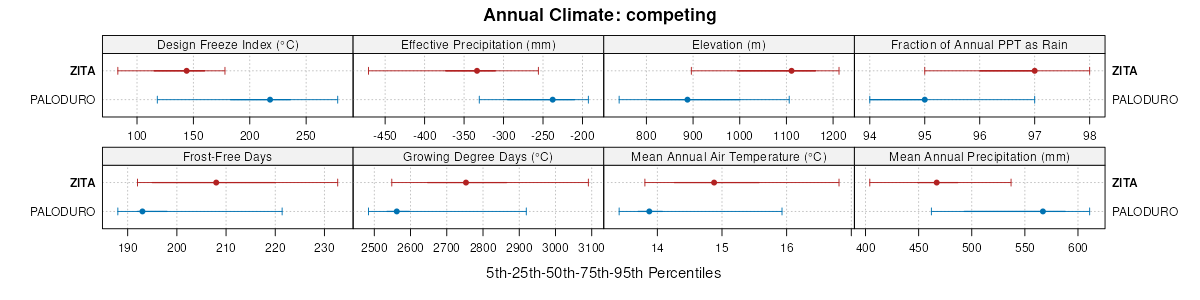
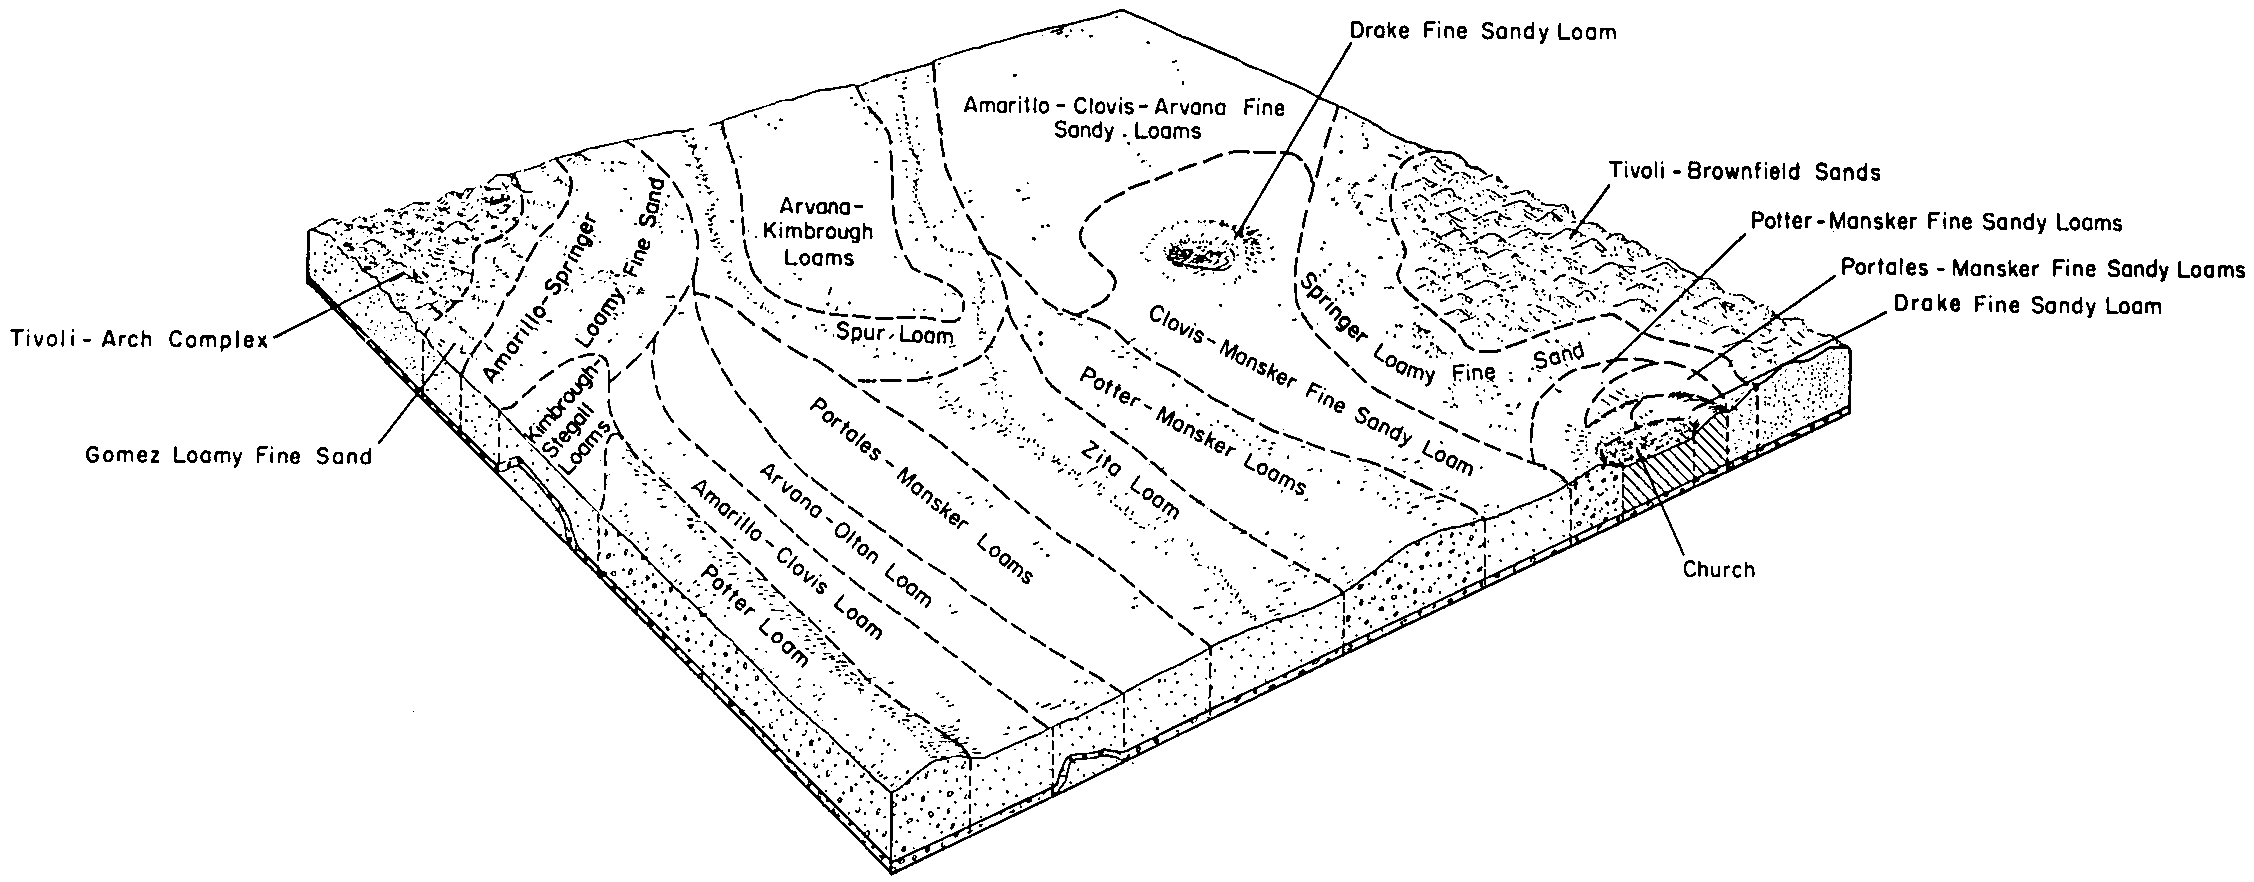
Official Series Description


Lab Data Summary

Aggregate lab data for the ZITA soil series. This aggregation is based on all pedons with a current taxon name of ZITA, and applied along 1-cm thick depth slices. Solid lines are the slice-wise median, bounded on either side by the interval defined by the slice-wise 5th and 95th percentiles. The median is the value that splits the data in half. Five percent of the data are less than the 5th percentile, and five percent of the data are greater than the 95th percentile. Values along the right hand side y-axis describe the proportion of pedon data that contribute to aggregate values at this depth. For example, a value of "90%" at 25cm means that 90% of the pedons correlated to ZITA were used in the calculation. Source: KSSL snapshot . Methods used to assemble the KSSL snapshot used by SoilWeb / SDE

Click the image to view it full size.

Pedons used in the lab summary:

MLRALab IDPedon IDTaxonnameCINSSL / NASIS ReportsLink To SoilWeb GMap
77C12N7775S2012TX079004Zita7Primary | Supplementary | Taxonomy | Pedon | Water Retention | Correlation | Andic Soil Properties33.7799568,-102.6580963

Water Balance

Monthly water balance estimated using a leaky-bucket style model for the ZITA soil series. Monthly precipitation (PPT) and potential evapotranspiration (PET) have been estimated from the 50th percentile of gridded values (PRISM 1981-2010) overlapping with the extent of SSURGO map units containing each series as a major component. Monthly PET values were estimated using the method of Thornthwaite (1948). These (and other) climatic parameters are calculated with each SSURGO refresh and provided by the fetchOSD function of the soilDB package. Representative water storage values (“AWC” in the figures) were derived from SSURGO by taking the 50th percentile of profile-total water storage (sum[awc_r * horizon thickness]) for each soil series. Note that this representation of “water storage” is based on the average ability of most plants to extract soil water between 15 bar (“permanent wilting point”) and 1/3 bar (“field capacity”) matric potential. Soil moisture state can be roughly interpreted as “dry” when storage is depleted, “moist” when storage is between 0mm and AWC, and “wet” when there is a surplus. Clearly there are a lot of assumptions baked into this kind of monthly water balance. This is still a work in progress.

Click the image to view it full size.


Click the image to view it full size.

Sibling Summary

Siblings are those soil series that occur together in map units, in this case with the ZITA series. Sketches are arranged according to their subgroup-level taxonomic structure. Source: SSURGO snapshot , parsed OSD records and snapshot of SC database .

Click the image to view it full size.

Select annual climate data summaries for the ZITA series and siblings. Series are sorted according to hierarchical clustering of median values. Source: SSURGO map unit geometry and 1981-2010, 800m PRISM data .

Click the image to view it full size.

Geomorphic description summaries for the ZITA series and siblings. Series are sorted according to hierarchical clustering of proportions and relative hydrologic position within an idealized landform (e.g. top to bottom). Most soil series (SSURGO components) are associated with a hillslope position and one or more landform-specific positions: hills, mountain slopes, terraces, and/or flats. Proportions can be interpreted as an aggregate representation of geomorphic membership. The values printed to the left (number of component records) and right (Shannon entropy) of stacked bars can be used to judge the reliability of trends. Small Shannon entropy values suggest relatively consistent geomorphic association, while larger values suggest lack thereof. Source: SSURGO component records .

Click the image to view it full size.

Click the image to view it full size.

There are insufficient data to create the 3D mountains figure.

Click the image to view it full size.

Click the image to view it full size.

Competing Series

Soil series competing with ZITA share the same family level classification in Soil Taxonomy. Source: parsed OSD records and snapshot of the SC database .

Click the image to view it full size.

Select annual climate data summaries for the ZITA series and competing. Series are sorted according to hierarchical clustering of median values. Source: SSURGO map unit geometry and 1981-2010, 800m PRISM data .

Click the image to view it full size.

Geomorphic description summaries for the ZITA series and competing. Series are sorted according to hierarchical clustering of proportions and relative hydrologic position within an idealized landform (e.g. top to bottom). Proportions can be interpreted as an aggregate representation of geomorphic membership. Most soil series (SSURGO components) are associated with a hillslope position and one or more landform-specific positions: hills, mountain slopes, terraces, and/or flats. The values printed to the left (number of component records) and right (Shannon entropy) of stacked bars can be used to judge the reliability of trends. Shannon entropy values close to 0 represent soil series with relatively consistent geomorphic association, while values close to 1 suggest lack thereof. Source: SSURGO component records .

There are insufficient data to create the 2D hillslope position figure.

There are insufficient data to create the 3D hills figure.

There are insufficient data to create the 3D mountains figure.

There are insufficient data to create the 3D terrace figure.

There are insufficient data to create the 3D flats position figure.

Soil series sharing subgroup-level classification with ZITA, arranged according to family differentiae. Hovering over a series name will print full classification and a small sketch from the OSD. Source: snapshot of SC database .

Block Diagrams

Click a link below to display the diagram. Note that these diagrams may be from multiple survey areas.

  1. NM-2012-02-15-01 | Roosevelt County - March 1967

    Generalized diagram of soil patterns that extend southwest to northeast through Roosevelt County (Soil Survey of Roosevelt County, New Mexico; March 1967).

  2. TX-2010-11-03-65 | Lynn County - 2008

    Pattern of soils and underlying materials in the Acuff-Amarillo general soil map unit (Soil Survey of Lynn County, Texas; 2008).

  3. TX-2010-11-03-68 | Lynn County - 2008

    Pattern of soils and underlying materials in the Estacado-Pep general soil map unit (Soil Survey of Lynn County, Texas; 2008).

  4. TX-2012-03-20-01 | Bailey County - April 1963

    Amarillo fine sandy loam association (Soil Survey of Bailey County, TX; 1963).

  5. TX-2012-03-20-14 | Carson County - July 1962

    Soil toposequence of playas (Soil Survey of Carson County, TX; 1962).

  6. TX-2012-03-20-36 | Dawson County - August 1960

    Soils in a playa on high plains and associated soils (Soil Survey of Dawson County, TX; 1960).

  7. TX-2012-03-21-04 | Hansford County - June 1960

    Diagram showing typical locations of soil series and the underlying parent material (Soil Survey of Hansford County, TX; 1960).

  8. TX-2012-03-21-19 | Lamb County - March 1962

    Some soils of general soil area 1 (Soil Survey of Lamb County, TX; 1962).

  9. TX-2012-03-21-90 | Terry County - February 1962

    Soils in a playa (Soil Survey of Terry County, TX; 1962).

Map Units

Map units containing ZITA as a major component. Limited to 250 records.

Map Unit Name Symbol Map Unit Area (ac) Map Unit Key National Map Unit Symbol Soil Survey Area Publication Date Map Scale
Zita loam, 0 to 1 percent slopesZt8628376485f5tknm02519671:20000
Zita fine sandy loamZf11843764842tw2hnm02519671:20000
Zita fine sandy loam, 0 to 1 percent slopesZfA33341607342f5thnm04120141:24000
Zita very fine sandy loam, 0 to 1 percent slopesZtA318525201151idxwnm04120141:24000
Zita very fine sandy loam, 1 to 3 percent slopesZtB99825201161idxxnm04120141:24000
Zita fine sandy loam, 1 to 3 percent slopesZfB2232109239f5tjnm04120141:24000
Zita clay loam, 0 to 1 percent slopesZcA565362510f5sftx01119631:20000
Zita clay loam, 1 to 3 percent slopesZcB202362511f5vctx01119631:20000
Zita fine sandy loam, 0 to 1 percent slopesZfA9477362613f5thtx01719601:20000
Zita loam, 0 to 1 percent slopesZmA8452362615f5tktx01719601:20000
Zita fine sandy loam, 1 to 3 percent slopesZfB1739362614f5tjtx01719601:20000
Zita fine sandy loamLu12923625912tw2htx01719601:20000
Zita clay loam, 0 to 1 percent slopesZcA834377973f5sftx06520001:24000
Zita clay loam, 0 to 1 percent slopesZcA67942428291f5sftx06919691:20000
Zita fine sandy loam, 0 to 1 percent slopesZfA6237363958f5thtx07919621:20000
Zita fine sandy loam, 1 to 3 percent slopesZfB706363959f5tjtx07919621:20000
Zita loam, 0 to 1 percent slopesZmA5507364752f5tktx10719641:20000
Zita fine sandy loam, 0 to 1 percent slopesZfA2862364751f5thtx10719641:20000
Zita loam, 1 to 3 percent slopesZmB24553647532tw2jtx10719641:20000
Zita loam, 0 to 1 percent slopesZmA27393649f5tktx11520041:24000
Zita fine sandy loam, 0 to 1 percent slopesZfA4724366055f5thtx16519641:20000
Zita loam, 0 to 1 percent slopesZtA372378366f5tktx16919651:24000
Olton and Zita clay loams, 0 to 1 percent slopesOzA5824391941f4v8tx17919651:20000
Olton and Zita clay loams, 1 to 3 percent slopesOzB4180391942f4v9tx17919651:20000
Zita loam, 0 to 1 percent slopesZmA2468366920f5tktx18919691:20000
Zita loam, 1 to 3 percent slopesZmB13033669212tw2jtx18919691:20000
Zita loam, 0 to 1 percent slopesZmA2547379001f5tktx21919991:24000
Zita fine sandy loam, 0 to 1 percent slopesZfA2032391864f5thtx22719651:24000
Zita fine sandy loam, 0 to 1 percent slopesZfA9699394308f5thtx27919601:20000
Zita loam, 0 to 1 percent slopesZmA6910394310f5tktx27919601:20000
Zita fine sandy loamLu43743942752tw2htx27919601:20000
Zita fine sandy loam, 1 to 3 percent slopesZfB4323394309f5tjtx27919601:20000
Zita loam, 1 to 3 percent slopesZmB11433943112tw2jtx27919601:20000
Zita loamy fine sand, overblownZo992394312f79rtx27919601:20000
Zita loam, 0 to 1 percent slopesZmA3964369868f5tktx30319751:20000
Zita fine sandy loam, 0 to 1 percent slopesZfA676369867f5thtx30319751:20000
Zita fine sandy loam, 0 to 1 percent slopesZfA6254379069f5thtx30519991:24000
Zita loam, 0 to 1 percent slopesZmA5045379071f5tktx30519991:24000
Zita fine sandy loam, 1 to 3 percent slopesZfB849379070f5tjtx30519991:24000
Zita loam, 0 to 1 percent slopesZtA5098370365f5tktx31719681:24000
Zita loam, 0 to 1 percent slopesZmA11062599142f5tktx36919731:24000
Zita fine sandy loam, 1 to 3 percent slopesZfB302599141f5tjtx36919731:24000
Zita fine sandy loam, 0 to 1 percent slopesZfA282599140f5thtx36919731:24000
Zita clay loam, 0 to 1 percent slopesZcA1717371414f5sftx38119991:24000
Zita clay loam, 1 to 3 percent slopesZcB271371415f5vctx38119991:24000
Zita clay loam, 0 to 1 percent slopesZcA7562428341f5sftx43719701:20000
Zita fine sandy loam, 0 to 1 percent slopesZfA1351372573f5thtx44519991:24000
Zita loam, 0 to 1 percent slopesZmA787372574f5tktx44519991:24000
Zita fine sandy loam, 0 to 1 percent slopesZfA2287373741f5thtx50119621:31680
Zita loam, 0 to 1 percent slopesZmA1404373742f5tktx50119621:31680

Map of Series Extent

Approximate geographic distribution of the ZITA soil series. To learn more about how this distribution was mapped, or to compare this soil series extent to others, use the Series Extent Explorer (SEE) application. Source: generalization of SSURGO geometry .