| Carmi-Westland complex, 0 to 2 percent slopes, rarely flooded | 7841A | 3875 | 200145 | 6q89 | il033 | 2004 | 1:12000 |
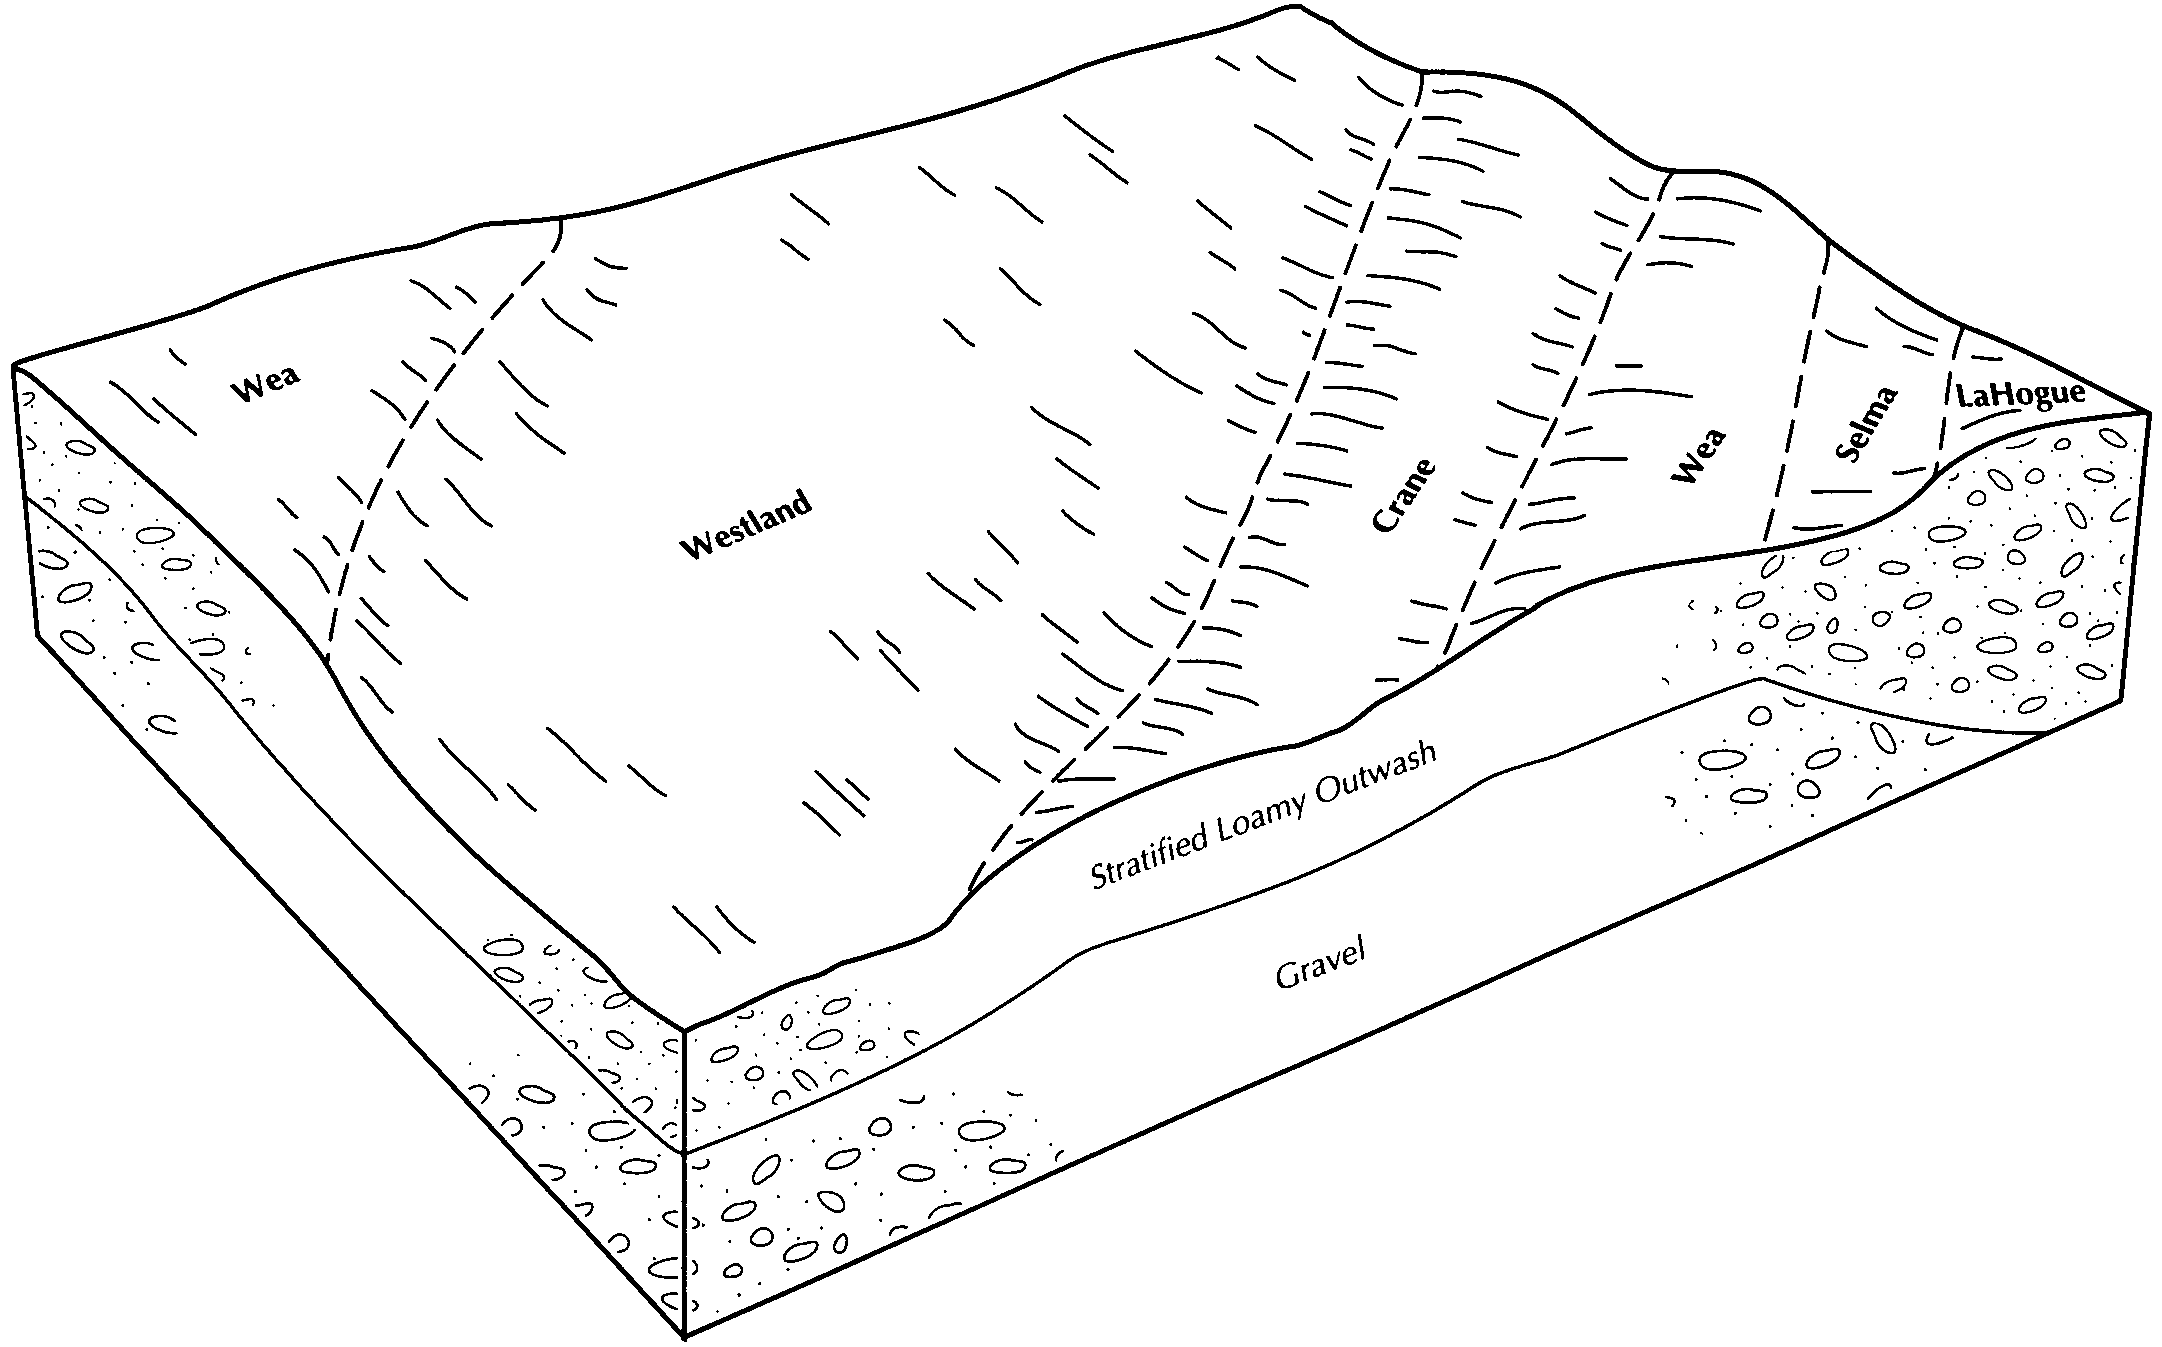
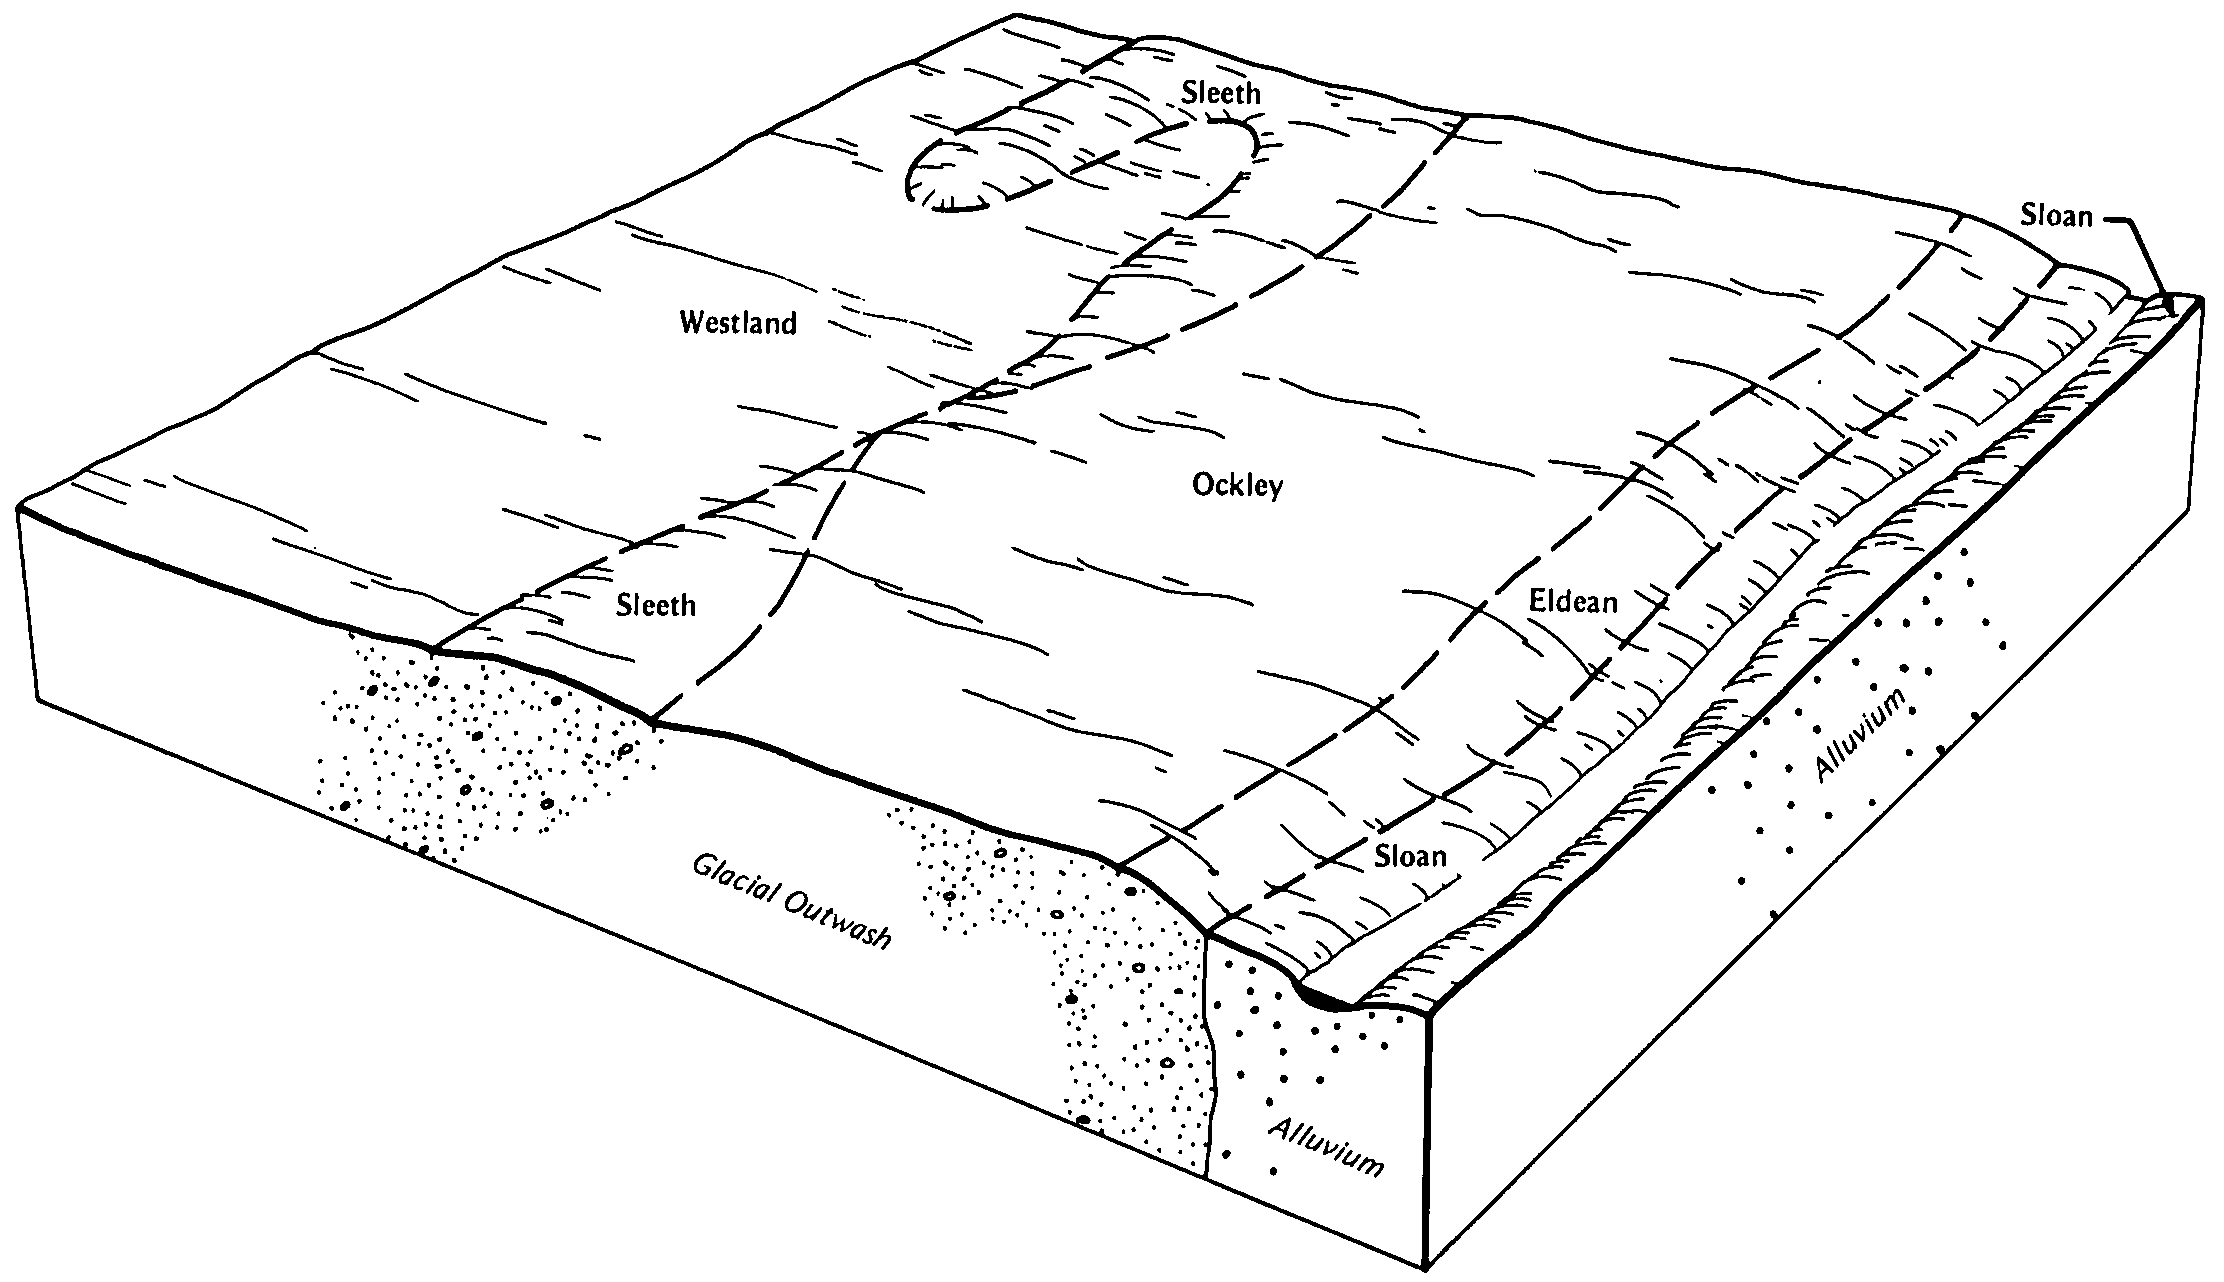
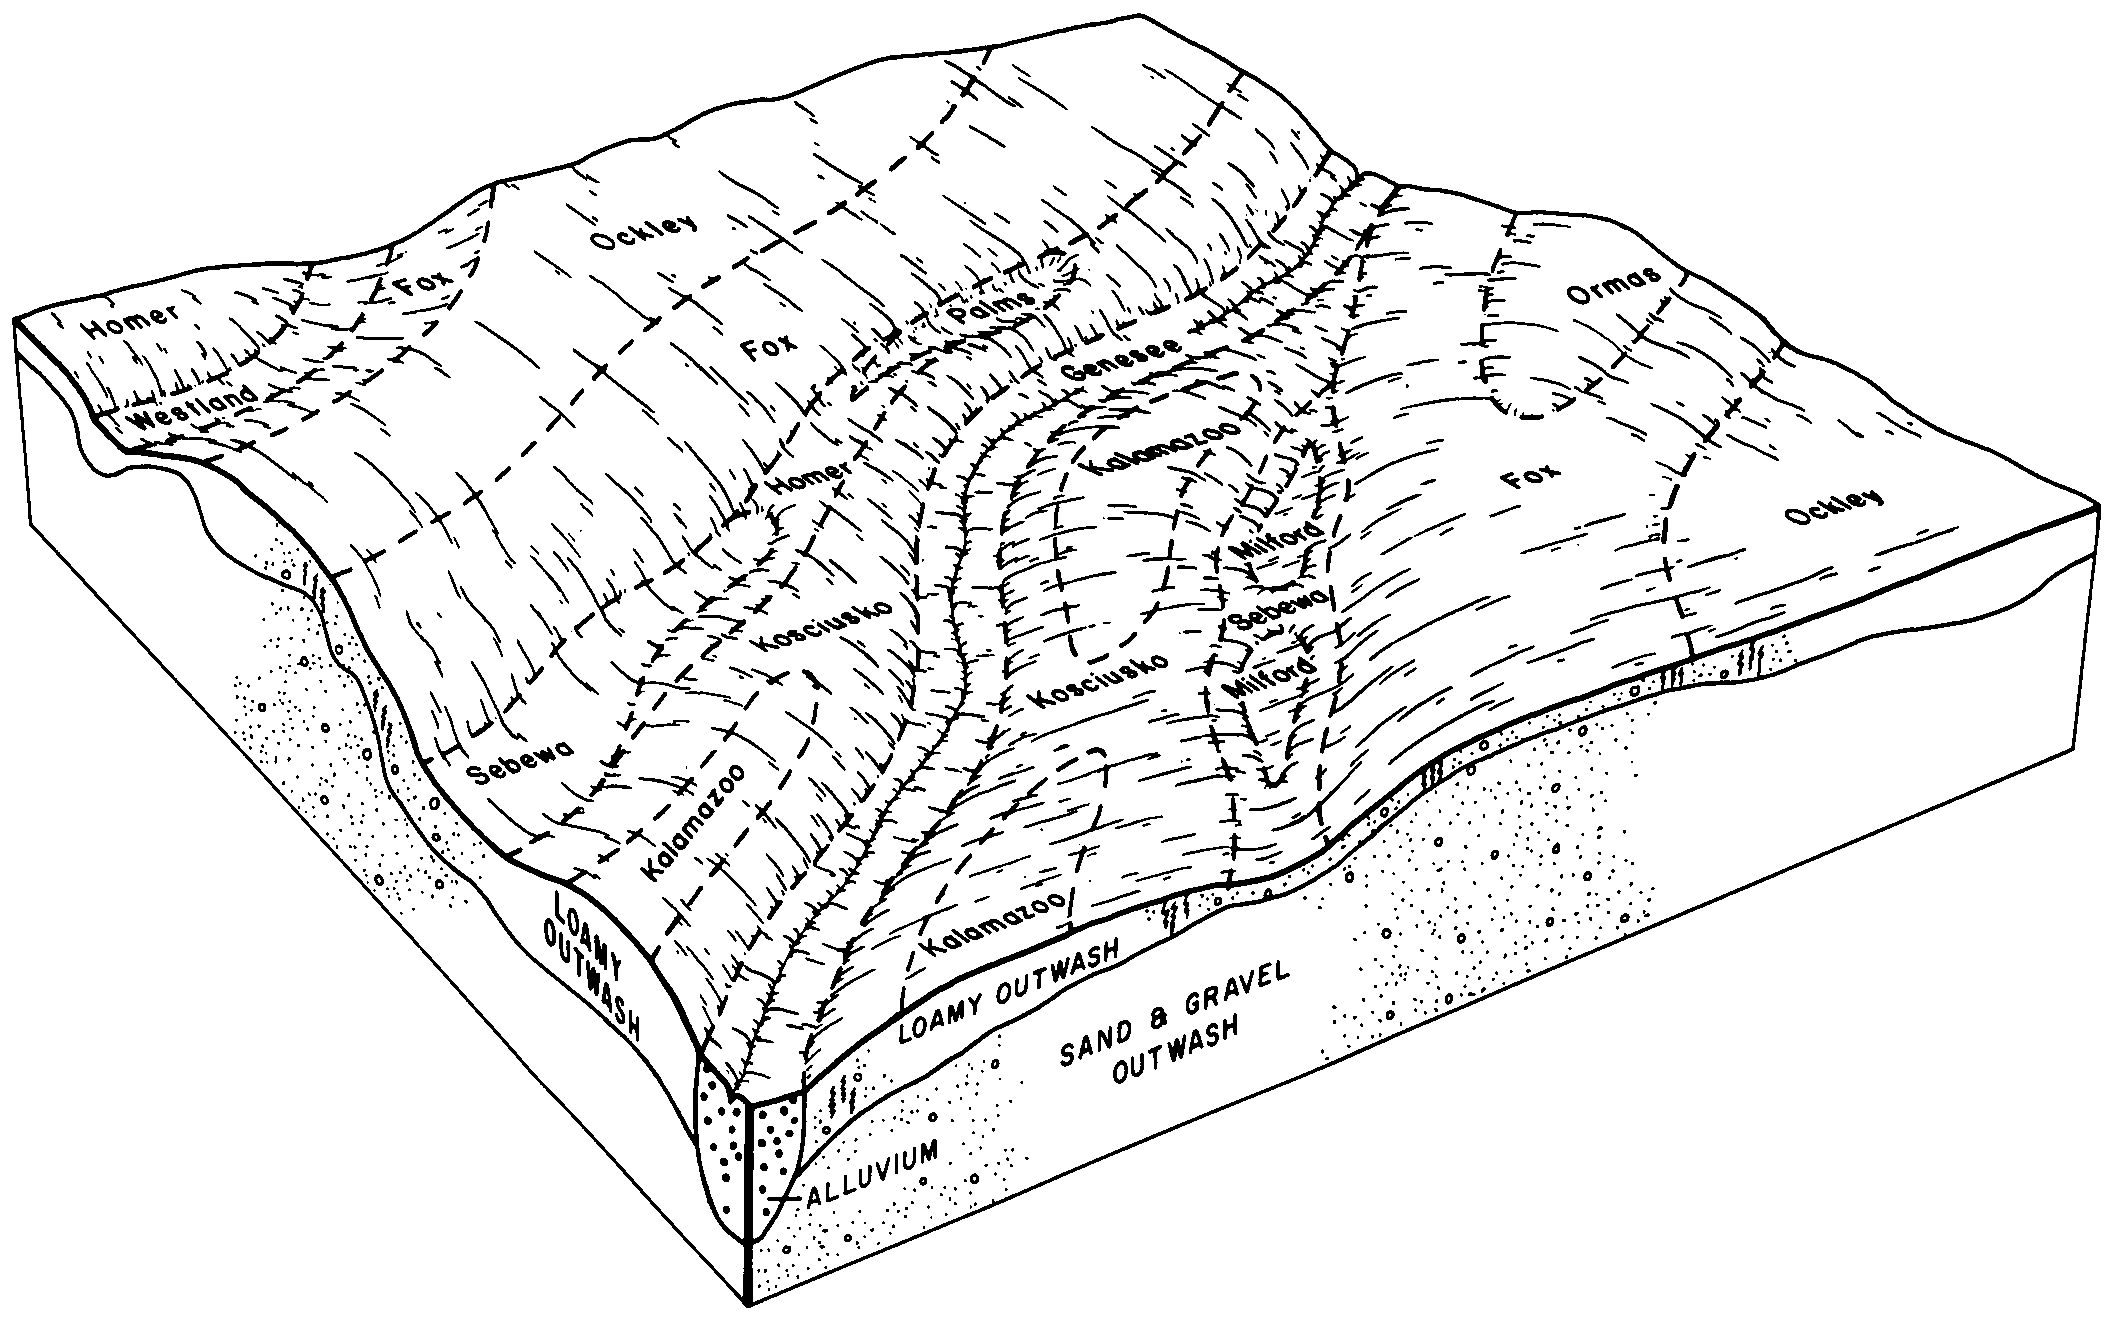
Westland clay loam | 300 | 1621 | 176707 | 5xw7 | il101 | 1952 | 1:42240 |
Westland clay loam, 0 to 2 percent slopes | 300A | 8045 | 176960 | 5y4d | il105 | 1991 | 1:15840 |
Westland loam | Ws | 235 | 164758 | 5jfs | in003 | 1965 | 1:15840 |
Westland silty clay loam | Wt | 141 | 164759 | 5jft | in003 | 1965 | 1:15840 |
Westland-Urban land complex | YweA | 37 | 3404545 | 2zy5h | in003 | 1965 | 1:15840 |
Urban land-Westland complex | UweA | 10 | 3404569 | 2zy5g | in003 | 1965 | 1:15840 |
Westland clay loam, 0 to 1 percent slopes | WqlA | 1330 | 200926 | 2w578 | in005 | 2002 | 1:12000 |
Westland clay loam, 0 to 1 percent slopes, rarely flooded | WqlAQ | 704 | 207333 | 2w577 | in005 | 2002 | 1:12000 |
Urban land-Westland complex, 0 to 1 percent slopes | UnnA | 185 | 207331 | 6yr3 | in005 | 2002 | 1:12000 |
Westland silty clay loam, 0 to 2 percent slopes | WqvA | 1331 | 679074 | 2t4m1 | in011 | 2003 | 1:12000 |
Westland loam | Wr | 1254 | 165249 | 5jym | in015 | 1987 | 1:15840 |
Westland loam, shale substratum | Ws | 287 | 165250 | 5jyn | in015 | 1987 | 1:15840 |
Westland silty clay loam, 0 to 2 percent slopes | We | 1151 | 162365 | 2t4m1 | in023 | 1978 | 1:20000 |
Westland silt loam | We | 610 | 1612937 | 1r4d7 | in041 | 1958 | 1:15840 |
Westland silty clay loam, 0 to 2 percent slopes | WqvA | 2878 | 242528 | 2t4m1 | in045 | 1999 | 1:12000 |
Westland silty clay loam, 0 to 2 percent slopes | We | 2711 | 3186662 | 2t4m1 | in057 | 1976 | 1:15840 |
Westland silty clay loam-Urban land complex, 0 to 2 percent slopes | YwqA | 1465 | 3105123 | 2y47r | in057 | 1976 | 1:15840 |
Urban land-Westland silty clay loam complex, 0 to 2 percent slopes | UwtA | 82 | 3105122 | 2y48p | in057 | 1976 | 1:15840 |
Westland clay loam | We | 1339 | 160844 | 5dcj | in059 | 1974 | 1:15840 |
Westland silt loam | We | 9734 | 165293 | 5k01 | in065 | 1984 | 1:15840 |
Westland clay loam, 0 to 1 percent slopes | We | 2544 | 161692 | 2w578 | in081 | 1975 | 1:15840 |
Westland clay loam-Urban land complex, 0 to 1 percent slopes | YwcA | 3 | 3189055 | 2y46w | in081 | 1975 | 1:15840 |
Westland silty clay loam, 0 to 2 percent slopes | Wd | 5535 | 162130 | 2t4m1 | in095 | 1965 | 1:15840 |
Westland silty clay loam, moderately deep | Ws | 1317 | 162131 | 5fq1 | in095 | 1965 | 1:15840 |
Westland clay loam-Urban land complex, 0 to 1 percent slopes | YwcA | 1234 | 3104724 | 2y46w | in097 | 1975 | 1:15840 |
Westland-Urban land complex, 0 to 2 percent slopes | YweA | 1066 | 3104723 | 2y8l6 | in097 | 1975 | 1:15840 |
Urban land-Westland complex, 0 to 2 percent slopes | UweA | 794 | 3104722 | 2y471 | in097 | 1975 | 1:15840 |
Westland clay loam | We | 127 | 164454 | 5j3z | in097 | 1975 | 1:15840 |
Westland silt loam | Wo | 633 | 159809 | 5c94 | in121 | 1965 | 1:20000 |
Westland loam, loamy substratum | Wd | 459 | 159808 | 5c93 | in121 | 1965 | 1:20000 |
Westland silty clay loam, loamy substratum | Wr | 349 | 159811 | 5c96 | in121 | 1965 | 1:20000 |
Westland silty clay loam | Wp | 95 | 159810 | 5c95 | in121 | 1965 | 1:20000 |
Westland clay loam, limestone | Wo | 455 | 161321 | 5dvx | in135 | 1984 | 1:15840 |
Westland clay loam, 0 to 1 percent slopes | Ws | 9745 | 161007 | 2w578 | in139 | 1983 | 1:15840 |
Westland clay loam, 0 to 1 percent slopes | Wc | 16788 | 160759 | 2w578 | in145 | 1968 | 1:15840 |
Westland and Brookston loams, overwash | We | 789 | 160760 | 5d8t | in145 | 1968 | 1:15840 |
Westland silty clay loam | Wt | 1247 | 162725 | 5gb6 | in153 | 1966 | 1:15840 |
Westland silty clay loam, shallow variant | Wv | 211 | 162726 | 5gb7 | in153 | 1966 | 1:15840 |
Westland silt loam | We | 65 | 1613086 | 1r4k1 | in161 | 1958 | 1:15840 |
Westland silty clay loam | Wt | 393 | 160478 | 5czq | in165 | 1977 | 1:20000 |
Westland clay loam, 0 to 1 percent slopes | Wt | 749 | 159711 | 2w578 | in167 | 1971 | 1:20000 |
Westland loam | Ws | 815 | 161240 | 5ds9 | in169 | 1980 | 1:15840 |
Westland silty clay loam, 0 to 2 percent slopes | We | 5447 | 249157 | 2t4m1 | in177 | 1984 | 1:15840 |
Westland clay loam, 0 to 1 percent slopes | WdA | 1384 | 171868 | 5rv4 | oh003 | 1998 | 1:12000 |
Westland-Rensselaer complex, 0 to 1 percent slopes | WeA | 583 | 171869 | 5rv5 | oh003 | 1998 | 1:12000 |
Westland silty clay loam, clay substratum | Wu | 22 | 1146254 | 17gry | oh011 | 1979 | 1:15840 |
Westland clay loam, 0 to 1 percent slopes | Wd | 21 | 817837 | wg0v | oh011 | 1979 | 1:15840 |
Westland silt loam, 0 to 2 percent slopes | WnA | 493 | 1589980 | 1qchp | oh017 | 1977 | 1:15840 |
Westland silty clay loam, Southern Ohio Till Plain, 0 to 2 percent slopes | Wt | 7186 | 171791 | 2t4m2 | oh023 | 1997 | 1:15840 |
Westland clay loam | We | 14 | 709035 | rst3 | oh033 | 1975 | 1:15840 |
Westland silty clay loam, Southern Ohio Till Plain, 0 to 2 percent slopes | Ws | 3487 | 168534 | 2t4m2 | oh037 | 1984 | 1:15840 |
Westland silt loam, 0 to 2 percent slopes | WnA | 7 | 1392139 | 1hqmq | oh037 | 1984 | 1:15840 |
Westland silty clay loam, Southern Ohio Till Plain, 0 to 2 percent slopes | Wk | 3903 | 172329 | 2t4m2 | oh045 | 1998 | 1:12000 |
Westland silt loam, overwash | Wg | 355 | 172328 | 5s9z | oh045 | 1998 | 1:12000 |
Westland silty clay loam, overwash | Wv | 10578 | 169278 | 5p4l | oh047 | 1968 | 1:15840 |
Westland silty clay loam, Southern Ohio Till Plain, 0 to 2 percent slopes | Wu | 833 | 169277 | 2t4m2 | oh047 | 1968 | 1:15840 |
Westland clay loam, SOTP, 0 to 2 percent slopes | Wt | 1 | 1907594 | 2w57l | oh047 | 1968 | 1:15840 |
Westland silty clay loam, Southern Ohio Till Plain, 0 to 2 percent slopes | Wt | 3114 | 167953 | 2t4m2 | oh049 | 1977 | 1:15840 |
Westland silty clay loam, Southern Ohio Till Plain, 0 to 2 percent slopes | Ws | 6063 | 169361 | 2t4m2 | oh057 | 1974 | 1:15840 |
Westland-Urban land complex | Wt | 720 | 169362 | 5p79 | oh057 | 1974 | 1:15840 |
Westland-Rensselaer complex, 0 to 1 percent slopes | WeA | 1927 | 644471 | pmmd | oh063 | 1997 | 1:12000 |
Westland clay loam | We | 1422 | 168971 | 5ntp | oh065 | 1987 | 1:15840 |
Westland silty clay loam, clay substratum | Wf | 41 | 1611232 | 1r2m7 | oh065 | 1987 | 1:15840 |
Westland silt loam, overwash | Ws | 765 | 1420541 | 1jp5x | oh071 | 1973 | 1:15840 |
Westland silty clay loam | Wt | 420 | 1420542 | 1jp5y | oh071 | 1973 | 1:15840 |
Westland silty clay loam | Ws | 3195 | 171090 | 5r11 | oh089 | 1986 | 1:15840 |
Westland-Urban land complex | Wt | 315 | 171091 | 5r12 | oh089 | 1986 | 1:15840 |
Westland silty clay loam, clay substratum | Wu | 2918 | 171177 | 5r3v | oh091 | 1977 | 1:15840 |
Westland silty clay loam, Southern Ohio Till Plain, 0 to 2 percent slopes | Wt | 1459 | 171176 | 2t4m2 | oh091 | 1977 | 1:15840 |
Westland clay loam | Ws | 435 | 1593183 | 1qgv0 | oh091 | 1977 | 1:15840 |
Westland silty clay loam, Southern Ohio Till Plain, 0 to 2 percent slopes | Wt | 5058 | 169919 | 2t4m2 | oh097 | 1978 | 1:15840 |
Westland silty clay loam, silty substratum | Wv | 3650 | 169920 | 5pt9 | oh097 | 1978 | 1:15840 |
Westland clay loam | We | 1484 | 171225 | 5r5d | oh101 | 1984 | 1:15840 |
Westland silty clay loam, Southern Ohio Till Plain, 0 to 2 percent slopes | Wt | 1185 | 169547 | 2t4m2 | oh109 | 1973 | 1:15840 |
Westland silty clay loam, Southern Ohio Till Plain, 0 to 2 percent slopes | Ws | 880 | 170329 | 2t4m2 | oh113 | 1969 | 1:15840 |
Westland silty clay loam, Southern Ohio Till Plain, 0 to 2 percent slopes | Ws | 9131 | 171311 | 2t4m2 | oh129 | 1977 | 1:15840 |
Westland clay loam, SOTP, 0 to 2 percent slopes | Wk | 33 | 1403064 | 2w57l | oh129 | 1977 | 1:15840 |
Westland silt loam, 0 to 2 percent slopes | WnA | 3387 | 624807 | nz52 | oh135 | 2005 | 1:12000 |
Westland clay loam, SOTP, 0 to 2 percent slopes | Wk | 3091 | 170978 | 2w57l | oh141 | 1997 | 1:15840 |
Westland silty clay loam | Wc | 1409 | 1406108 | 1j65b | oh159 | 1970 | 1:15840 |
Westland-Rensselaer complex, 0 to 1 percent slopes | WfA | 88 | 1542644 | 1ns7q | oh175 | 1980 | 1:15840 |
Westland clay loam | We | 13 | 1542650 | 1ns7x | oh175 | 1980 | 1:15840 |