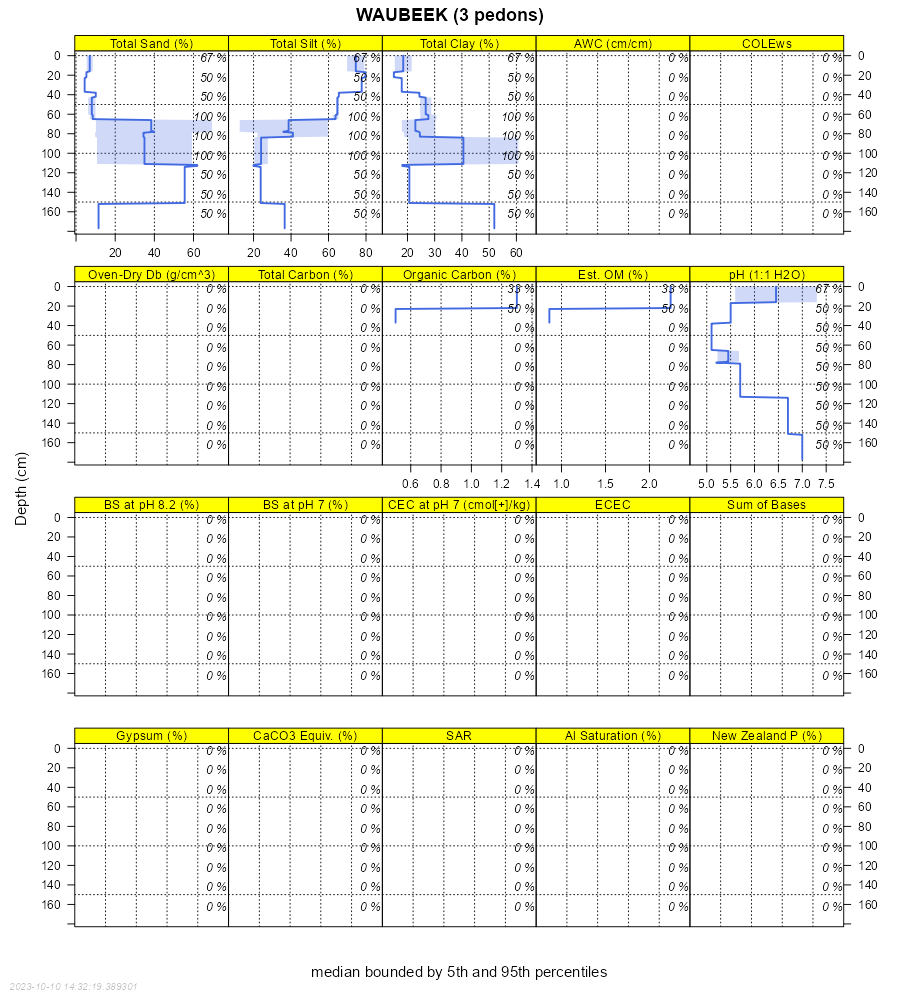
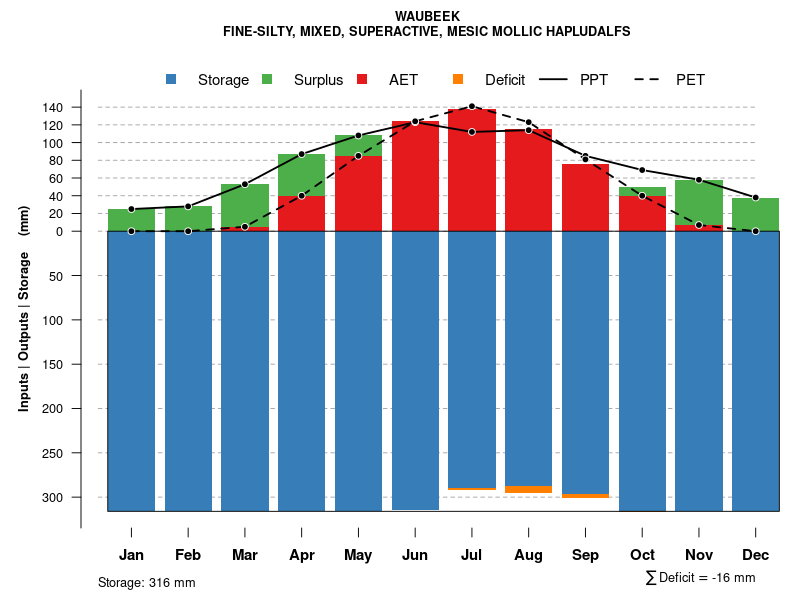
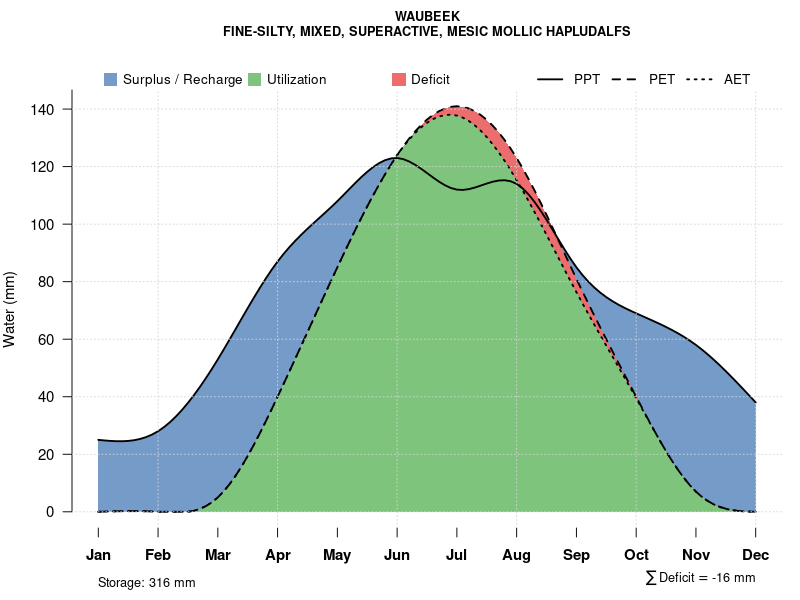
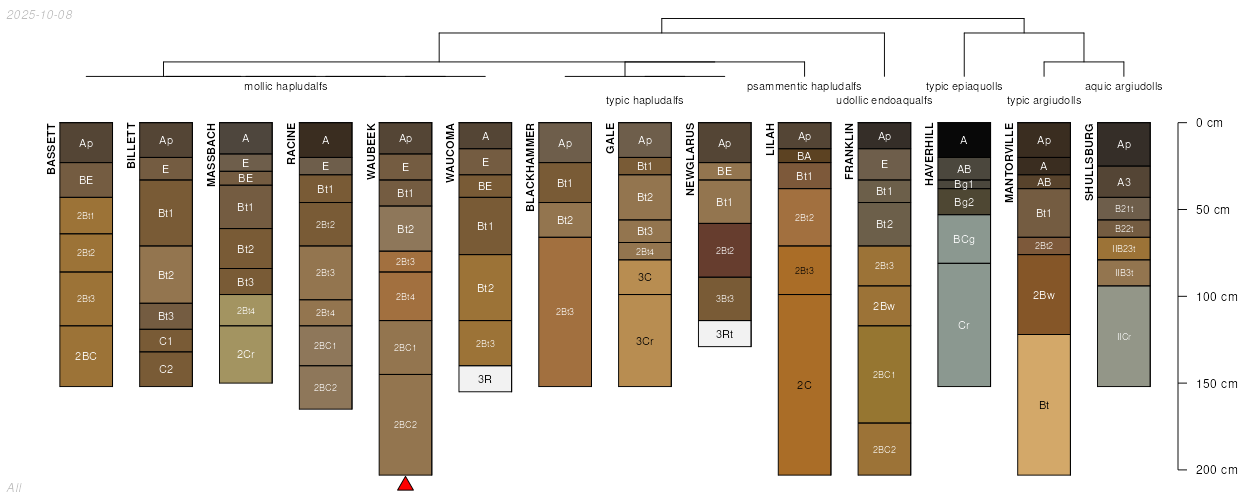
| Waubeek silt loam, 2 to 5 percent slopes | 771B | 994 | 402915 | 2y8q3 | ia011 | 1977 | 1:15840 |
Waubeek silt loam, 5 to 9 percent slopes, eroded | 771C2 | 953 | 402917 | 2y8q6 | ia011 | 1977 | 1:15840 |
Waubeek silt loam, 5 to 9 percent slopes | 771C | 665 | 402916 | 2y8q5 | ia011 | 1977 | 1:15840 |
Waubeek silt loam, 2 to 5 percent slopes | 771B | 496 | 413271 | 2y8q3 | ia013 | 2001 | 1:12000 |
Waubeek-Urban land complex, 2 to 5 percent slopes | 4771B | 149 | 413350 | 2y8q9 | ia013 | 2001 | 1:12000 |
Waubeek-Urban land complex, 5 to 14 percent slopes | 4771D | 83 | 449415 | 2y8qb | ia013 | 2001 | 1:12000 |
Waubeek silt loam, 2 to 5 percent slopes | 771B | 326 | 403430 | 2y8q3 | ia023 | 1978 | 1:15840 |
Waubeek silt loam, 2 to 5 percent slopes | 771B | 1182 | 1397137 | 2y8q3 | ia031 | 2008 | 1:12000 |
Waubeek silt loam, 2 to 5 percent slopes | 771B | 707 | 405079 | 2y8q3 | ia055 | 1984 | 1:15840 |
Waubeek silt loam, 5 to 9 percent slopes | 771C | 468 | 405080 | 2y8q5 | ia055 | 1984 | 1:15840 |
Waubeek silt loam, 2 to 5 percent slopes | 771B | 311 | 406012 | 2y8q3 | ia067 | 1989 | 1:15840 |
Waubeek silt loam, 0 to 2 percent slopes | 771 | 123 | 406011 | 2y8q4 | ia067 | 1989 | 1:15840 |
Waubeek silt loam, 2 to 5 percent slopes | 771B | 1259 | 404953 | 2y8q3 | ia069 | 1977 | 1:15840 |
Waubeek silt loam, 5 to 9 percent slopes | 771C | 271 | 404954 | 2y8q5 | ia069 | 1977 | 1:15840 |
Waubeek silt loam, 5 to 9 percent slopes, eroded | 771C2 | 451 | 406695 | 2y8q6 | ia083 | 1982 | 1:15840 |
Waubeek silt loam, 9 to 14 percent slopes, eroded | 771D2 | 300 | 406696 | 2y8q8 | ia083 | 1982 | 1:15840 |
Waubeek silt loam, 2 to 5 percent slopes | 771B | 221 | 406694 | 2y8q3 | ia083 | 1982 | 1:15840 |
Waubeek silt loam, 5 to 9 percent slopes, eroded | 771C2 | 294 | 757969 | 2y8q6 | ia095 | 2005 | 1:12000 |
Waubeek silt loam, 2 to 5 percent slopes | 771B | 262 | 757968 | 2y8q3 | ia095 | 2005 | 1:12000 |
Waubeek silt loam, 2 to 5 percent slopes | 771B | 1033 | 408049 | 2y8q3 | ia103 | 1979 | 1:15840 |
Waubeek silt loam, 5 to 9 percent slopes, eroded | 771C2 | 473 | 408050 | 2y8q6 | ia103 | 1979 | 1:15840 |
Waubeek silt loam, 2 to 5 percent slopes | 771B | 5476 | 408199 | 2y8q3 | ia105 | 1988 | 1:15840 |
Waubeek silt loam, 5 to 9 percent slopes | 771C | 4651 | 408200 | 2y8q5 | ia105 | 1988 | 1:15840 |
Waubeek silt loam, 9 to 14 percent slopes | 771D | 545 | 408202 | 2y8q7 | ia105 | 1988 | 1:15840 |
Waubeek silt loam, 5 to 9 percent slopes, eroded | 771C2 | 536 | 408201 | 2y8q6 | ia105 | 1988 | 1:15840 |
Waubeek silt loam, 9 to 14 percent slopes, eroded | 771D2 | 206 | 408203 | 2y8q8 | ia105 | 1988 | 1:15840 |
Waubeek silt loam, 2 to 5 percent slopes | 771B | 972 | 408670 | 2y8q3 | ia113 | 1970 | 1:15840 |
Waubeek-Urban land complex, 2 to 5 % slopes | 4771B | 699 | 2606469 | 2qcrw | ia113 | 1970 | 1:15840 |
Waubeek silt loam, 5 to 9 percent slopes, eroded | 771C2 | 305 | 408671 | 2y8q6 | ia113 | 1970 | 1:15840 |
Waubeek-Urban land complex, 5 to 14 % slopes | 4771D | 113 | 2606470 | 2qcrx | ia113 | 1970 | 1:15840 |
Waubeek silt loam, 2 to 5 percent slopes | 771B | 4913 | 409699 | 2y8q3 | ia131 | 1971 | 1:15840 |
Waubeek silt loam, 0 to 2 percent slopes | 771 | 2022 | 409698 | 2y8q4 | ia131 | 1971 | 1:15840 |
Waubeek silt loam, 5 to 9 percent slopes, eroded | 771C2 | 647 | 410032 | 2y8q6 | ia139 | 1986 | 1:15840 |
Waubeek silt loam, 9 to 14 percent slopes, eroded | 771D2 | 365 | 410033 | 2y8q8 | ia139 | 1986 | 1:15840 |
Waubeek silt loam, 5 to 9 percent slopes, eroded | 771C2 | 751 | 411557 | 2y8q6 | ia171 | 1989 | 1:15840 |
Waubeek silt loam, 2 to 5 percent slopes | 771B | 395 | 411555 | 2y8q3 | ia171 | 1989 | 1:15840 |
Waubeek silt loam, 9 to 14 percent slopes, eroded | 771D2 | 273 | 411558 | 2y8q8 | ia171 | 1989 | 1:15840 |
Waubeek silt loam, 5 to 9 percent slopes | 771C | 145 | 411556 | 2y8q5 | ia171 | 1989 | 1:15840 |
Waubeek and Massbach soils, 6 to 12 percent slopes, moderately eroded | N538C2 | 90 | 1385015 | 1hh6x | mn039 | 2005 | 1:12000 |
Waubeek and Massbach soils, 6 to 12 percent slopes, moderately eroded | N538C2 | 105 | 1711646 | 1vg3d | mn049 | 2007 | 1:12000 |
Waubeek silt loam, 1 to 6 percent slopes | 369B | 4793 | 400767 | fg0z | mn109 | 1977 | 1:15840 |
Waubeek silt loam, 6 to 12 percent slopes | 369C | 1863 | 400768 | fg10 | mn109 | 1977 | 1:15840 |
Waubeek silt loam, 6 to 12 percent slopes | 369C | 621 | 429042 | gdg2 | mn169 | 1987 | 1:20000 |
Waubeek silt loam, 2 to 6 percent slopes | 369B | 610 | 429041 | gdg1 | mn169 | 1987 | 1:20000 |
