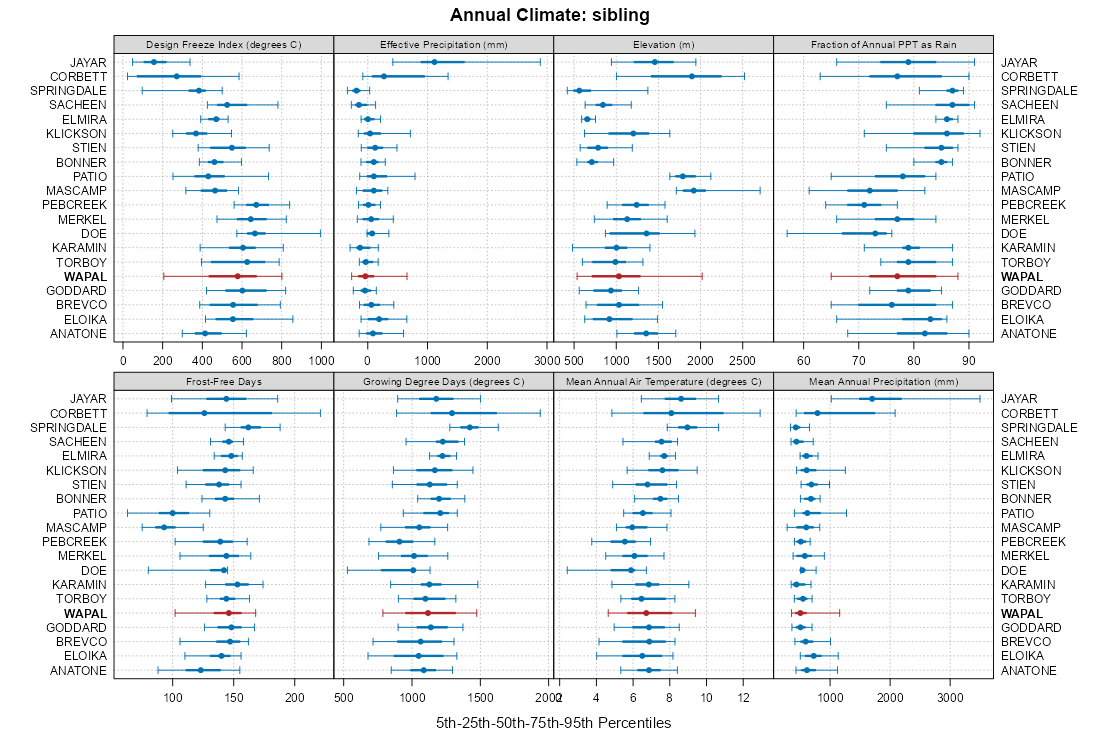
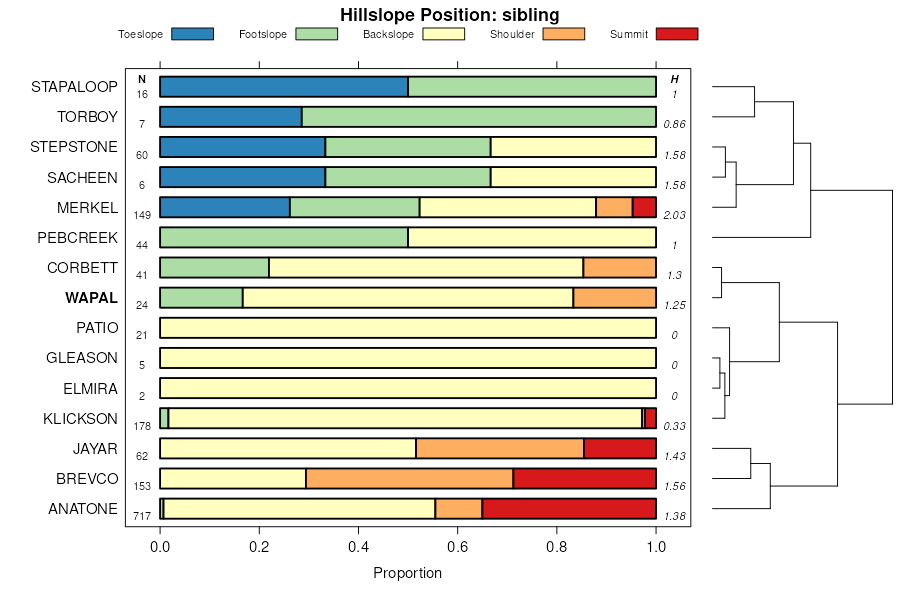
| Rock outcrop, dioritic-Wapal family, moderately deep association, 45 to 75 percent slopes | 503 | 6463 | 470308 | hsd7 | ca701 | 1984 | 1:24000 |
Wapal family, moderately deep-Deadman family, deep complex, 35 to 65 percent slopes | 552 | 5736 | 470319 | hsdl | ca701 | 1984 | 1:24000 |
Wapal family, moderately deep-Hugo family, deep, dioritic association, 20 to 65 percent slopes | 554 | 2721 | 470320 | hsdm | ca701 | 1984 | 1:24000 |
Wapal family, moderately deep, 35 to 65 percent slopes | 550 | 2361 | 470318 | hsdk | ca701 | 1984 | 1:24000 |
Jayar, deep-Wapal families complex, 10 to 50 percent slopes. | 163st | 17 | 1905984 | 21zbc | ca702 | 1984 | 1:24000 |
Wapal-Patio deep-Anatone families association, 35 to 60 percent slopes. | 282 | 7050 | 470595 | hsph | ca703 | 1983 | 1:24000 |
Wapal-Patio deep families association, 15 to 35 percent slopes. | 281 | 2610 | 470594 | hspg | ca703 | 1983 | 1:24000 |
Wapal-Anatone-Patio deep families association, 60 to 90 percent slopes. | 280 | 940 | 470593 | hspf | ca703 | 1983 | 1:24000 |
Jayar, deep-Wapal families complex, 10 to 50 percent slopes. | 163 | 6017 | 470761 | hsvv | ca707 | 1983 | 1:24000 |
Typic Cryaquolls-Wapal family association, 0 to 30 percent slopes. | 327 | 1315 | 470925 | ht14 | ca707 | 1983 | 1:24000 |
Rock outcrop, dioritic-Wapal family, moderately deep association, 45 to 75 percent slopes. | 503sr | 204 | 1868232 | 20q1k | ca707 | 1983 | 1:24000 |
Wapal family-Lithic Xerorthents, cool association, 50 to 75 percent slopes | WpG | 17585 | 471676 | httc | ca777 | 1981 | 1:24000 |
Merkel-Wapal families complex, 30 to 50 percent slopes | FbF | 6675 | 471643 | hts9 | ca777 | 1981 | 1:24000 |
Wapal-Corbett families association, 30 to 50 percent slopes | WpF | 4575 | 471675 | httb | ca777 | 1981 | 1:24000 |
Corbett-Wapal families association, 2 to 30 percent slopes | CoDE | 2640 | 471621 | htrl | ca777 | 1981 | 1:24000 |
Wapal gravelly ashy coarse sandy loam, 15 to 30 percent slopes | 3145 | 20 | 2651287 | nvb9 | wa043 | 1978 | 1:24000 |
Wapal gravelly ashy coarse sandy loam, 0 to 8 percent slopes | 3144 | 3437 | 783727 | v9jj | wa063 | 2012 | 1:24000 |
Scoap-Wapal complex, 30 to 60 percent slopes | 3146 | 2904 | 85877 | 2wc7 | wa063 | 2012 | 1:24000 |
Wapal gravelly ashy coarse sandy loam, 15 to 30 percent slopes | 3145 | 2176 | 621125 | nvb9 | wa063 | 2012 | 1:24000 |
Bonner-Wapal complex, 8 to 15 percent slopes | 3031 | 1207 | 783694 | v9hg | wa063 | 2012 | 1:24000 |
Bonner-Wapal complex, 8 to 15 percent slopes | 3031 | 83 | 2651306 | v9hg | wa065 | 1978 | 1:24000 |
Wapal gravelly ashy sandy loam, 0 to 15 percent slopes | WgC | 7081 | 70208 | 2v73d | wa619 | 1968 | 1:24000 |
Wapal gravelly sandy loam, 35 to 65 percent slopes | WgF | 2484 | 70210 | 2c1v | wa619 | 1968 | 1:24000 |
Wapal gravelly sandy loam, 15 to 35 percent slopes | WgE | 1461 | 70209 | 2c1t | wa619 | 1968 | 1:24000 |
Wapal sandy loam, 25 to 65 percent slopes | WaF | 618 | 70207 | 2c1r | wa619 | 1968 | 1:24000 |
Wapal ashy sandy loam, 0 to 20 percent slopes | 391 | 10 | 1602628 | 1qsnp | wa619 | 1968 | 1:24000 |
Wapal gravelly sandy loam, 30 to 65 percent slopes | 508 | 4103 | 70665 | 2cjj | wa648 | 1987 | 1:24000 |
Wapal gravelly ashy sandy loam, 0 to 15 percent slopes | 505 | 2412 | 70662 | 2v73d | wa648 | 1987 | 1:24000 |
Wapal gravelly sandy loam, 15 to 30 percent slopes | 507 | 852 | 70664 | 2cjh | wa648 | 1987 | 1:24000 |
Wapal cobbly sandy loam, 0 to 15 percent slopes | 506 | 488 | 70663 | 2cjg | wa648 | 1987 | 1:24000 |
Wapal ashy coarse sandy loam, 0 to 20 percent slopes | 550 | 4805 | 1902862 | 21w2n | wa649 | 2008 | 1:24000 |
Wapal-Rock outcrop complex, 35 to 65 percent slopes | 556 | 1850 | 2109109 | 28sps | wa649 | 2008 | 1:24000 |
Wapal-Brevco complex, 15 to 35 percent slopes | 554 | 1050 | 2109108 | 28spr | wa649 | 2008 | 1:24000 |
Wapal stony ashy coarse sandy loam, 0 to 15 percent slopes | 551 | 1020 | 1900009 | 21s3m | wa649 | 2008 | 1:24000 |
Wapal-Sacheen complex, 35 to 65 percent slopes | 557 | 690 | 1899826 | 21rxq | wa649 | 2008 | 1:24000 |
Wapal stony ashy coarse sandy loam, 15 to 35 percent slopes | 552 | 470 | 1900007 | 21s3k | wa649 | 2008 | 1:24000 |
Wapal stony ashy coarse sandy loam, 35 to 65 percent slopes | 553 | 310 | 1899999 | 21s39 | wa649 | 2008 | 1:24000 |
Wapal-Brevco complex, 35 to 65 percent slopes | 555 | 195 | 1900000 | 21s3b | wa649 | 2008 | 1:24000 |
Wapal-Brevco complex, 35 to 65 percent slopes | 398 | 12170 | 75871 | 2jyg | wa749 | 2005 | 1:24000 |
Wapal-Rock outcrop complex, 35 to 65 percent slopes | 399 | 8443 | 75882 | 2jyt | wa749 | 2005 | 1:24000 |
Wapal very stony ashy coarse sandy loam, dry, 35 to 65 percent slopes | 396 | 4718 | 75880 | 2jyr | wa749 | 2005 | 1:24000 |
Wapal very stony ashy coarse sandy loam, 15 to 35 percent slopes | 394 | 4594 | 75881 | 2jys | wa749 | 2005 | 1:24000 |
Wapal-Brevco complex, 15 to 35 percent slopes | 397 | 3704 | 75872 | 2jyh | wa749 | 2005 | 1:24000 |
Wapal stony ashy coarse sandy loam, 0 to 15 percent slopes | 392 | 3294 | 75887 | 2jyz | wa749 | 2005 | 1:24000 |
Wapal very stony ashy coarse sandy loam, 35 to 65 percent slopes | 395 | 3167 | 75870 | 2jyf | wa749 | 2005 | 1:24000 |
Wapal-Sacheen complex, 35 to 65 percent slopes | 400 | 1543 | 76034 | 2k3q | wa749 | 2005 | 1:24000 |
Lithic Haploxerepts-Wapal-Rock outcrop complex, 35 to 65 percent slopes | 213 | 1507 | 75879 | 2jyq | wa749 | 2005 | 1:24000 |
Wapal ashy sandy loam, 0 to 20 percent slopes | 391 | 1339 | 76057 | 2k4g | wa749 | 2005 | 1:24000 |
Wapal bouldery ashy sandy loam, 15 to 35 percent slopes | 393 | 986 | 76040 | 2k3x | wa749 | 2005 | 1:24000 |