| Wainola loamy fine sand, 0 to 2 percent slopes | WaA | 607 | 189297 | 6bzc | mi011 | 1964 | 1:20000 |
Wainola loamy fine sand, 2 to 6 percent slopes | WaB | 171 | 189298 | 6bzd | mi011 | 1964 | 1:20000 |
Wainola-Kinross-Rousseau complex, 0 to 35 percent slopes | 48E | 14871 | 415157 | fy05 | mi033 | 1989 | 1:15840 |
Kinross-Wainola complex, 0 to 3 percent slopes | 137A | 9803 | 415093 | fxy3 | mi033 | 1989 | 1:15840 |
Wainola fine sand, 0 to 3 percent slopes | 49A | 4436 | 415158 | 2zytr | mi033 | 1989 | 1:15840 |
Dawson-Deer Park-Wainola complex, 0 to 50 percent slopes | 154F | 2662 | 415112 | fxyq | mi033 | 1989 | 1:15840 |
Wainola fine sand, 0 to 3 percent slopes | 49A | 1646 | 1588125 | 2zytr | mi041 | 1969 | 1:24000 |
Wainola loamy fine sand, outwash plain, 0 to 3 percent slopes | 985A | 2557 | 3340046 | 2zyts | mi043 | 1985 | 1:20000 |
Wainola fine sand, 0 to 3 percent slopes | 47A | 54 | 415222 | fy28 | mi043 | 1985 | 1:20000 |
Wainola loamy fine sand, 0 to 6 percent slopes | WaB | 780 | 189378 | 6c1z | mi047 | 1968 | 1:20000 |
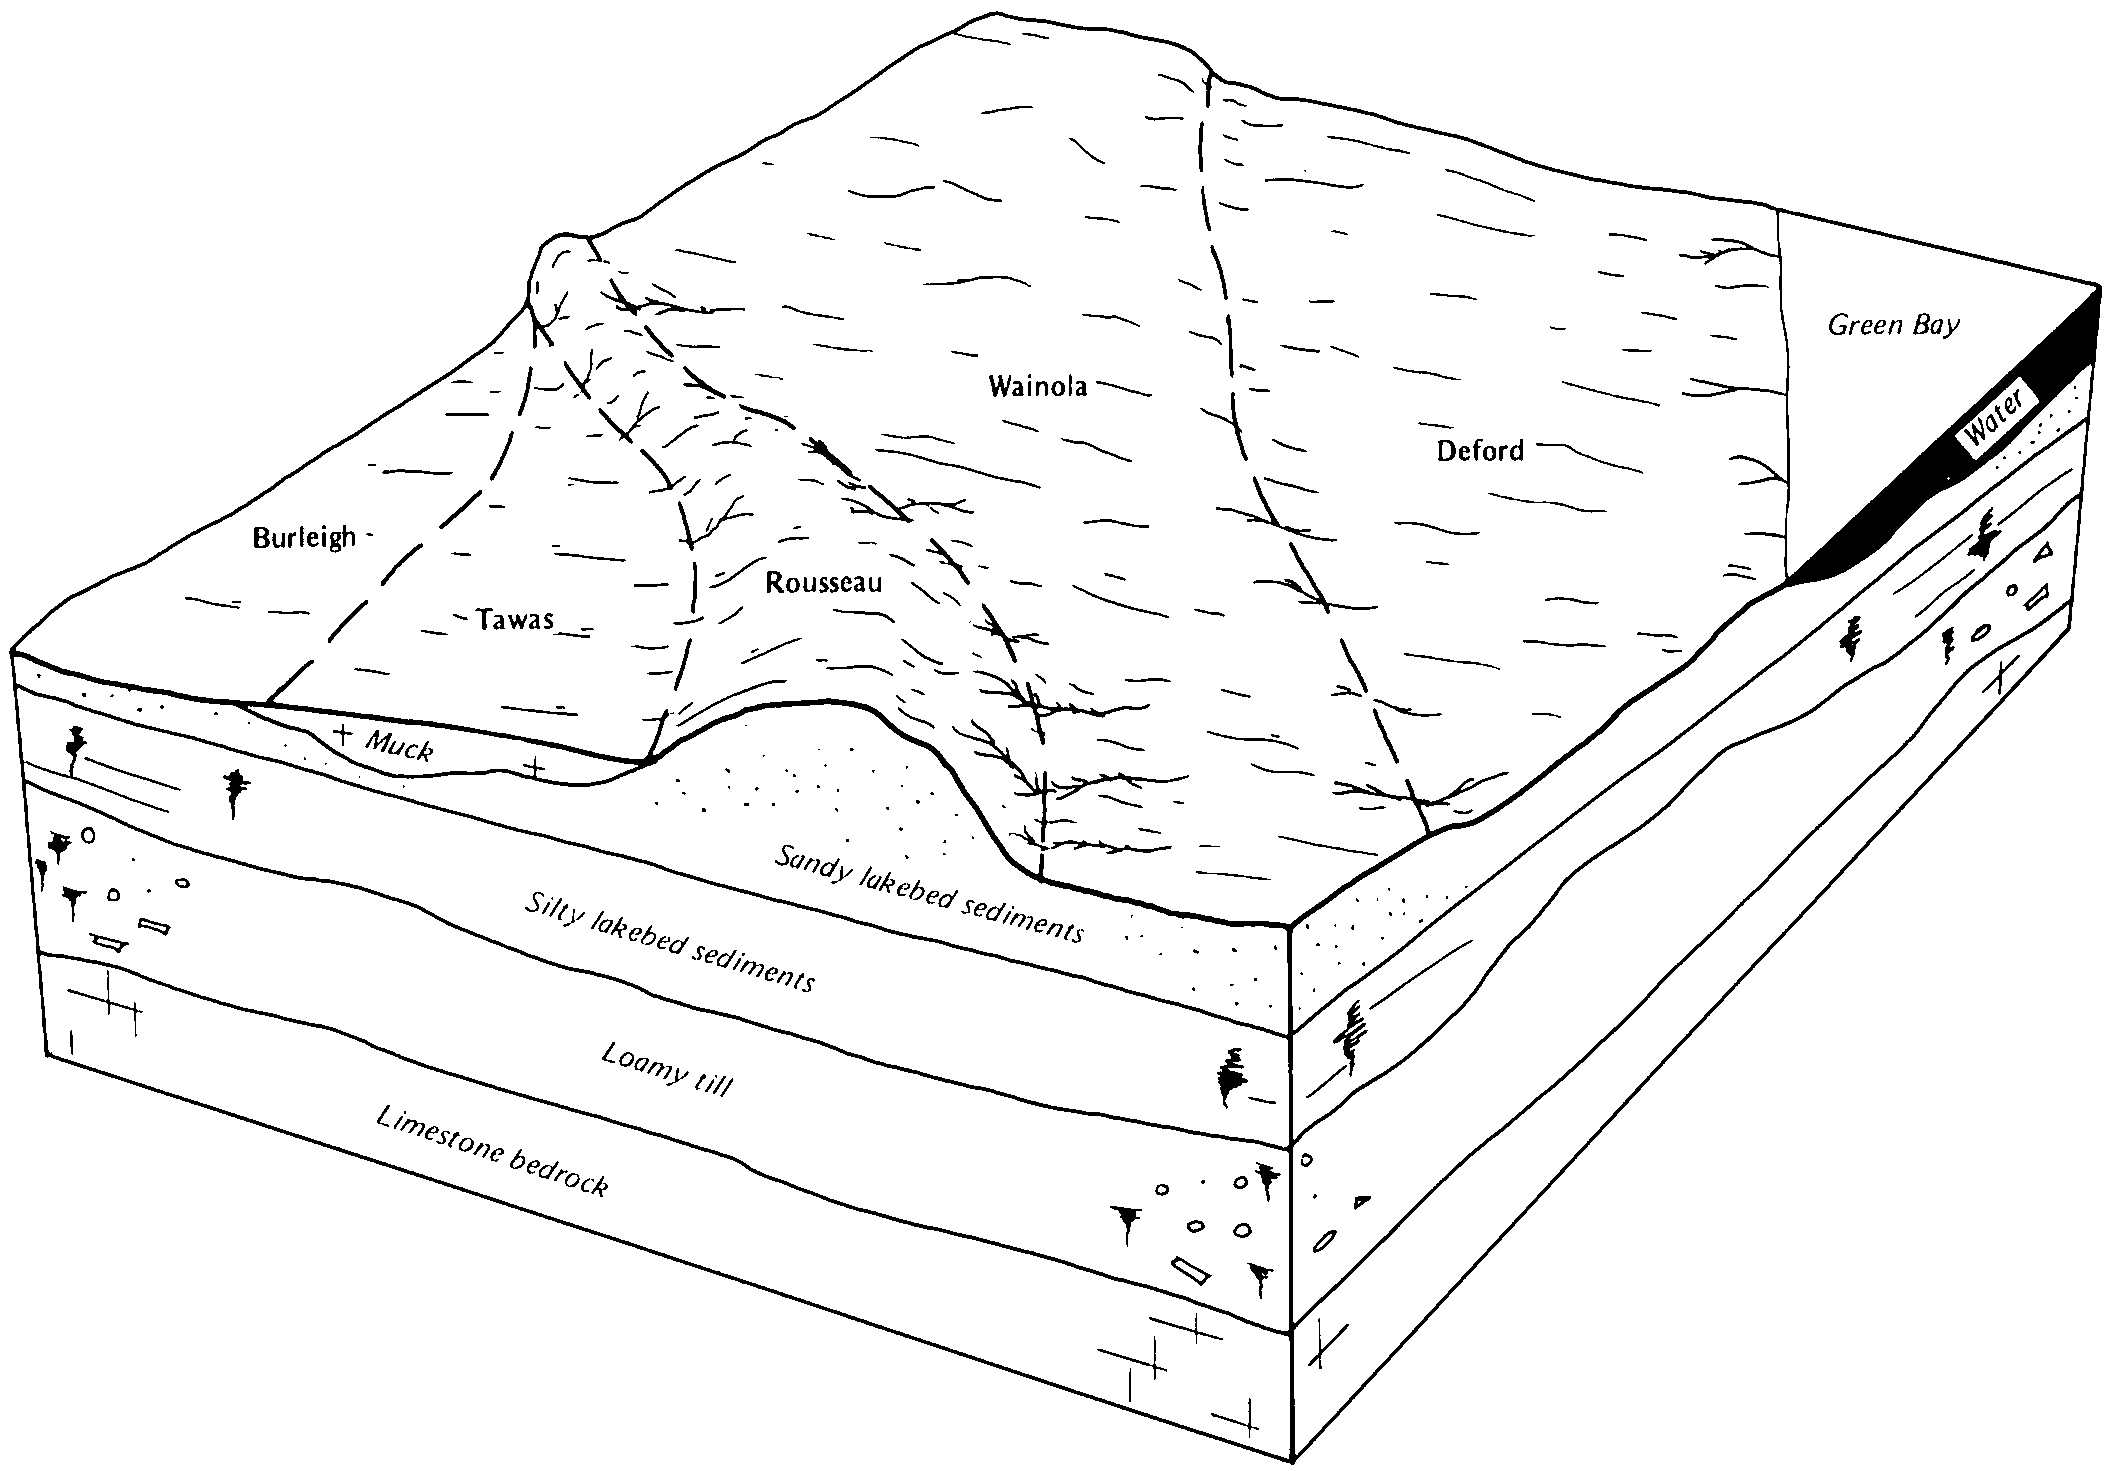
Wainola-Deford association | WD | 1419 | 189865 | 6ckp | mi051 | 1966 | 1:15840 |
Wainola-Trap Falls complex, 0 to 3 percent slopes | 293A | 37 | 1456172 | 1kw89 | mi053 | 2007 | 1:24000 |
Manido-Wainola complex, 0 to 4 percent slopes | 8235B | 1314 | 2485004 | 2pdvf | mi061 | 1989 | 1:20000 |
Wainola-Ingalls-Liminga complex, terrace, 1 to 55 percent slopes | 8152F | 196 | 2484793 | 2pdmm | mi061 | 1989 | 1:20000 |
Wainola fine sand, 0 to 2 percent slopes | 8153A | 144 | 2484794 | 2pdmn | mi061 | 1989 | 1:20000 |
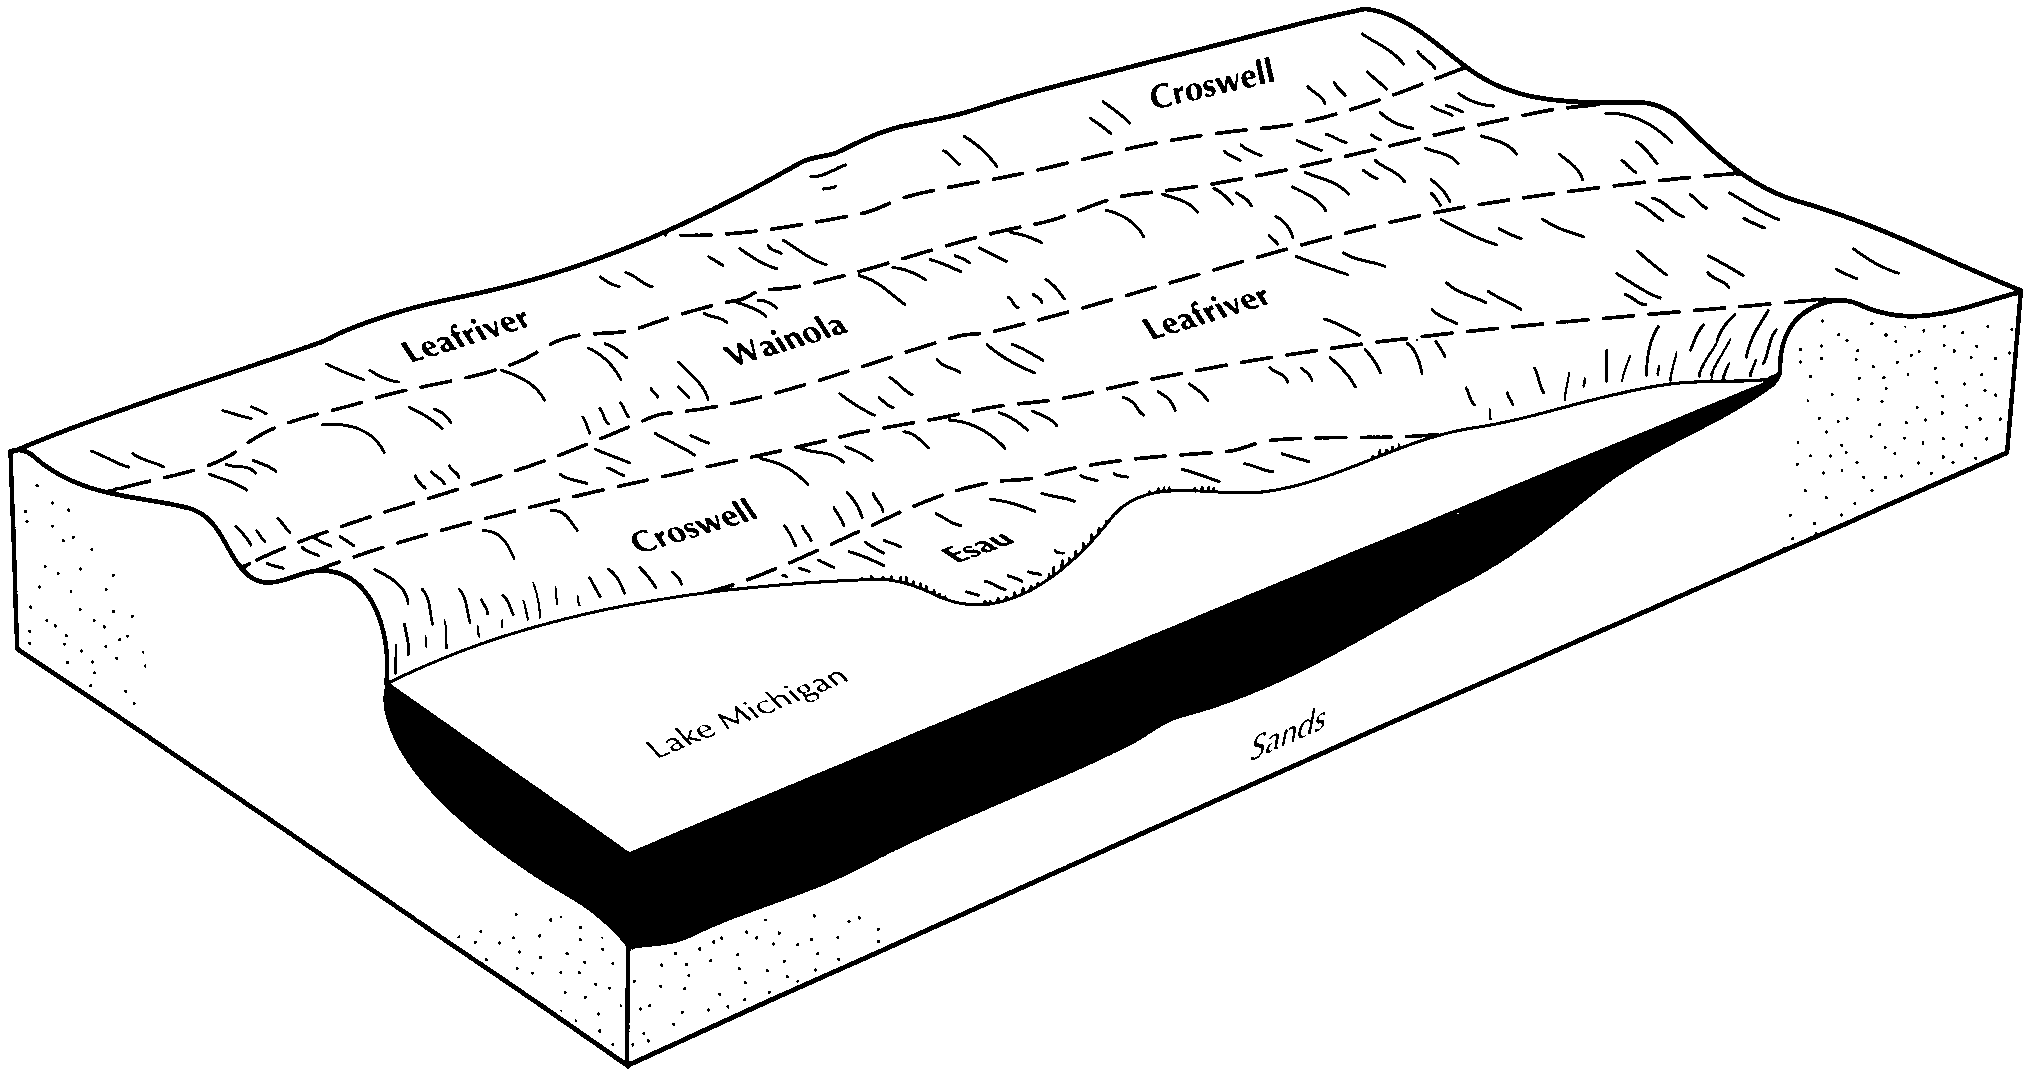
Leafriver-Croswell-Wainola complex, 0 to 6 percent slopes | 172B | 15854 | 416349 | fz7m | mi097 | 1994 | 1:20000 |
Wainola-Leafriver-Pullup complex, 0 to 35 percent slopes | 48E | 2446 | 416408 | fz9j | mi097 | 1994 | 1:20000 |
Wainola fine sand, 0 to 3 percent slopes | 49A | 2212 | 416409 | 2zytr | mi097 | 1994 | 1:20000 |
Croswell-Wainola complex, 0 to 6 percent slopes | 88B | 1752 | 416430 | fzb7 | mi097 | 1994 | 1:20000 |
Wainola-Deford fine sands, 0 to 2 percent slopes | WdA | 24 | 2508668 | 6924 | mi099 | 1967 | 1:20000 |
Wainola loamy fine sand, 0 to 2 percent slopes | WaA | 1 | 2508667 | 6923 | mi099 | 1967 | 1:20000 |
Deford-Wainola-Rousseau complex, 0 to 12 percent slopes | 45C | 35413 | 415481 | fybm | mi109 | 1985 | 1:20000 |
Wainola fine sand, 0 to 3 percent slopes | 49A | 4615 | 3340048 | 2zytr | mi109 | 1985 | 1:20000 |
Wainola fine sand, 0 to 3 percent slopes | 22A | 1213 | 415460 | fy9y | mi109 | 1985 | 1:20000 |
Wainola-Deford association | WD | 34 | 2673566 | 6ckp | mi111 | 1976 | 1:15840 |
Manido-Wainola complex, 0 to 4 percent slopes | 8235B | 851 | 1674872 | 1t6v4 | mi131 | 2007 | 1:24000 |
Wainola fine sand, 0 to 2 percent slopes | 8153A | 708 | 1674843 | 1t6t6 | mi131 | 2007 | 1:24000 |
Wainola-Trap Falls complex, 0 to 3 percent slopes | 8293A | 456 | 1674898 | 1t6vz | mi131 | 2007 | 1:24000 |
Wainola-Ingalls-Liminga complex, terrace, 1 to 55 percent slopes | 8152F | 12 | 1674842 | 1t6t5 | mi131 | 2007 | 1:24000 |
Wainola-Deford fine sands, 0 to 2 percent slopes | WdA | 25418 | 187461 | 6924 | mi147 | 1969 | 1:20000 |
Wainola-Tobico complex, 0 to 3 percent slopes | WnA | 3250 | 187462 | 6925 | mi147 | 1969 | 1:20000 |
Wainola loamy fine sand, 0 to 2 percent slopes | WaA | 451 | 187460 | 6923 | mi147 | 1969 | 1:20000 |
Wainola-Deford fine sands, 0 to 2 percent slopes | WfA | 25 | 2508316 | 6924 | mi151 | 1955 | 1:15840 |
Neconish-Kinross-Wainola complex, 0 to 6 percent slopes | 525B | 8560 | 1457046 | 1kx5h | mi153 | 2007 | 1:24000 |
Neconish-Deford, rarely flooded-Wainola complex, 0 to 6 percent slopes | 491B | 2490 | 1611820 | 1r376 | mi153 | 2007 | 1:24000 |
Deer Park-Dawson-Wainola complex, 0 to 60 percent slopes | 80F | 995 | 1610311 | 1r1nj | mi153 | 2007 | 1:24000 |
Wainola loamy fine sand | Wn | 4559 | 290254 | 9r11 | ny019 | 1995 | 1:24000 |
Wainola loamy fine sand | 33 | 73 | 296054 | 9y24 | ny689 | 1999 | 1:24000 |
Wainola loamy fine sand | 7985A | 2254 | 422284 | g5f2 | wi029 | 1975 | 1:15840 |
Wainola loamy fine sand, 0 to 3 percent slopes | 7985A | 1102 | 422360 | g5hj | wi061 | 1978 | 1:15840 |
Wainola fine sand, 0 to 3 percent slopes | 3349A | 18179 | 3340049 | 2zytr | wi075 | 1987 | 1:20000 |
Wainola loamy fine sand, outwash plain, 0 to 3 percent slopes | 3985A | 2821 | 3340050 | 2zyts | wi075 | 1987 | 1:20000 |
Wainola loamy fine sand, 0 to 3 percent slopes | 7985A | 1440 | 422456 | g5lm | wi075 | 1987 | 1:20000 |
Wainola loamy fine sand, outwash plain, 0 to 3 percent slopes | 3985A | 390 | 395876 | 2zyts | wi078 | 1998 | 1:12000 |
Wainola loamy fine sand, 0 to 3 percent slopes | 7985A | 12200 | 422522 | g5nr | wi083 | 1985 | 1:15840 |
Wainola loamy fine sand, outwash plain, 0 to 3 percent slopes | 3985A | 9056 | 3340053 | 2zyts | wi083 | 1985 | 1:15840 |
Wainola fine sand, 0 to 3 percent slopes | 3349A | 7709 | 3340052 | 2zytr | wi083 | 1985 | 1:15840 |
Wainola loamy fine sand, 0 to 3 percent slopes | 7985A | 12199 | 422606 | g5rg | wi087 | 1975 | 1:15840 |
Wainola fine sand, 0 to 3 percent slopes | 7749A | 6228 | 422646 | g5sr | wi115 | 1981 | 1:15840 |
Wainola loamy fine sand, outwash plain, 0 to 3 percent slopes | 3985A | 2977 | 3340054 | 2zyts | wi115 | 1981 | 1:15840 |
Wainola loamy fine sand | 7985A | 4375 | 422758 | g5xc | wi135 | 1982 | 1:15840 |