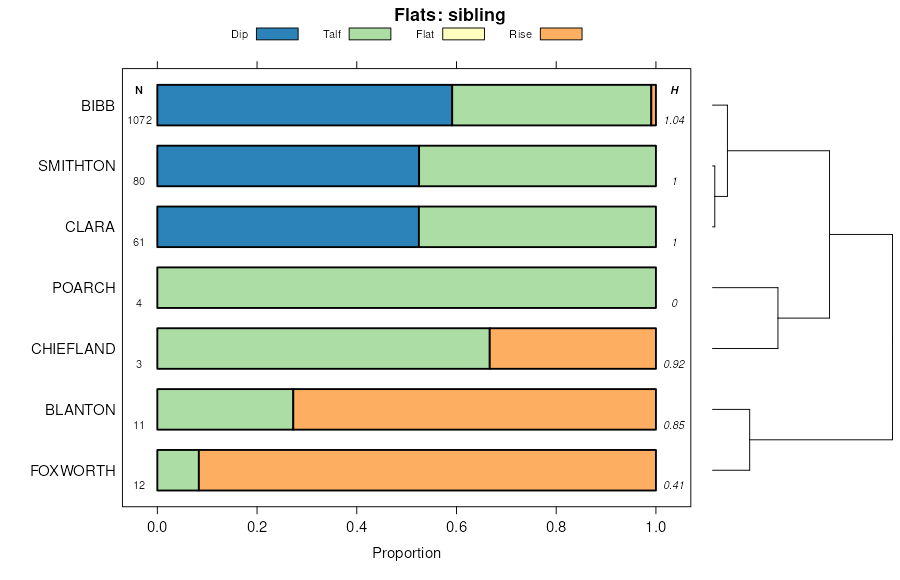
| Heidel-Wadley complex, 15 to 30 percent slopes | HeE | 33212 | 3116211 | 2z46z | al001 | 1972 | 1:20000 |
Heidel-Wadley complex, 5 to 15 percent slopes | HeD | 19301 | 3116212 | 2z470 | al001 | 1972 | 1:20000 |
Heidel-Wadley complex, 2 to 8 percent slopes | HeC | 6422 | 3272038 | 2zkvw | al001 | 1972 | 1:20000 |
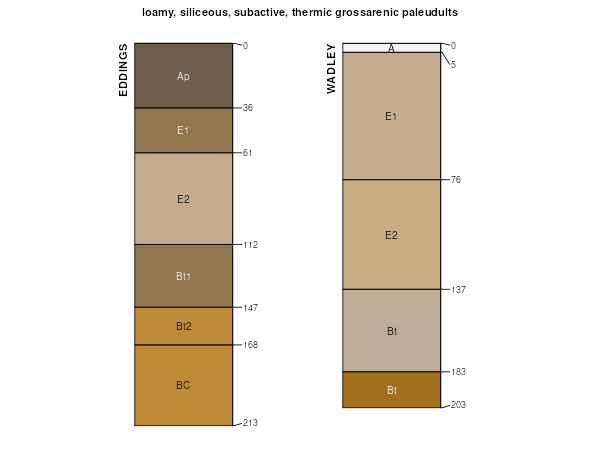
Wadley loamy fine sand, 0 to 5 percent slopes | EuB | 29576 | 3121726 | 2x59m | al003 | 1961 | 1:20000 |
Wadley loamy fine sand, 5 to 8 percent slopes | EuC | 7491 | 328130 | 2x5qf | al003 | 1961 | 1:20000 |
Wadley-Heidel complex, 8 to 15 percent slopes | EuD | 2002 | 328131 | 2x5qd | al003 | 1961 | 1:20000 |
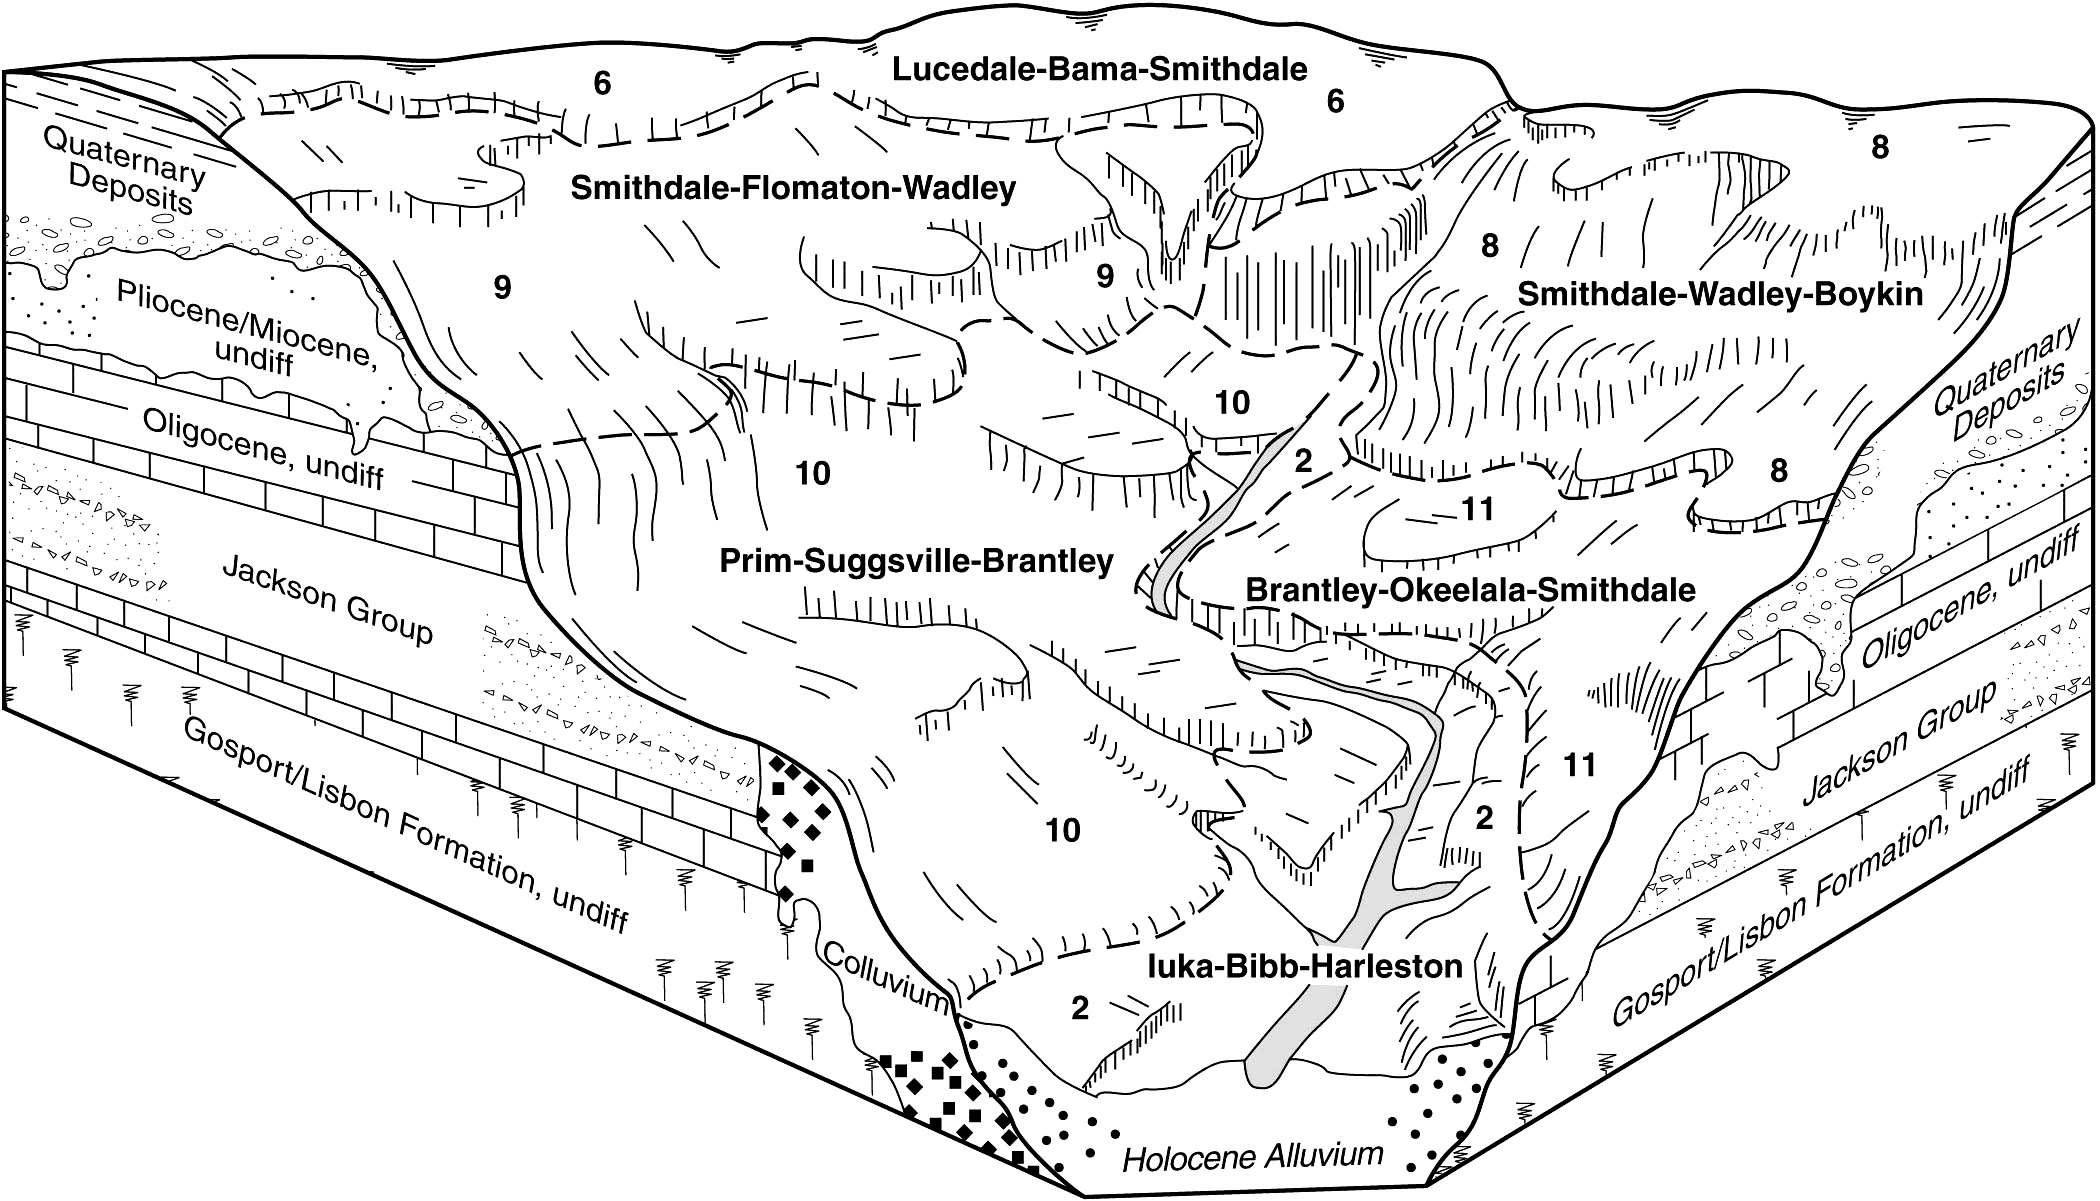
Wadley-Smithdale-Boykin complex, 5 to 20 percent slopes | WdE | 5645 | 2247144 | 2ffbj | al007 | 2007 | 1:24000 |
Wadley-Boykin complex, 15 to 35 percent slopes | WbF | 1415 | 2247141 | 2ffbf | al007 | 2007 | 1:24000 |
Wadley loamy fine sand, 1 to 5 percent slopes | WaB | 2100 | 328566 | c0wx | al023 | 1998 | 1:24000 |
Wadley-Smithdale complex, 15 to 35 percent slopes | WsF | 65730 | 600045 | 2wtz1 | al025 | 2004 | 1:24000 |
Maubila-Wadley-Smithdale complex, 8 to 30 percent slopes | MbF | 49630 | 600074 | n4f7 | al025 | 2004 | 1:24000 |
Flomaton-Smithdale-Wadley complex, 10 to 25 percent slopes | FaE | 21580 | 600099 | n4g1 | al025 | 2004 | 1:24000 |
Wadley loamy sand, 1 to 5 percent slopes | WaB | 2600 | 600095 | n4fx | al025 | 2004 | 1:24000 |
Wadley-Smithdale-Boykin complex, 5 to 20 percent slopes | WbD | 6242 | 725102 | sbjd | al065 | 2003 | 1:24000 |
Wadley-Boykin complex, 15 to 35 percent slopes | WbF | 487 | 725098 | sbj8 | al065 | 2003 | 1:24000 |
Wadley loamy sand, 0 to 5 percent slopes | WaB | 166 | 329770 | c24r | al065 | 2003 | 1:24000 |
Boykin-Wadley complex, 15 to 30 percent slopes | BpE | 18950 | 330562 | c2z9 | al091 | 1997 | 1:24000 |
Wadley loamy fine sand, 5 to 15 percent slopes | WdD | 10520 | 330607 | c30r | al091 | 1997 | 1:24000 |
Wadley loamy fine sand, 0 to 5 percent slopes | WaB | 49971 | 2995029 | 2x59m | al097 | 2018 | 1:24000 |
Wadley-Heidel complex, 8 to 15 percent slopes | WhD | 47139 | 2995027 | 2x5qd | al097 | 2018 | 1:24000 |
Wadley-Heidel complex, 15 to 25 percent slopes | WhE | 39462 | 2995064 | 2x5r1 | al097 | 2018 | 1:24000 |
Wadley-Heidel complex, 2 to 8 percent slopes | WhC | 16146 | 2995063 | 2x5r0 | al097 | 2018 | 1:24000 |
Wadley loamy fine sand, 5 to 8 percent slopes | WaC | 15411 | 2995028 | 2x5qf | al097 | 2018 | 1:24000 |
Wadley-Urban land complex, 0 to 8 percent slopes | WuC | 15246 | 2995030 | 2x5qg | al097 | 2018 | 1:24000 |
Wadley-Urban land complex, 8 to 15 percent slopes | WuD | 4542 | 2995031 | 2x5qh | al097 | 2018 | 1:24000 |
Wadley-Boykin-Smithdale complex, 15 to 35 percent slopes | WbF | 4295 | 2642149 | 2rrx6 | al129 | 2013 | 1:24000 |
Wadley-Boykin-Smithdale complex, 5 to 15 percent slopes | WbD | 4043 | 2642148 | 2rrx5 | al129 | 2013 | 1:24000 |
Wadley loamy fine sand, 0 to 5 percent slopes | WaB | 1362 | 2642147 | 2x59m | al129 | 2013 | 1:24000 |
Penney-Wadley complex, 0 to 5 percent slopes | 16 | 3995 | 1421086 | 1jprh | fl029 | 1998 | 1:24000 |
Wadley fine sand, 0 to 5 percent slopes | 13 | 5180 | 321796 | bsvj | fl041 | 1989 | 1:20000 |
Wadley sand, 0 to 5 percent slopes | 18 | 1940 | 1148813 | 17kfh | fl047 | 1995 | 1:24000 |
Wadley sand, 5 to 12 percent slopes | 17 | 580 | 1148812 | 17kfg | fl047 | 1995 | 1:24000 |
Wadley-Toinette-Smithdale association, 12 to 40 percent slopes | EsF | 19856 | 3121741 | 2z24j | ms023 | 1963 | 1:15840 |
Wadley-Heidel complex, 8 to 15 percent slopes | EsD | 2771 | 331987 | 2x5qd | ms023 | 1963 | 1:15840 |
Wadley loamy fine sand, 5 to 8 percent slopes | EsC | 2290 | 331986 | 2x5qf | ms023 | 1963 | 1:15840 |
Wadley loamy fine sand, 0 to 5 percent slopes | EsB | 580 | 3121727 | 2x59m | ms023 | 1963 | 1:15840 |
Wadley-Toinette-Smithdale association, 12 to 40 percent slopes | EsF | 11190 | 3121740 | 2z24j | ms031 | 1962 | 1:15840 |
Wadley loamy fine sand, 5 to 8 percent slopes | EsC | 404 | 332133 | 2x5qf | ms031 | 1962 | 1:15840 |
Wadley loamy fine sand, 0 to 5 percent slopes | EsB | 140 | 3121728 | 2x59m | ms031 | 1962 | 1:15840 |
Wadley-Heidel complex, 8 to 15 percent slopes | EsD | 134 | 332134 | 2x5qd | ms031 | 1962 | 1:15840 |
Wadley loamy fine sand, 5 to 8 percent slopes | TrB | 240 | 332242 | 2x5qf | ms035 | 1976 | 1:20000 |
Wadley loamy fine sand, 0 to 5 percent slopes | EsB | 15306 | 3121729 | 2x59m | ms039 | 1967 | 1:20000 |
Wadley-Heidel complex, 8 to 15 percent slopes | EsE | 7464 | 332263 | 2x5qd | ms039 | 1967 | 1:20000 |
Wadley loamy fine sand, 5 to 15 percent slopes | EsD | 6433 | 3121723 | 2z3t2 | ms039 | 1967 | 1:20000 |
Wadley-Boykin-Smithdale complex, 5 to 15 percent slopes | WbD | 5071 | 2642253 | 2rs3y | ms041 | 2012 | 1:24000 |
Wadley loamy fine sand, 0 to 5 percent slopes | WaB | 3290 | 2642252 | 2x59m | ms041 | 2012 | 1:24000 |
Wadley loamy fine sand, 5 to 15 percent slopes | EuD | 1000 | 3121724 | 2z3t2 | ms041 | 2012 | 1:24000 |
Wadley-Boykin-Smithdale complex, 15 to 35 percent slopes | WbF | 273 | 2642254 | 2rs3z | ms041 | 2012 | 1:24000 |
Wadley loamy fine sand, 0 to 5 percent slopes | EuB | 438 | 3121730 | 2x59m | ms045 | 1979 | 1:20000 |
Wadley and Poarch soils, 8 to 17 percent slopes | EuE | 8410 | 3121722 | 2z3t3 | ms047 | 1971 | 1:20000 |
Wadley loamy fine sand, 0 to 5 percent slopes | EtB | 1882 | 3121731 | 2x59m | ms047 | 1971 | 1:20000 |
Wadley loamy fine sand, 0 to 5 percent slopes | 84 | 12866 | 3121732 | 2x59m | ms059 | 1997 | 1:24000 |
Wadley loamy fine sand, 5 to 15 percent slopes | 17 | 2991 | 3121725 | 2z3t2 | ms059 | 1997 | 1:24000 |
Wadley-Heidel complex, 8 to 15 percent slopes | 18 | 991 | 332559 | 2x5qd | ms059 | 1997 | 1:24000 |
Wadley loamy fine sand, 0 to 5 percent slopes | EaB | 787 | 3121733 | 2x59m | ms075 | 1980 | 1:20000 |
Wadley loamy fine sand, 5 to 8 percent slopes | TaB | 3721 | 333568 | 2x5qf | ms109 | 1980 | 1:20000 |
Wadley fine sand, 0 to 5 percent slopes | WdC | 2577 | 333628 | c656 | ms111 | 1997 | 1:20000 |
Wadley fine sand, 5 to 15 percent slopes | WdE | 1866 | 333629 | c657 | ms111 | 1997 | 1:20000 |
Wadley loamy fine sand, 5 to 8 percent slopes | 40 | 882 | 334135 | 2x5qf | ms131 | 1997 | 1:24000 |
Wadley-Heidel complex, 8 to 15 percent slopes | 9 | 782 | 334166 | 2x5qd | ms131 | 1997 | 1:24000 |
Wadley loamy fine sand, 0 to 5 percent slopes | 10 | 377 | 3121734 | 2x59m | ms131 | 1997 | 1:24000 |
Wadley-Boykin-Smithdale complex, 5 to 15 percent slopes | WsD | 6201 | 2403474 | 2lp0f | ms153 | 2008 | 1:24000 |
Wadley fine sand, 0 to 5 percent slopes | WaB | 856 | 2403473 | 2lp0d | ms153 | 2008 | 1:24000 |
