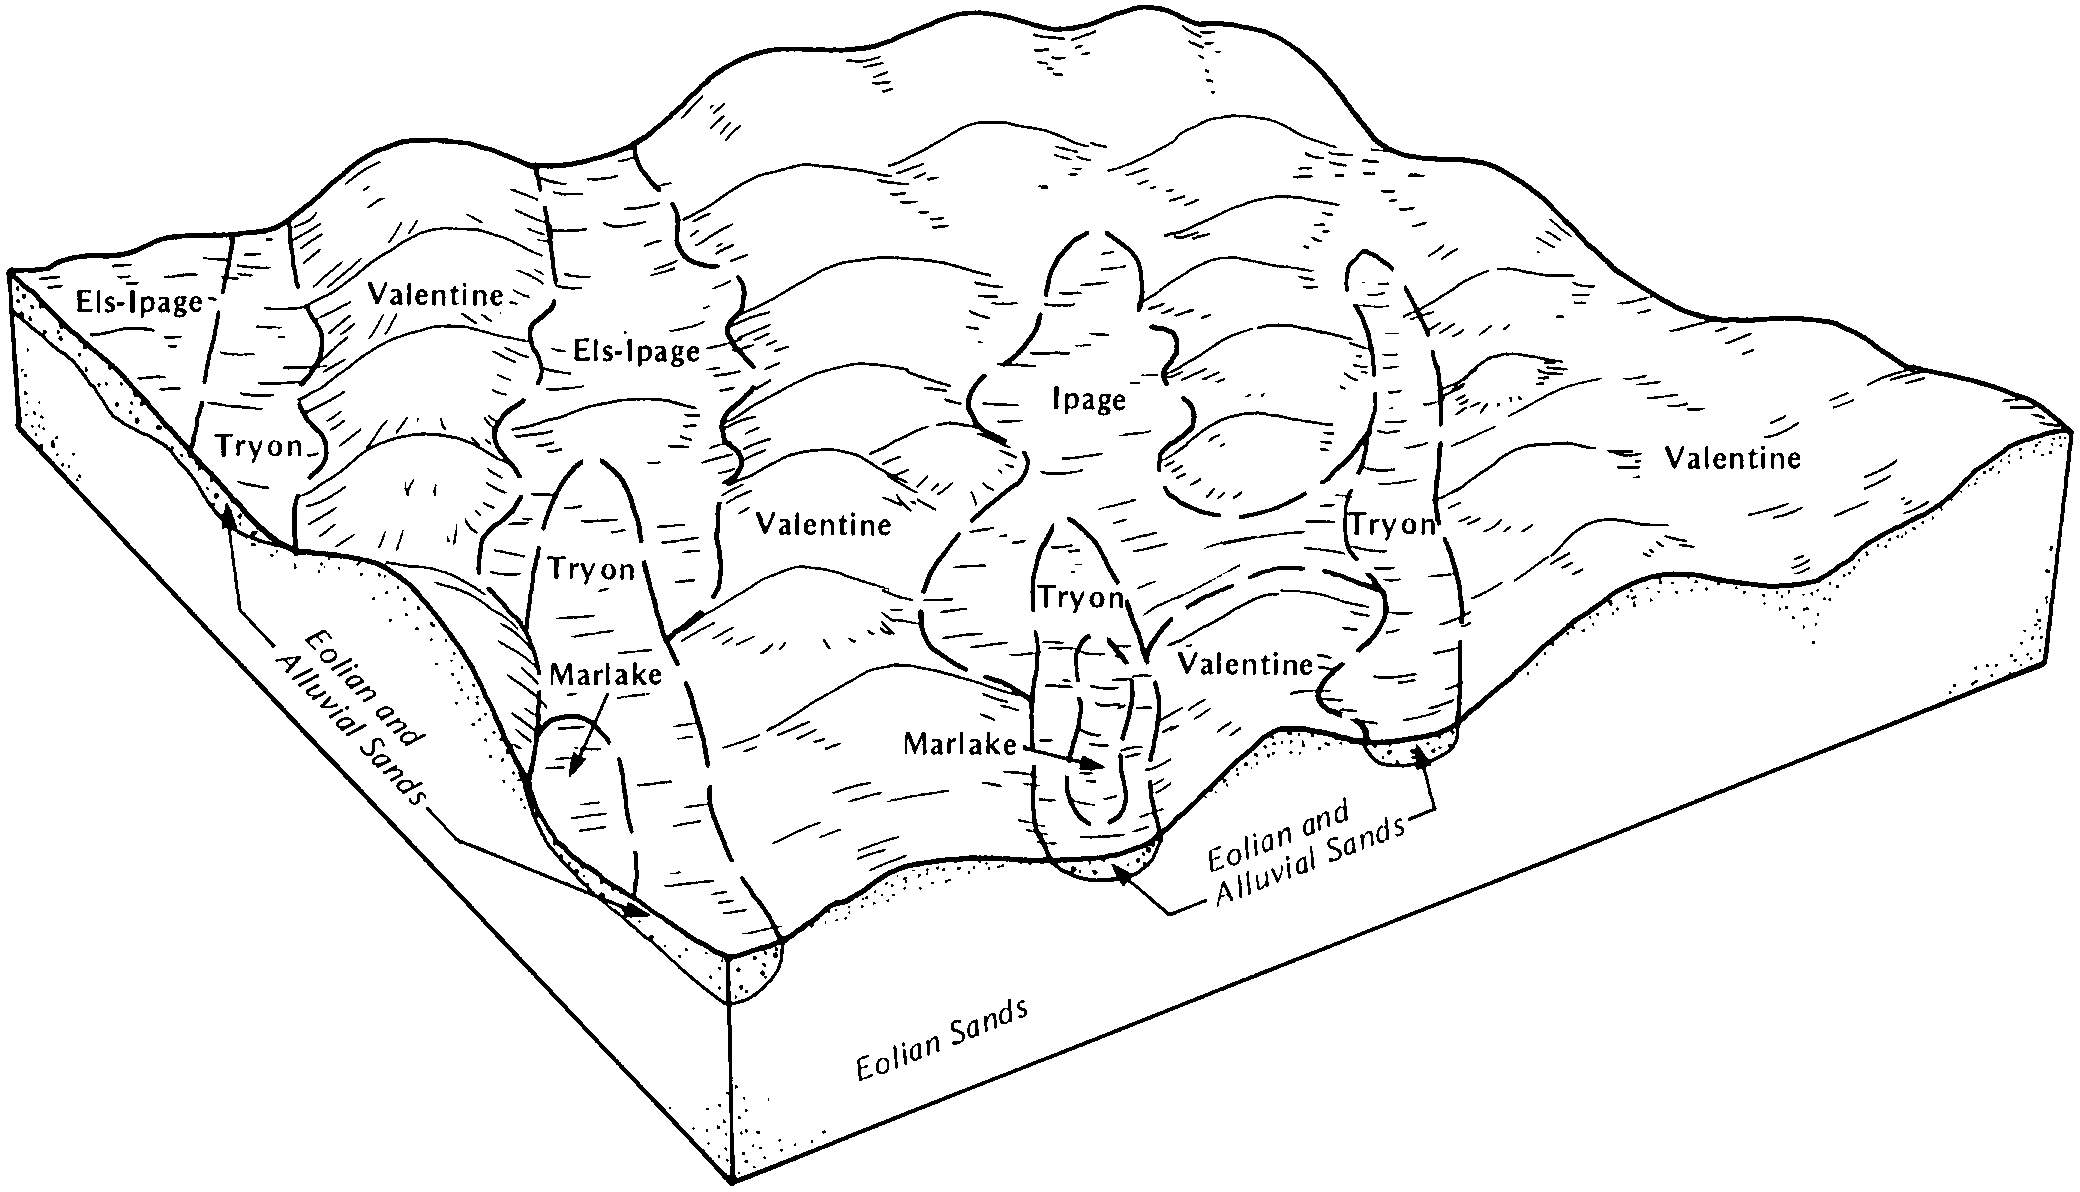
| Valentine-Tryon, complex, 0 to 24 percent slopes | 4772 | 681 | 2435748 | 2s814 | ne005 | 1973 | 1:24000 |
Ipage-Tryon complex, 0 to 3 percent slopes | 4655 | 5538 | 1699492 | 2v9vs | ne009 | 1988 | 1:20000 |
Els-Tryon complex, 0 to 3 percent slopes | 4563 | 4496 | 2219153 | 2wgdq | ne009 | 1988 | 1:20000 |
Tryon loamy fine sand, 0 to 3 percent slopes | 4746 | 1302 | 1699500 | 2s816 | ne009 | 1988 | 1:20000 |
Tryon loamy fine sand, frequently ponded, 0 to 3 percent slopes | 4751 | 697 | 1699501 | 2s817 | ne009 | 1988 | 1:20000 |
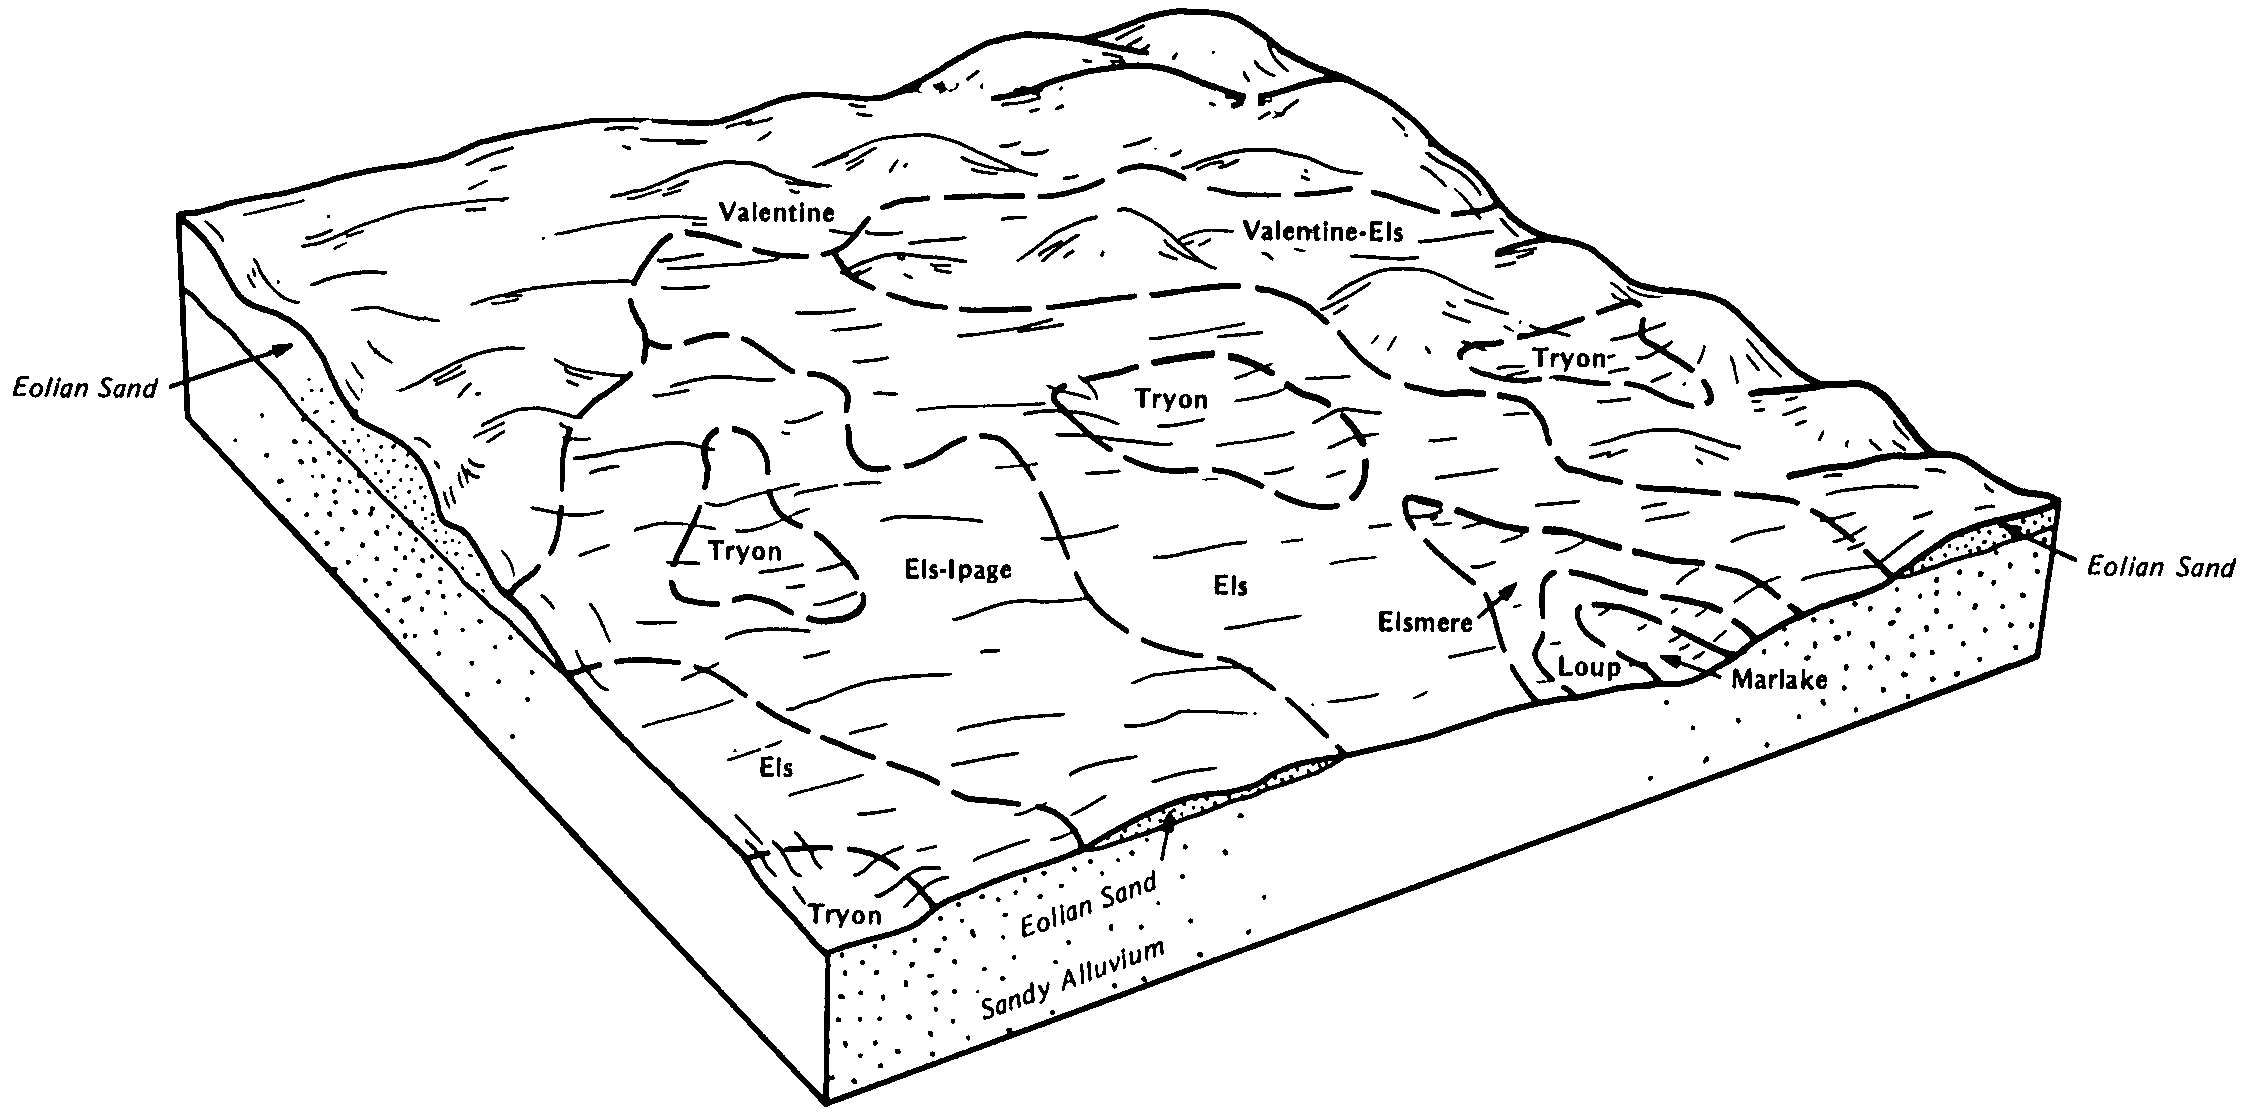
Els-Tryon complex, 0 to 3 percent slopes | 4563 | 8516 | 2219173 | 2wgdq | ne017 | 1987 | 1:20000 |
Valentine-Tryon, complex, 0 to 24 percent slopes, moist | 4887 | 7192 | 2738844 | 2s815 | ne017 | 1987 | 1:20000 |
Tryon loamy fine sand, 0 to 3 percent slopes | 4746 | 5591 | 100028 | 2s816 | ne017 | 1987 | 1:20000 |
Tryon loamy fine sand, frequently ponded, 0 to 3 percent slopes | 4751 | 1731 | 100029 | 2s817 | ne017 | 1987 | 1:20000 |
Valentine-Tryon, complex, 0 to 24 percent slopes | 4772 | 1284 | 2738843 | 2s814 | ne017 | 1987 | 1:20000 |
Valentine-Tryon fine sands, 0 to 24 percent slopes | 4889 | 183 | 2219178 | 2s813 | ne017 | 1987 | 1:20000 |
Tryon fine sandy loam, 0 to 3 percent slopes | 4740 | 91 | 2219175 | 2s81c | ne017 | 1987 | 1:20000 |
Tryon fine sandy loam, frequently ponded | 4743 | 15 | 2219176 | 2s81d | ne017 | 1987 | 1:20000 |
Ipage-Tryon complex, 0 to 3 percent slopes | 4655 | 83266 | 100400 | 2v9vs | ne031 | 1995 | 1:24000 |
Valentine-Tryon fine sands, 0 to 24 percent slopes | 4889 | 82019 | 100457 | 2s813 | ne031 | 1995 | 1:24000 |
Els-Tryon complex, 0 to 3 percent slopes | 4563 | 47503 | 100371 | 2wgdq | ne031 | 1995 | 1:24000 |
Tryon fine sandy loam, 0 to 3 percent slopes | 4740 | 13570 | 100433 | 2s81c | ne031 | 1995 | 1:24000 |
Tryon fine sandy loam, frequently ponded | 4743 | 9291 | 100434 | 2s81d | ne031 | 1995 | 1:24000 |
Tryon-Ipage complex, 0 to 3 percent slopes | 4758 | 11059 | 1699806 | 2wgfp | ne071 | 1984 | 1:20000 |
Tryon loamy fine sand, frequently ponded, 0 to 3 percent slopes | 4751 | 8394 | 1699805 | 2s817 | ne071 | 1984 | 1:20000 |
Tryon loamy fine sand, 0 to 3 percent slopes | 4746 | 6762 | 1699804 | 2s816 | ne071 | 1984 | 1:20000 |
Tryon loamy fine sand, frequently ponded, 0 to 3 percent slopes | 4751 | 893 | 1698849 | 2s817 | ne075 | 1973 | 1:24000 |
Tryon loamy fine sand, drained, 0 to 3 percent slopes | 4750 | 436 | 1698850 | 1v0sm | ne075 | 1973 | 1:24000 |
Valentine-Tryon, complex, 0 to 24 percent slopes | 4772 | 159 | 2479686 | 2s814 | ne075 | 1973 | 1:24000 |
Ipage-Tryon, wet, complex, silty substratum, 0 to 3 percent slopes | 4657 | 3360 | 1700154 | 1v24p | ne079 | 2003 | 1:12000 |
Valentine-Tryon, silty substratum, complex, 0 to 9 percent slopes | 4890 | 1125 | 1700192 | 1v25x | ne079 | 2003 | 1:12000 |
Els-Tryon complex, 0 to 3 percent slopes | 4563 | 1099 | 1700118 | 1v23j | ne079 | 2003 | 1:12000 |
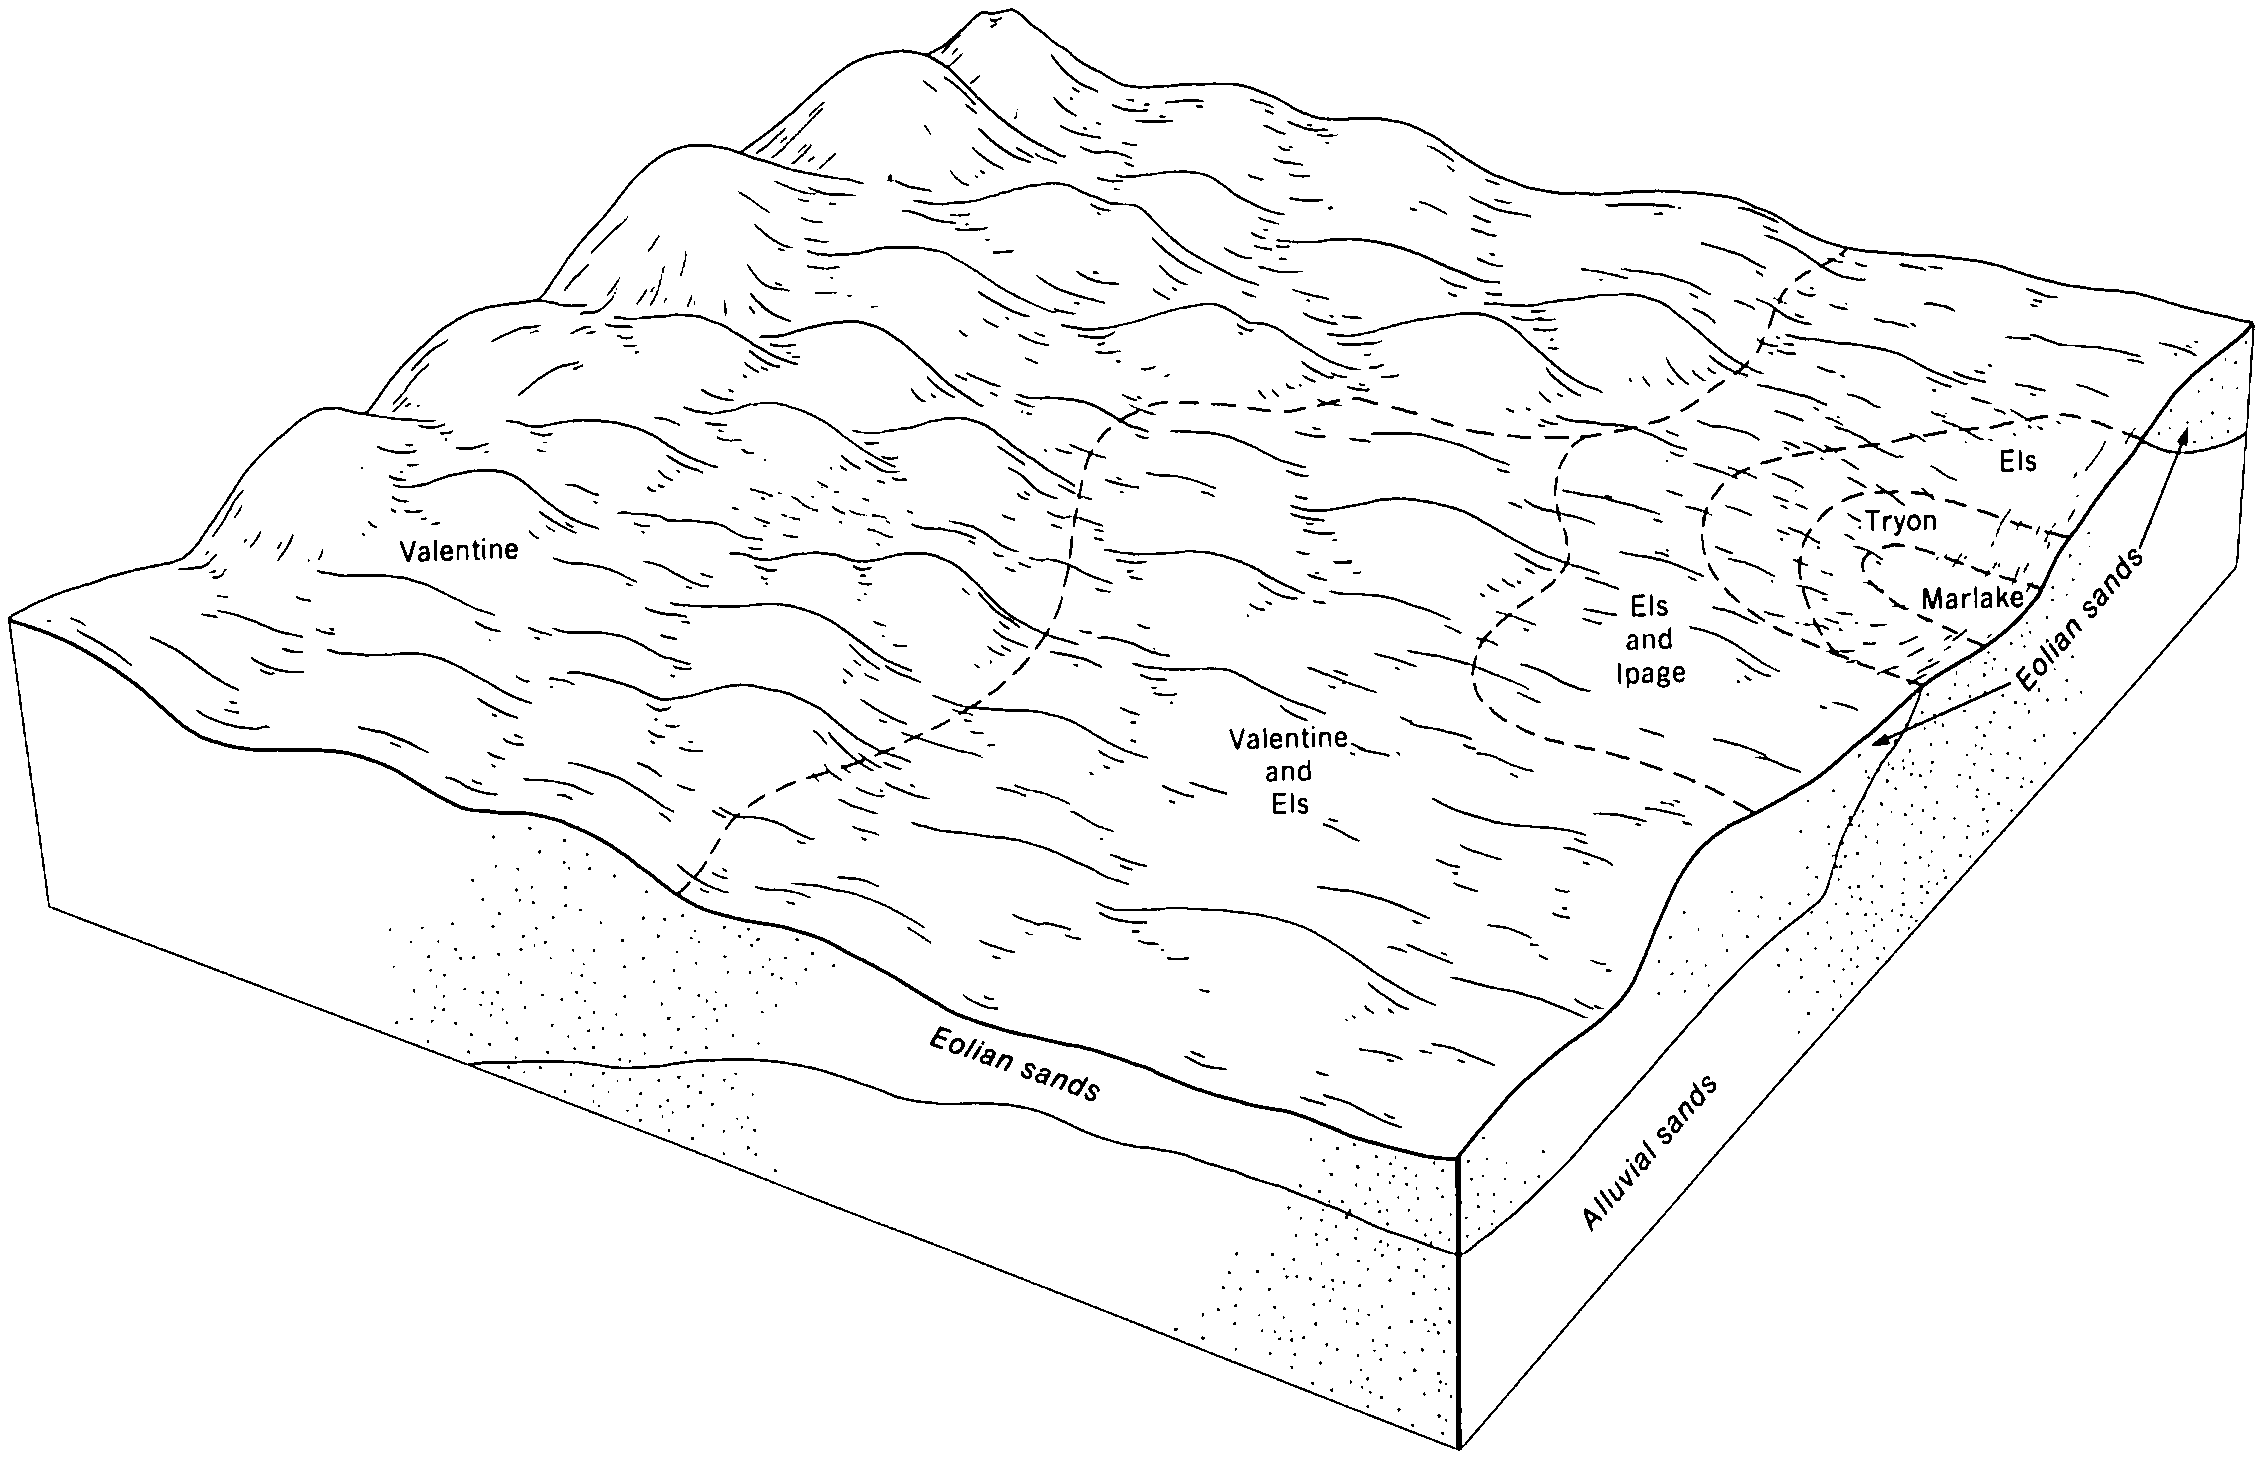
Tryon loamy fine sand, 0 to 3 percent slopes | 4746 | 23680 | 100158 | 2s816 | ne089 | 1981 | 1:20000 |
Tryon loamy fine sand, frequently ponded, 0 to 3 percent slopes | 4751 | 11224 | 100159 | 2s817 | ne089 | 1981 | 1:20000 |
Ipage-Tryon complex, 0 to 3 percent slopes | 4655 | 7718 | 100108 | 2v9vs | ne089 | 1981 | 1:20000 |
Valentine-Tryon fine sands, 0 to 24 percent slopes, moist | 4888 | 5061 | 100170 | 2s812 | ne089 | 1981 | 1:20000 |
Els-Ipage-Tryon loamy sands, 0 to 6 percent slopes | 4548 | 611 | 2219624 | 2dhps | ne089 | 1981 | 1:20000 |
Els-Tryon complex, 0 to 3 percent slopes | 4563 | 7 | 2219627 | 2wgdq | ne089 | 1981 | 1:20000 |
Valentine-Tryon, complex, 0 to 24 percent slopes | 4772 | 1808 | 2668704 | 2s814 | ne091 | 1961 | 1:24000 |
Els-Tryon complex, 0 to 3 percent slopes | 4563 | 291 | 2228901 | 2dtc1 | ne093 | 1968 | 1:12000 |
Ipage-Tryon, wet, complex, silty substratum, 0 to 3 percent slopes | 4657 | 31 | 2228902 | 2dtc2 | ne093 | 1968 | 1:12000 |
Tryon loamy fine sand, rarely flooded | 4257 | 763 | 1691872 | 1tsjj | ne099 | 1982 | 1:20000 |
Tryon loamy fine sand, 0 to 3 percent slopes | 4746 | 1526 | 1699378 | 2s816 | ne113 | 1969 | 1:24000 |
Tryon-Ipage complex, 0 to 3 percent slopes | 4758 | 5465 | 1699554 | 2wgfp | ne115 | 1986 | 1:20000 |
Els-Tryon complex, 0 to 3 percent slopes | 4563 | 2137 | 1699553 | 2wgdq | ne115 | 1986 | 1:20000 |
Tryon loamy fine sand, frequently ponded, 0 to 3 percent slopes | 4751 | 1989 | 1699552 | 2s817 | ne115 | 1986 | 1:20000 |
Tryon loamy fine sand, 0 to 3 percent slopes | 4746 | 1087 | 1699551 | 2s816 | ne115 | 1986 | 1:20000 |
Valentine-Tryon, complex, 0 to 24 percent slopes | 4772 | 9716 | 1700237 | 2s814 | ne117 | 1966 | 1:31680 |
Els-Tryon complex, 0 to 3 percent slopes | 4563 | 41674 | 100260 | 2wgdq | ne149 | 1982 | 1:20000 |
Tryon loamy fine sand, 0 to 3 percent slopes | 4746 | 11491 | 100258 | 2s816 | ne149 | 1982 | 1:20000 |
Els-Ipage-Tryon loamy sands, 0 to 6 percent slopes | 4548 | 7072 | 100237 | 3c9g | ne149 | 1982 | 1:20000 |
Tryon loamy fine sand, frequently ponded, 0 to 3 percent slopes | 4751 | 4944 | 100259 | 2s817 | ne149 | 1982 | 1:20000 |
Tryon-Ipage complex, 0 to 3 percent slopes | 4758 | 9 | 2219845 | 2wgfp | ne149 | 1982 | 1:20000 |
Tryon fine sandy loam, 0 to 3 percent slopes | 4740 | 3770 | 100642 | 2s81c | ne161 | 1992 | 1:20000 |
Tryon fine sandy loam, frequently ponded | 4743 | 2052 | 100643 | 2s81d | ne161 | 1992 | 1:20000 |
Els, calcareous-Tryon complex, 0 to 3 percent slopes | 4541 | 768 | 100585 | 3cnp | ne161 | 1992 | 1:20000 |
Tryon loamy fine sand, 0 to 3 percent slopes | 4746 | 6464 | 2219889 | 2s816 | ne183 | 1984 | 1:20000 |
Tryon loamy fine sand, frequently ponded, 0 to 3 percent slopes | 4751 | 1291 | 1699858 | 2s817 | ne183 | 1984 | 1:20000 |
Valentine-Tryon fine sands, 0 to 24 percent slopes | T163E | 4622 | 1390130 | 2s813 | sd007 | 2004 | 1:20000 |
Els-Tryon complex, 0 to 3 percent slopes | T055A | 1420 | 1390060 | 2wgdq | sd007 | 2004 | 1:20000 |
Ipage-Tryon complex, 0 to 3 percent slopes | T085A | 1097 | 1390092 | 2v9vs | sd007 | 2004 | 1:20000 |
Tryon fine sandy loam, frequently ponded | T141A | 273 | 1390115 | 2s81d | sd007 | 2004 | 1:20000 |
Tryon fine sandy loam, 0 to 3 percent slopes | T140A | 252 | 1390114 | 2s81c | sd007 | 2004 | 1:20000 |
Valentine-Tryon fine sands, 0 to 24 percent slopes | T163E | 947 | 1391998 | 2s813 | sd121 | 1967 | 1:31680 |
Els-Tryon complex, 0 to 3 percent slopes | T055A | 723 | 1391548 | 2wgdq | sd121 | 1967 | 1:31680 |
Ipage-Tryon complex, 0 to 3 percent slopes | T085A | 572 | 1391561 | 2v9vs | sd121 | 1967 | 1:31680 |
Tryon fine sandy loam, 0 to 3 percent slopes | T140A | 135 | 1391986 | 2s81c | sd121 | 1967 | 1:31680 |
Tryon fine sandy loam, frequently ponded | T141A | 27 | 1391987 | 2s81d | sd121 | 1967 | 1:31680 |
Valentine-Tryon fine sands, 0 to 24 percent slopes | T163E | 370 | 2582795 | 2s813 | sd613 | 2011 | 1:24000 |
Els-Tryon complex, 0 to 3 percent slopes | T055A | 303 | 2582764 | 2wgdq | sd613 | 2011 | 1:24000 |
Ipage-Tryon complex, 0 to 3 percent slopes | T085A | 252 | 2582777 | 2v9vs | sd613 | 2011 | 1:24000 |
Tryon fine sandy loam, frequently ponded | T141A | 14 | 2582787 | 2s81d | sd613 | 2011 | 1:24000 |
Tryon fine sandy loam, 0 to 3 percent slopes | T140A | 10 | 2582786 | 2s81c | sd613 | 2011 | 1:24000 |