Official Series Description


Lab Data Summary

Aggregate lab data for the TIVOLI soil series. This aggregation is based on all pedons with a current taxon name of TIVOLI, and applied along 1-cm thick depth slices. Solid lines are the slice-wise median, bounded on either side by the interval defined by the slice-wise 5th and 95th percentiles. The median is the value that splits the data in half. Five percent of the data are less than the 5th percentile, and five percent of the data are greater than the 95th percentile. Values along the right hand side y-axis describe the proportion of pedon data that contribute to aggregate values at this depth. For example, a value of "90%" at 25cm means that 90% of the pedons correlated to TIVOLI were used in the calculation. Source: KSSL snapshot . Methods used to assemble the KSSL snapshot used by SoilWeb / SDE

Click the image to view it full size.

Pedons used in the lab summary:

MLRALab IDPedon IDTaxonnameCINSSL / NASIS ReportsLink To SoilWeb GMap
77C40A449858TX115001TIVOLI3Primary | Supplementary | Taxonomy | Pedon | Water Retention | Correlation | Andic Soil Properties32.7988892,-102.1633301
77C40A465475TX017008TIVOLI3Primary | Supplementary | Taxonomy | Pedon | Water Retention | Correlation | Andic Soil Properties34.1528816,-102.9054718
78C88P074388OK059001ATivoli7Primary | Supplementary | Taxonomy | Pedon | Water Retention | Correlation | Andic Soil Properties36.6138878,-99.5805588
78C88P074488OK059001BTivoli7Primary | Supplementary | Taxonomy | Pedon | Water Retention | Correlation | Andic Soil Properties36.6155548,-99.5805588
7940A020063KS057003Tivoli6Primary | Supplementary | Taxonomy | Pedon | Water Retention | Correlation | Andic Soil Properties37.6402779,-99.5933304
7940A186563KS057004Tivoli6Primary | Supplementary | Taxonomy | Pedon | Water Retention | Correlation | Andic Soil Properties37.6630554,-99.5811081
7940A1809S1959KS155001TIVOLI6Primary | Supplementary | Taxonomy | Pedon | Water Retention | Correlation | Andic Soil Properties38.1566658,-98.4349976
7940A1810S1959KS155002TIVOLI6Primary | Supplementary | Taxonomy | Pedon | Water Retention | Correlation | Andic Soil Properties38.1008759,-98.4359131
80A76-OK-27-2576-OK053-27-25Tivoli4Primary | Supplementary | Taxonomy | Pedon | Water Retention | Correlation | Andic Soil Properties36.7711528,-98.109675

Water Balance

Monthly water balance estimated using a leaky-bucket style model for the TIVOLI soil series. Monthly precipitation (PPT) and potential evapotranspiration (PET) have been estimated from the 50th percentile of gridded values (PRISM 1981-2010) overlapping with the extent of SSURGO map units containing each series as a major component. Monthly PET values were estimated using the method of Thornthwaite (1948). These (and other) climatic parameters are calculated with each SSURGO refresh and provided by the fetchOSD function of the soilDB package. Representative water storage values (“AWC” in the figures) were derived from SSURGO by taking the 50th percentile of profile-total water storage (sum[awc_r * horizon thickness]) for each soil series. Note that this representation of “water storage” is based on the average ability of most plants to extract soil water between 15 bar (“permanent wilting point”) and 1/3 bar (“field capacity”) matric potential. Soil moisture state can be roughly interpreted as “dry” when storage is depleted, “moist” when storage is between 0mm and AWC, and “wet” when there is a surplus. Clearly there are a lot of assumptions baked into this kind of monthly water balance. This is still a work in progress.

Click the image to view it full size.


Click the image to view it full size.

Sibling Summary

Siblings are those soil series that occur together in map units, in this case with the TIVOLI series. Sketches are arranged according to their subgroup-level taxonomic structure. Source: SSURGO snapshot , parsed OSD records and snapshot of SC database .

Click the image to view it full size.

Select annual climate data summaries for the TIVOLI series and siblings. Series are sorted according to hierarchical clustering of median values. Source: SSURGO map unit geometry and 1981-2010, 800m PRISM data .

Click the image to view it full size.

Geomorphic description summaries for the TIVOLI series and siblings. Series are sorted according to hierarchical clustering of proportions and relative hydrologic position within an idealized landform (e.g. top to bottom). Most soil series (SSURGO components) are associated with a hillslope position and one or more landform-specific positions: hills, mountain slopes, terraces, and/or flats. Proportions can be interpreted as an aggregate representation of geomorphic membership. The values printed to the left (number of component records) and right (Shannon entropy) of stacked bars can be used to judge the reliability of trends. Small Shannon entropy values suggest relatively consistent geomorphic association, while larger values suggest lack thereof. Source: SSURGO component records .

Click the image to view it full size.

Click the image to view it full size.

There are insufficient data to create the 3D mountains figure.

Click the image to view it full size.

Click the image to view it full size.

Competing Series

Soil series competing with TIVOLI share the same family level classification in Soil Taxonomy. Source: parsed OSD records and snapshot of the SC database .

Click the image to view it full size.

Select annual climate data summaries for the TIVOLI series and competing. Series are sorted according to hierarchical clustering of median values. Source: SSURGO map unit geometry and 1981-2010, 800m PRISM data .

Click the image to view it full size.

Geomorphic description summaries for the TIVOLI series and competing. Series are sorted according to hierarchical clustering of proportions and relative hydrologic position within an idealized landform (e.g. top to bottom). Proportions can be interpreted as an aggregate representation of geomorphic membership. Most soil series (SSURGO components) are associated with a hillslope position and one or more landform-specific positions: hills, mountain slopes, terraces, and/or flats. The values printed to the left (number of component records) and right (Shannon entropy) of stacked bars can be used to judge the reliability of trends. Shannon entropy values close to 0 represent soil series with relatively consistent geomorphic association, while values close to 1 suggest lack thereof. Source: SSURGO component records .

Click the image to view it full size.

There are insufficient data to create the 3D hills figure.

There are insufficient data to create the 3D mountains figure.

Click the image to view it full size.

Click the image to view it full size.

Soil series sharing subgroup-level classification with TIVOLI, arranged according to family differentiae. Hovering over a series name will print full classification and a small sketch from the OSD. Source: snapshot of SC database .

Block Diagrams

Click a link below to display the diagram. Note that these diagrams may be from multiple survey areas.

  1. CO-2011-05-27-16 | Prowers County - 1966

    Main soils and underlying materials in soil association 5 (Soil Survey of Prowers County, Colorado; 1966).

  2. CO-2011-05-27-19 | Prowers County - 1966

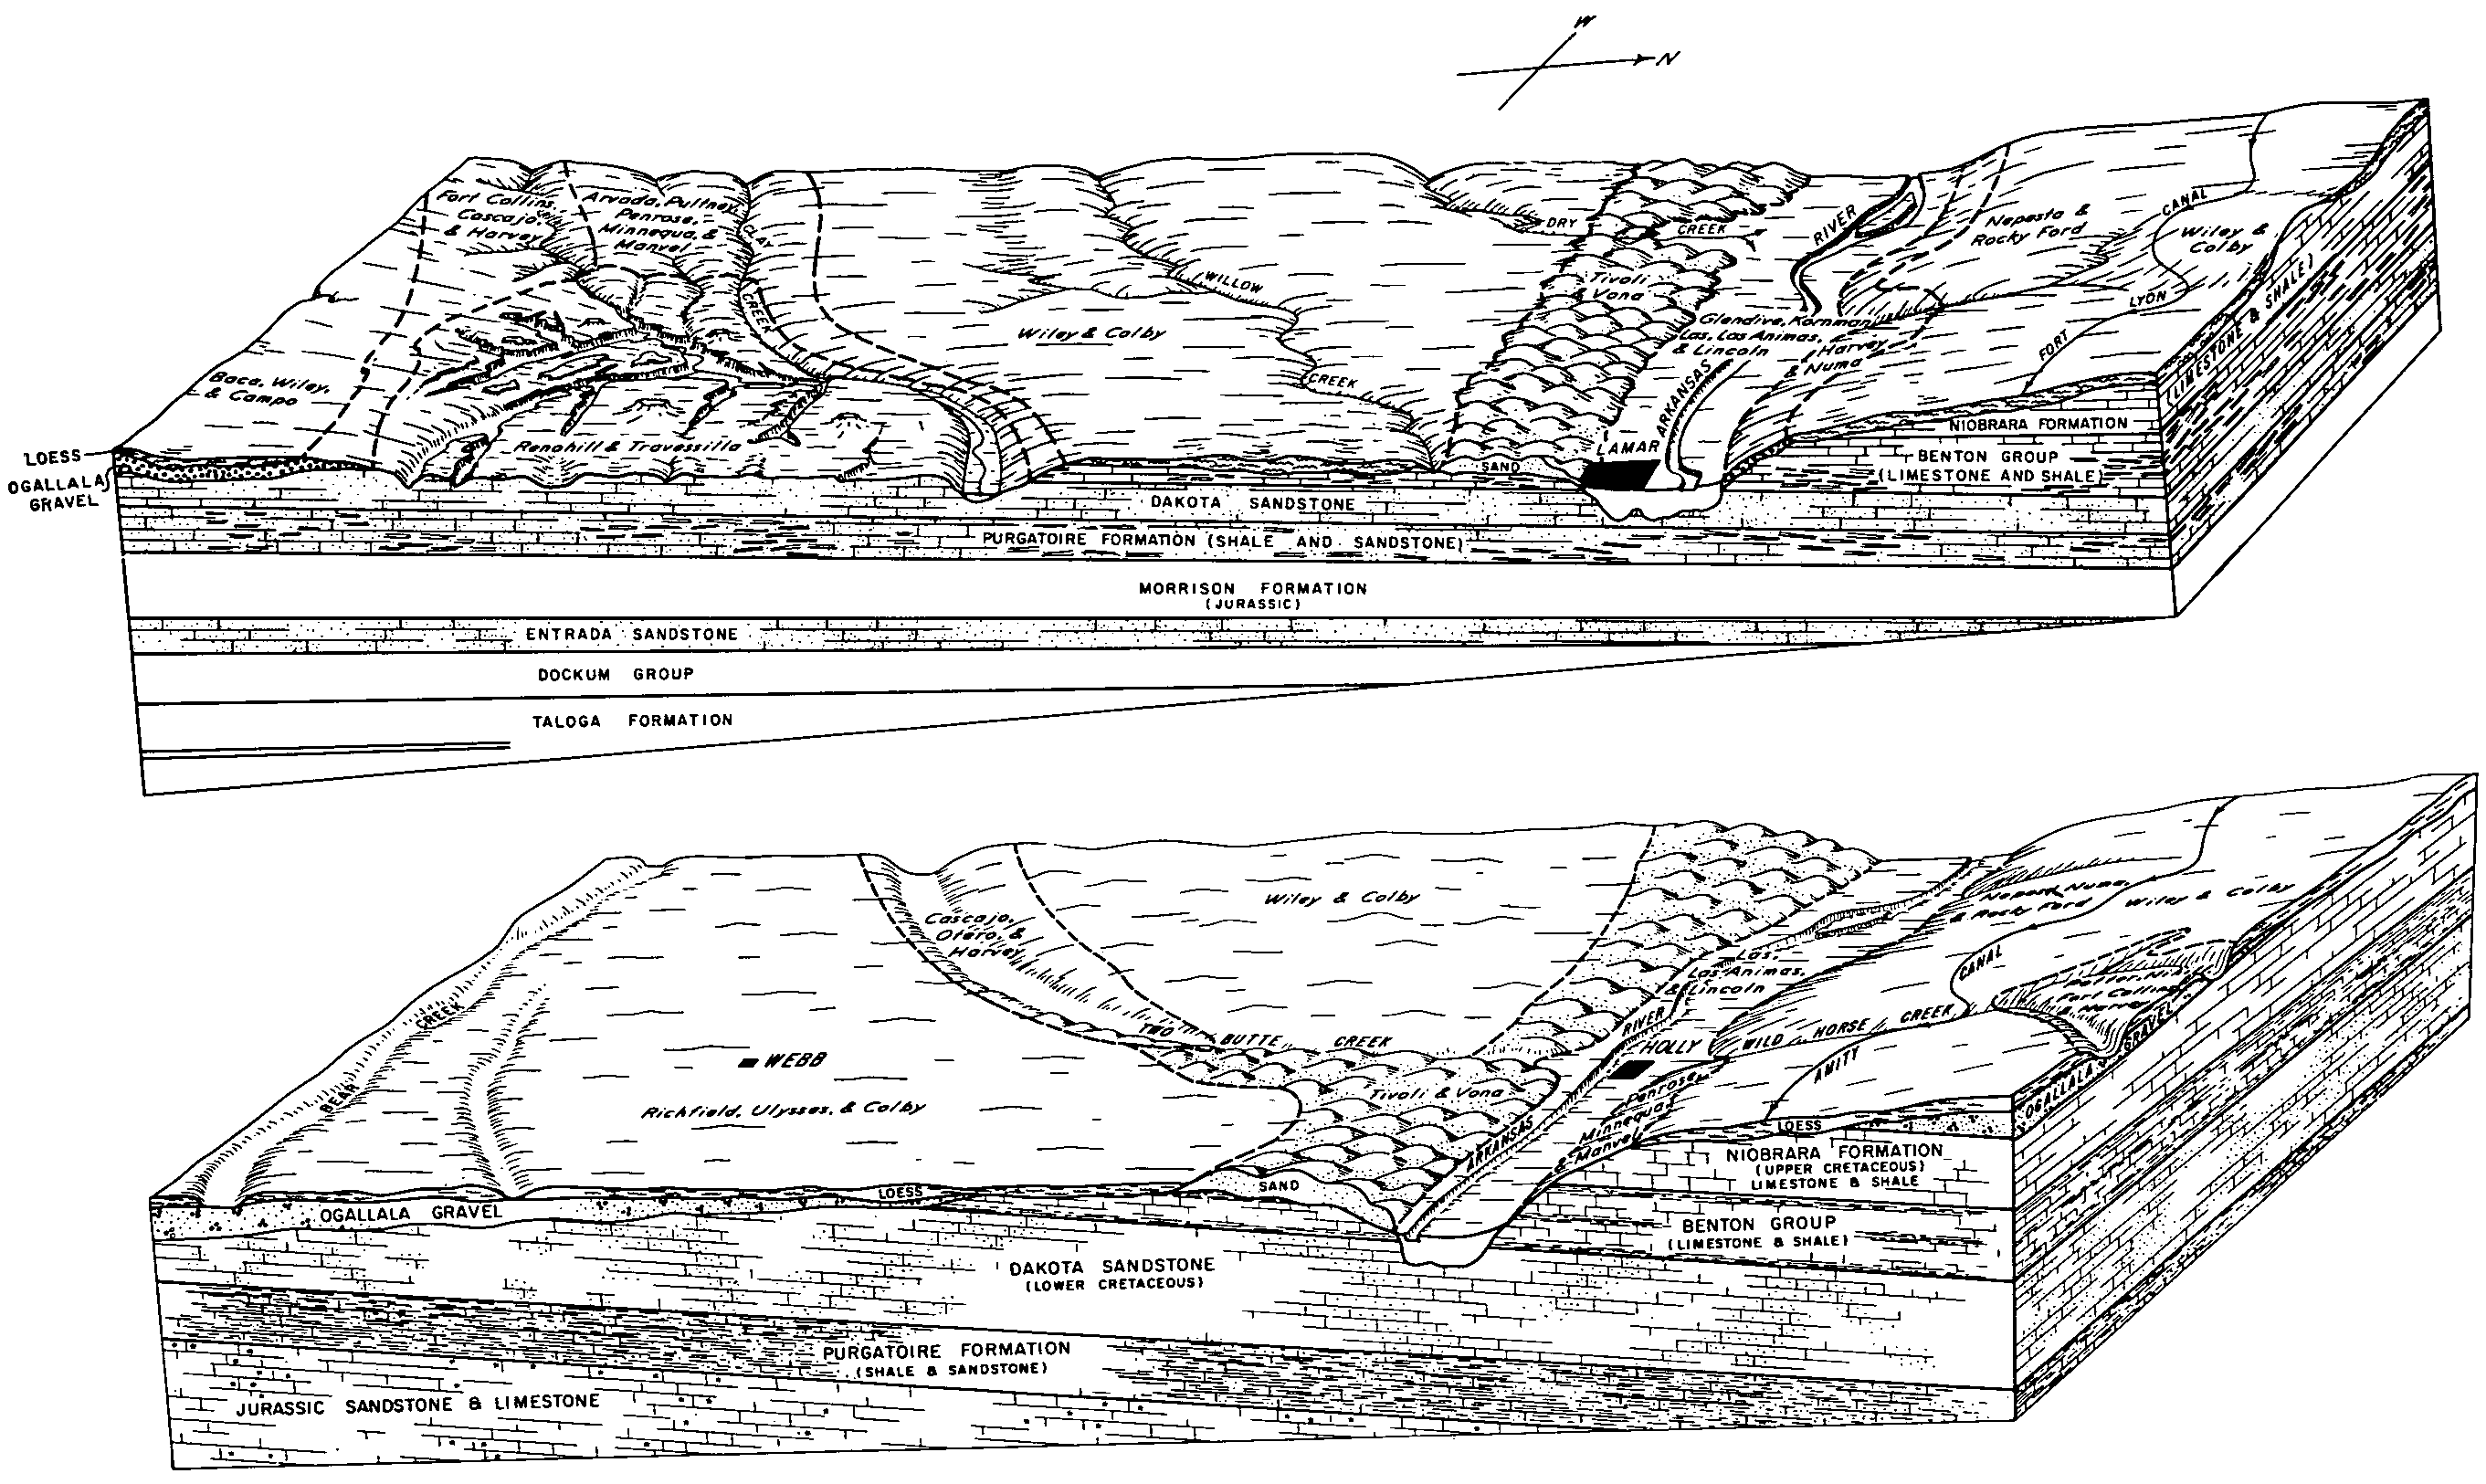
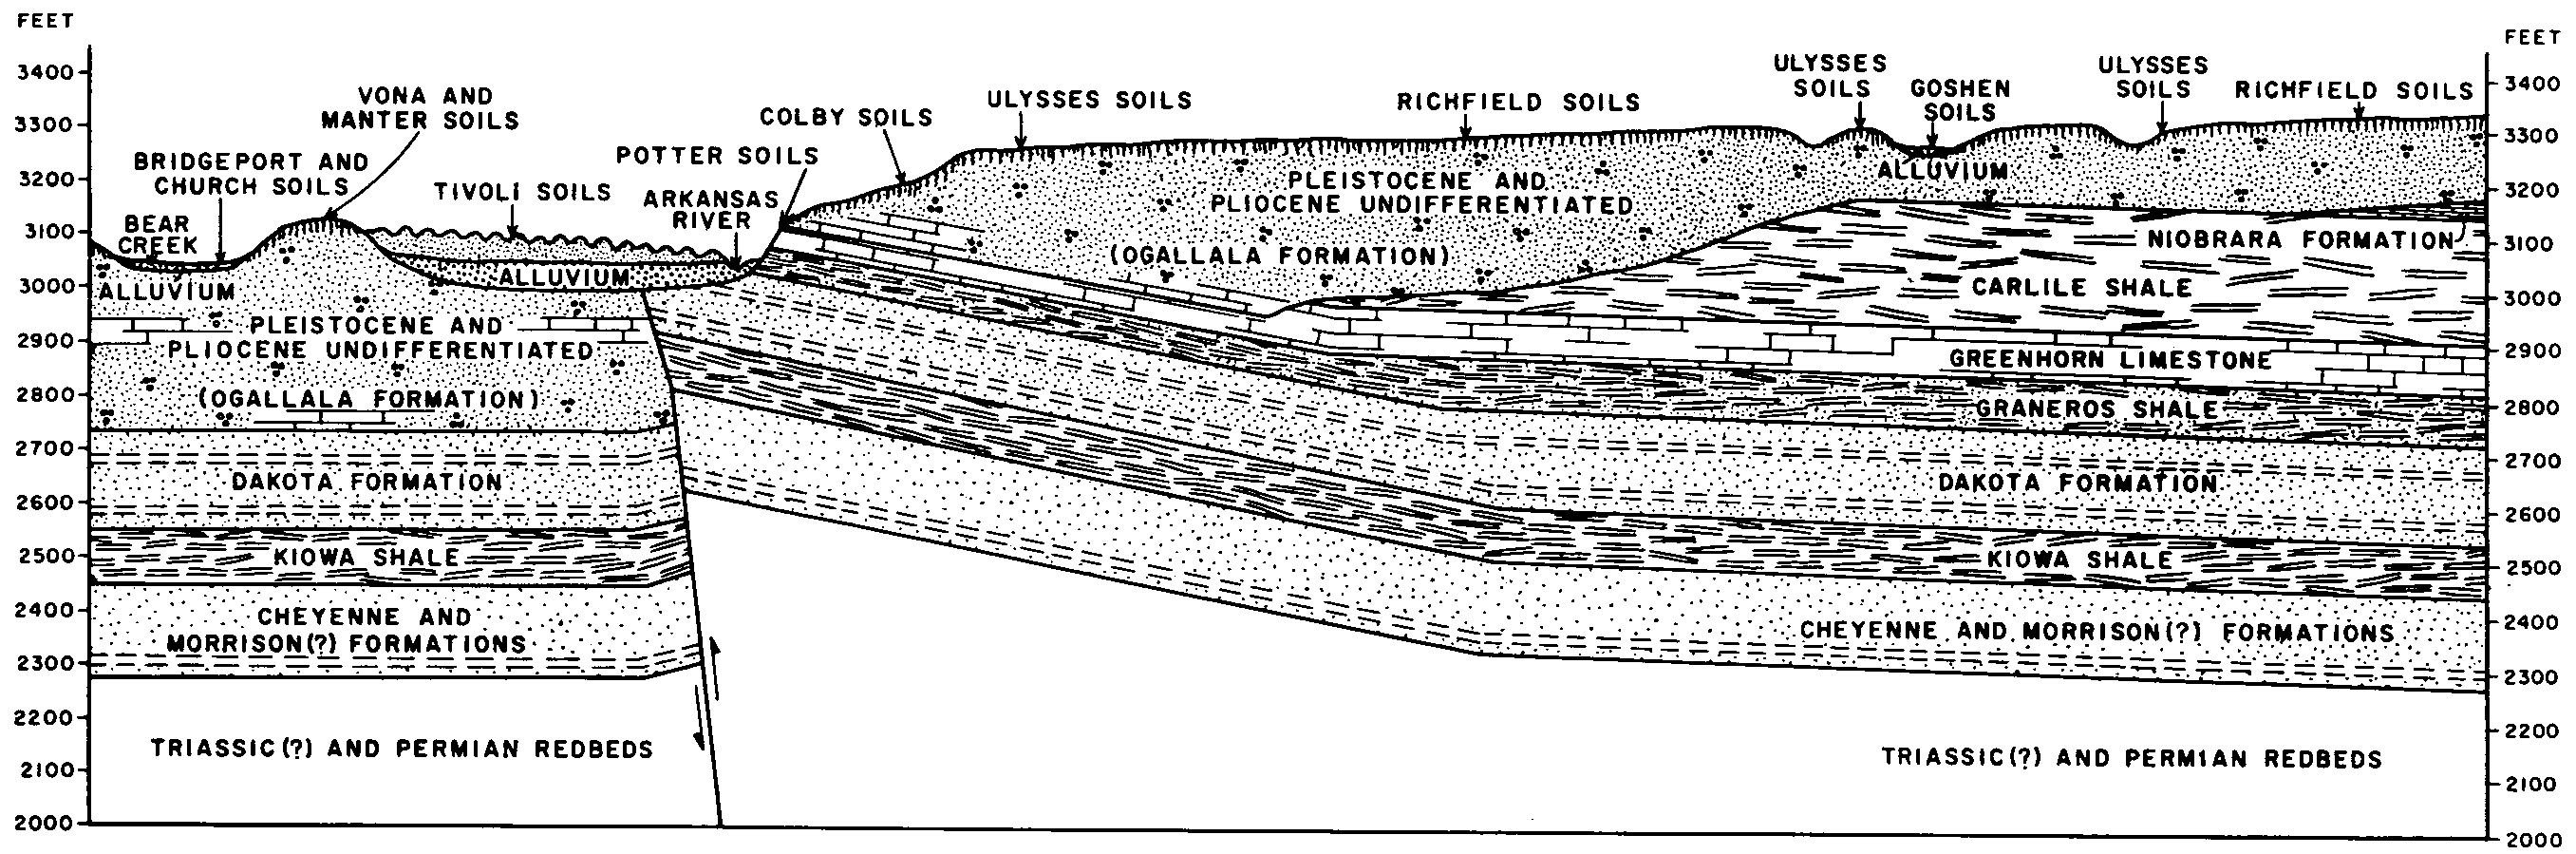
    Cross sections showing relationships of the soils to the landscape and to the underlying geologic formations in Prowers County. The upper cross section shows relationships in the western part of the county, and the lower shows those in the eastern part of the county (Soil Survey of Prowers County, Colorado; 1966).

  3. KS-2012-01-20-26 | Clark County - December 1982

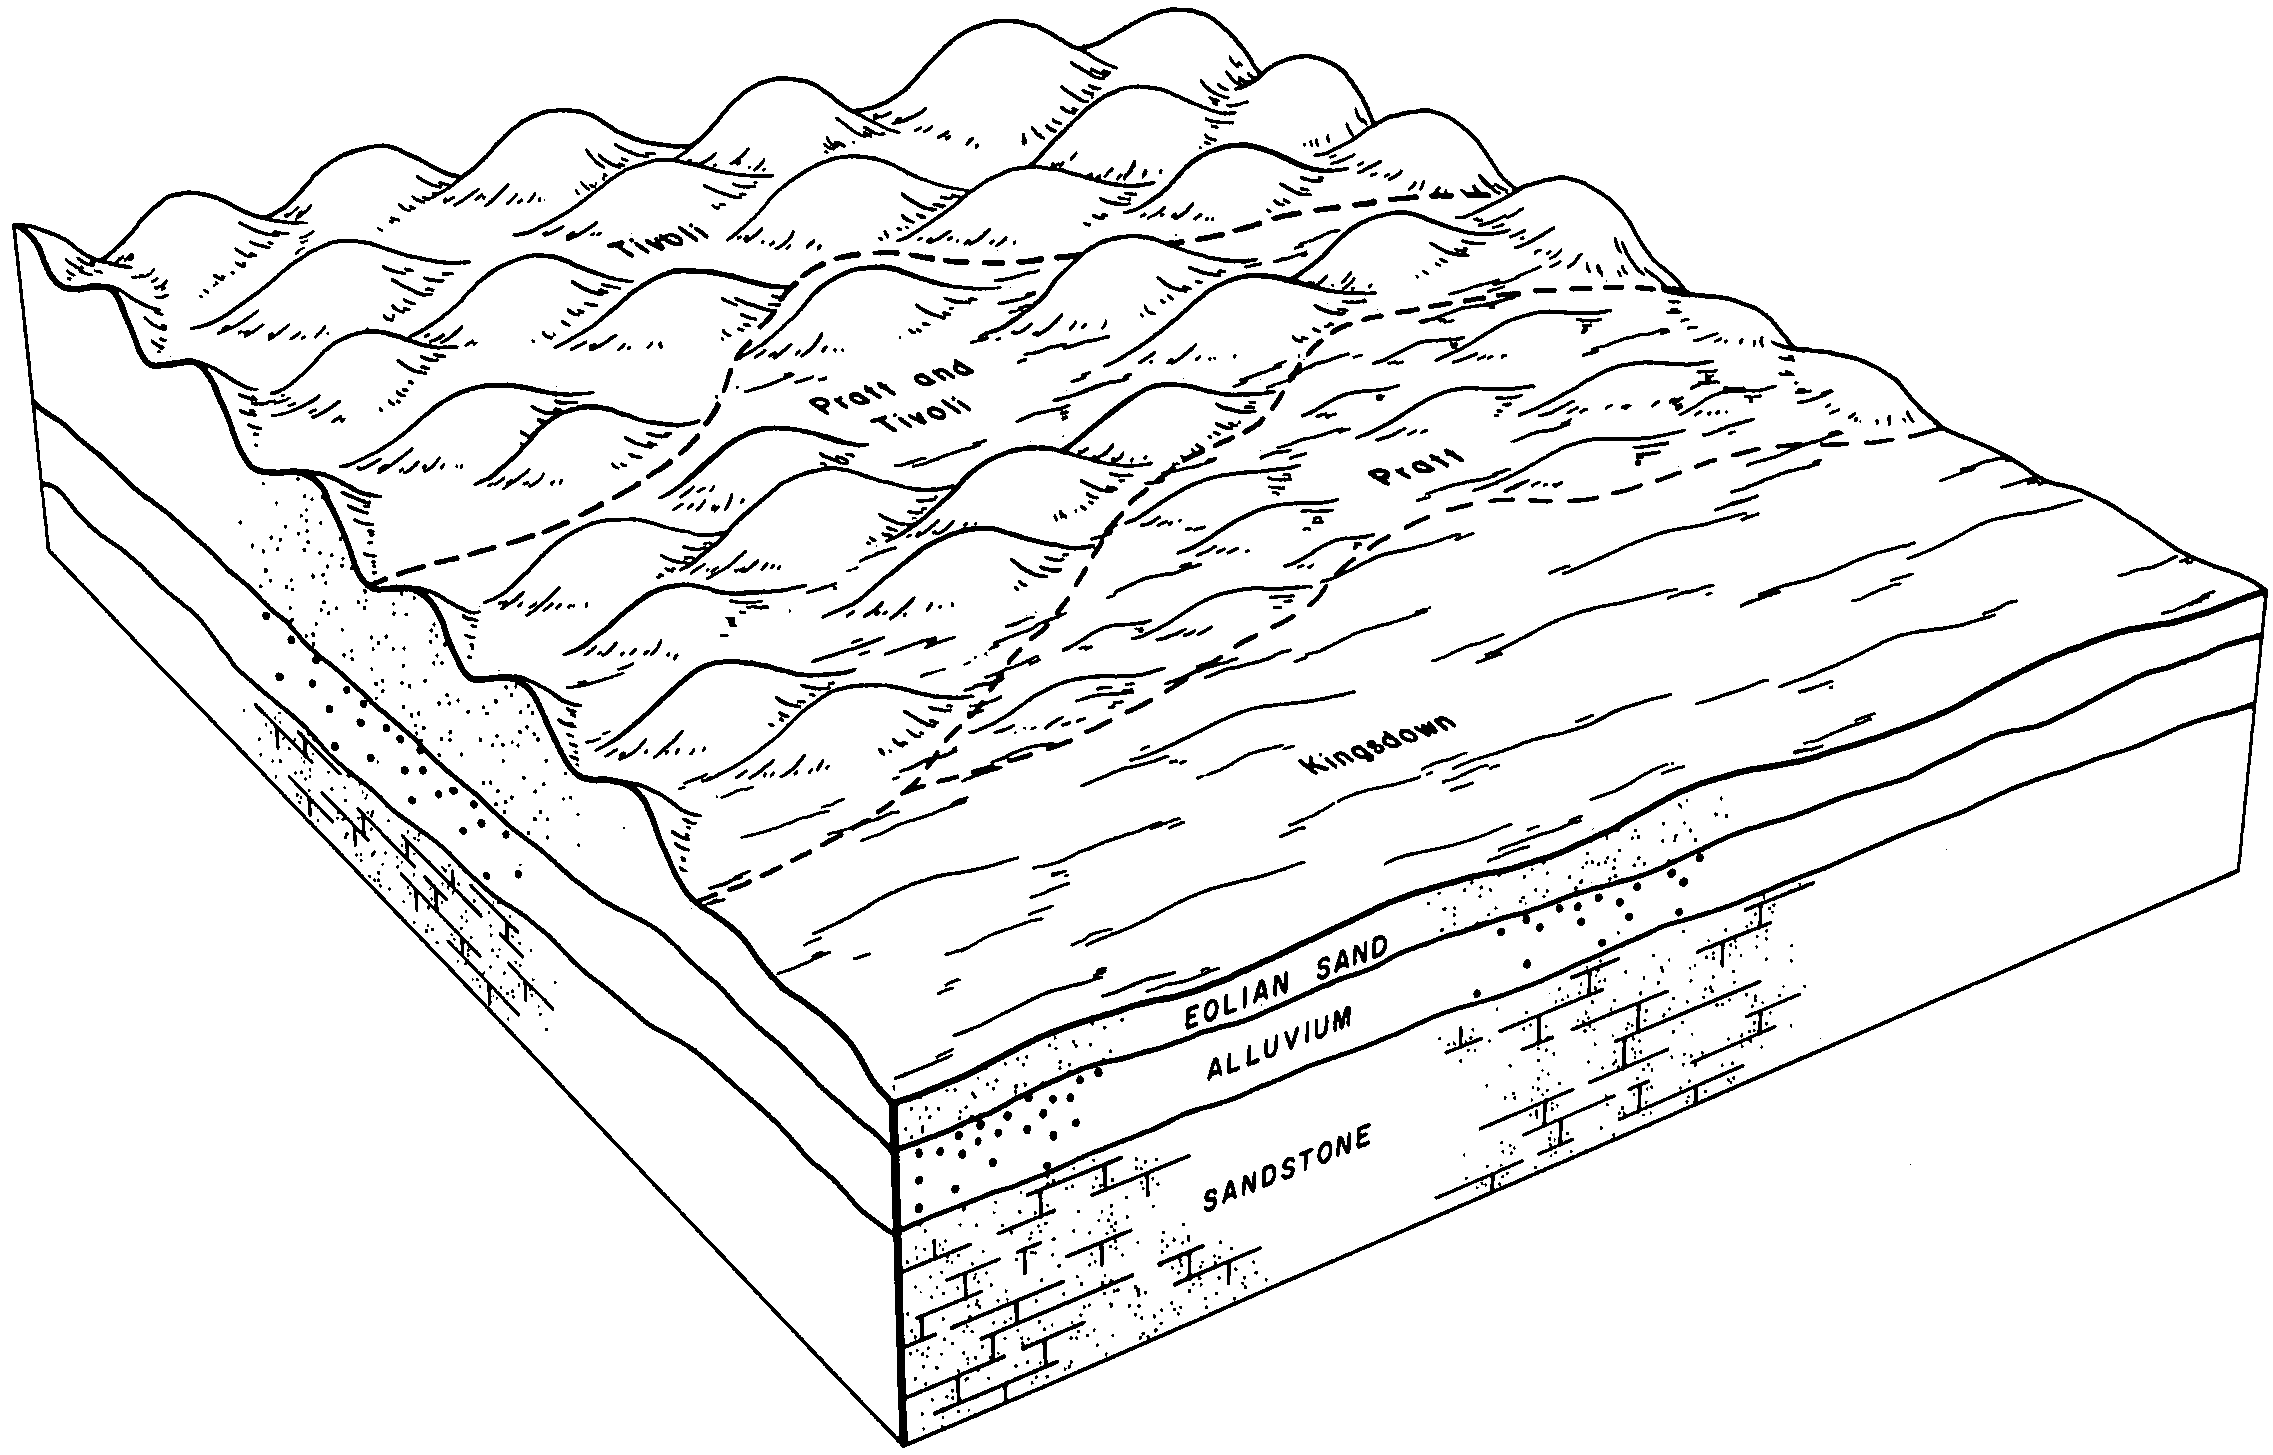
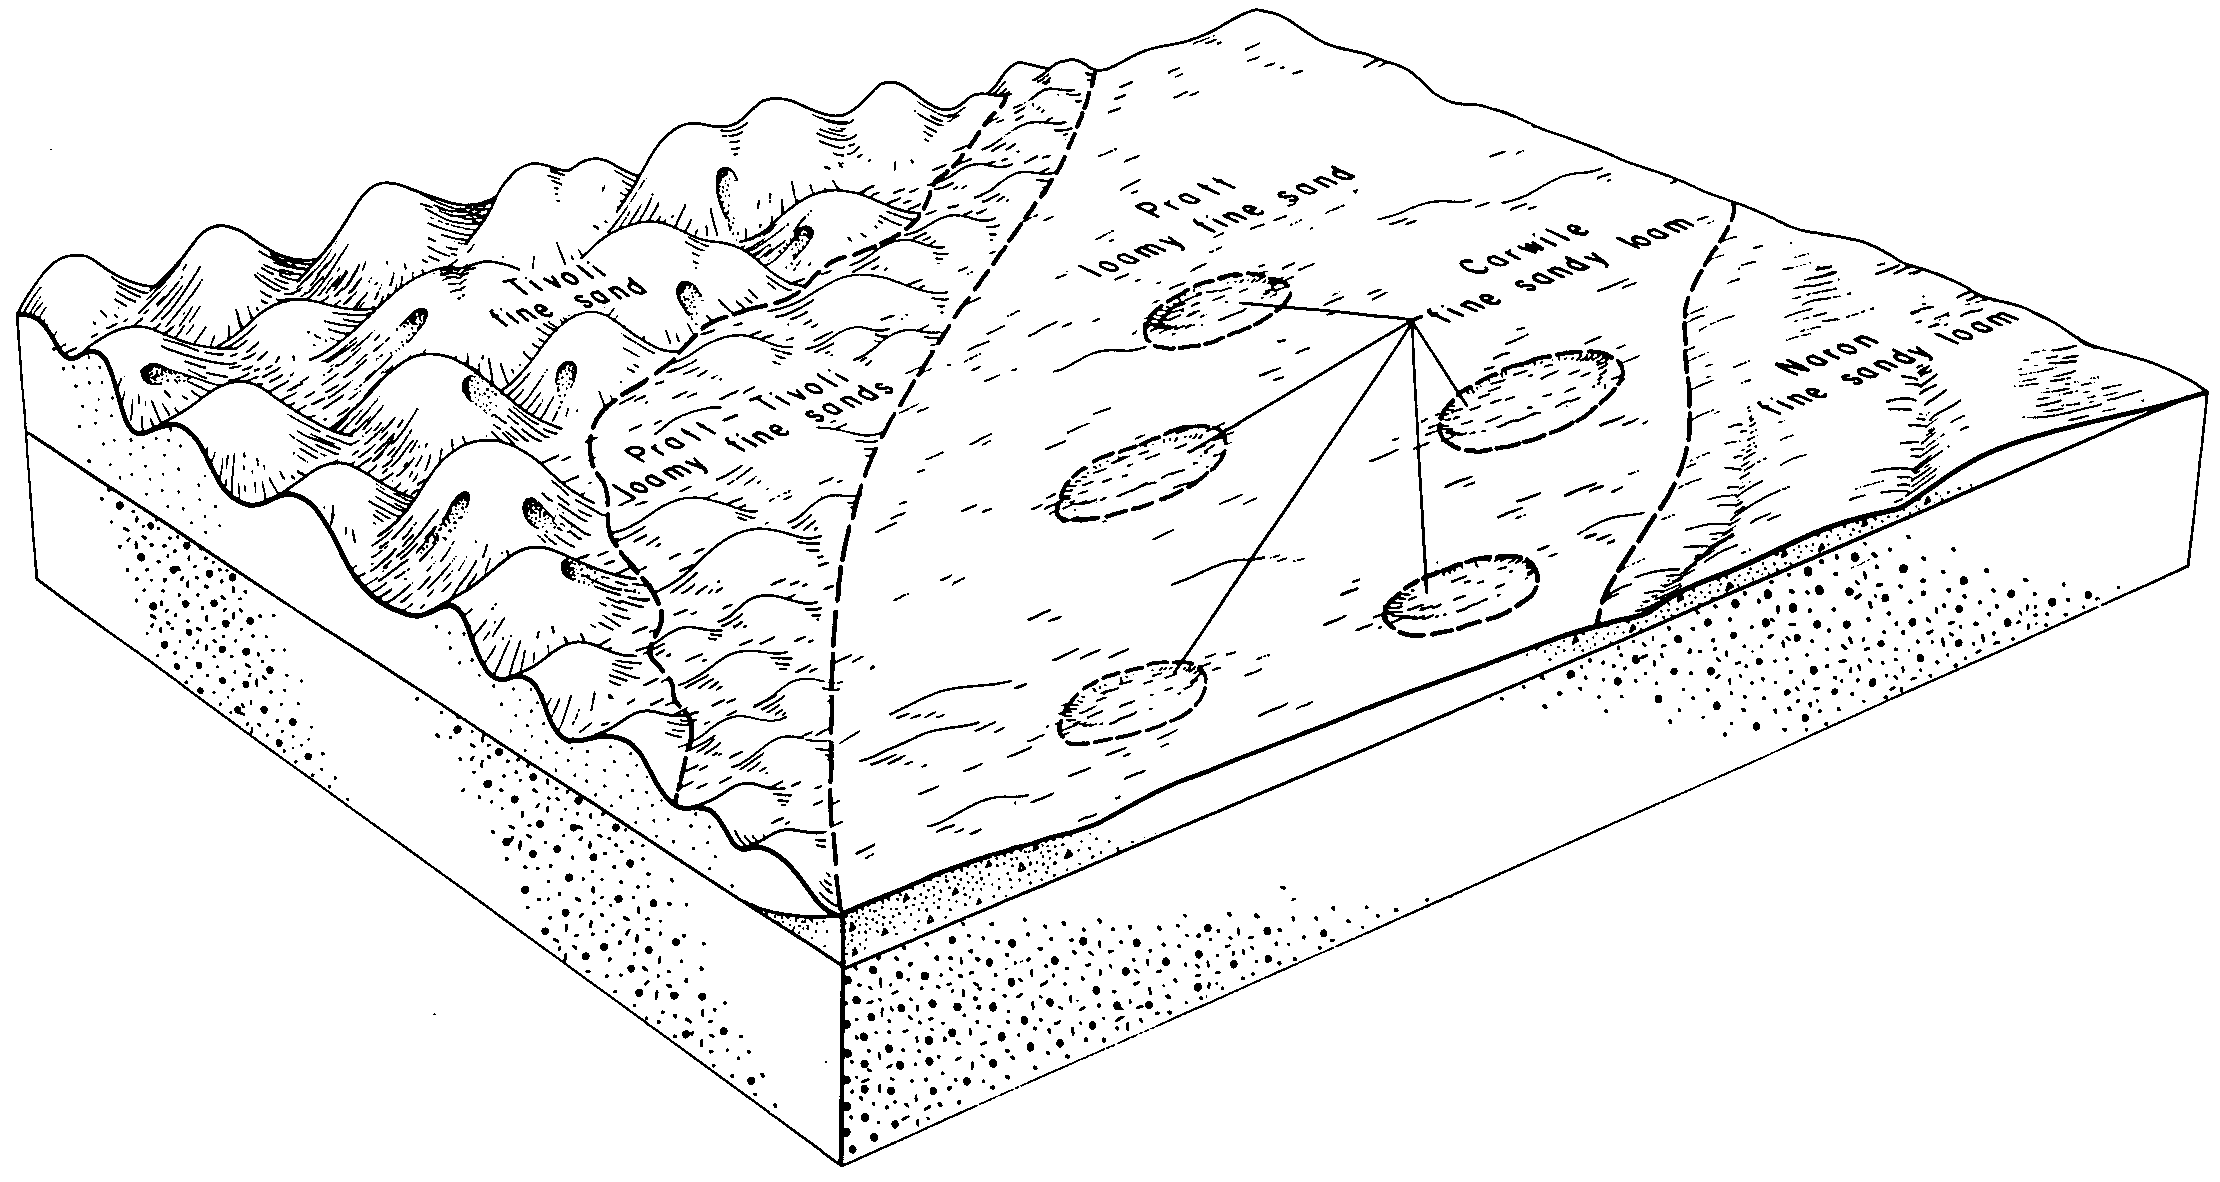
    Typical pattern of soils in the Pratt-Tivoli-Kingsdown association (Soil Survey of Clark County, Kansas; 1982).

  4. KS-2012-01-20-49 | Edwards County - September 1973

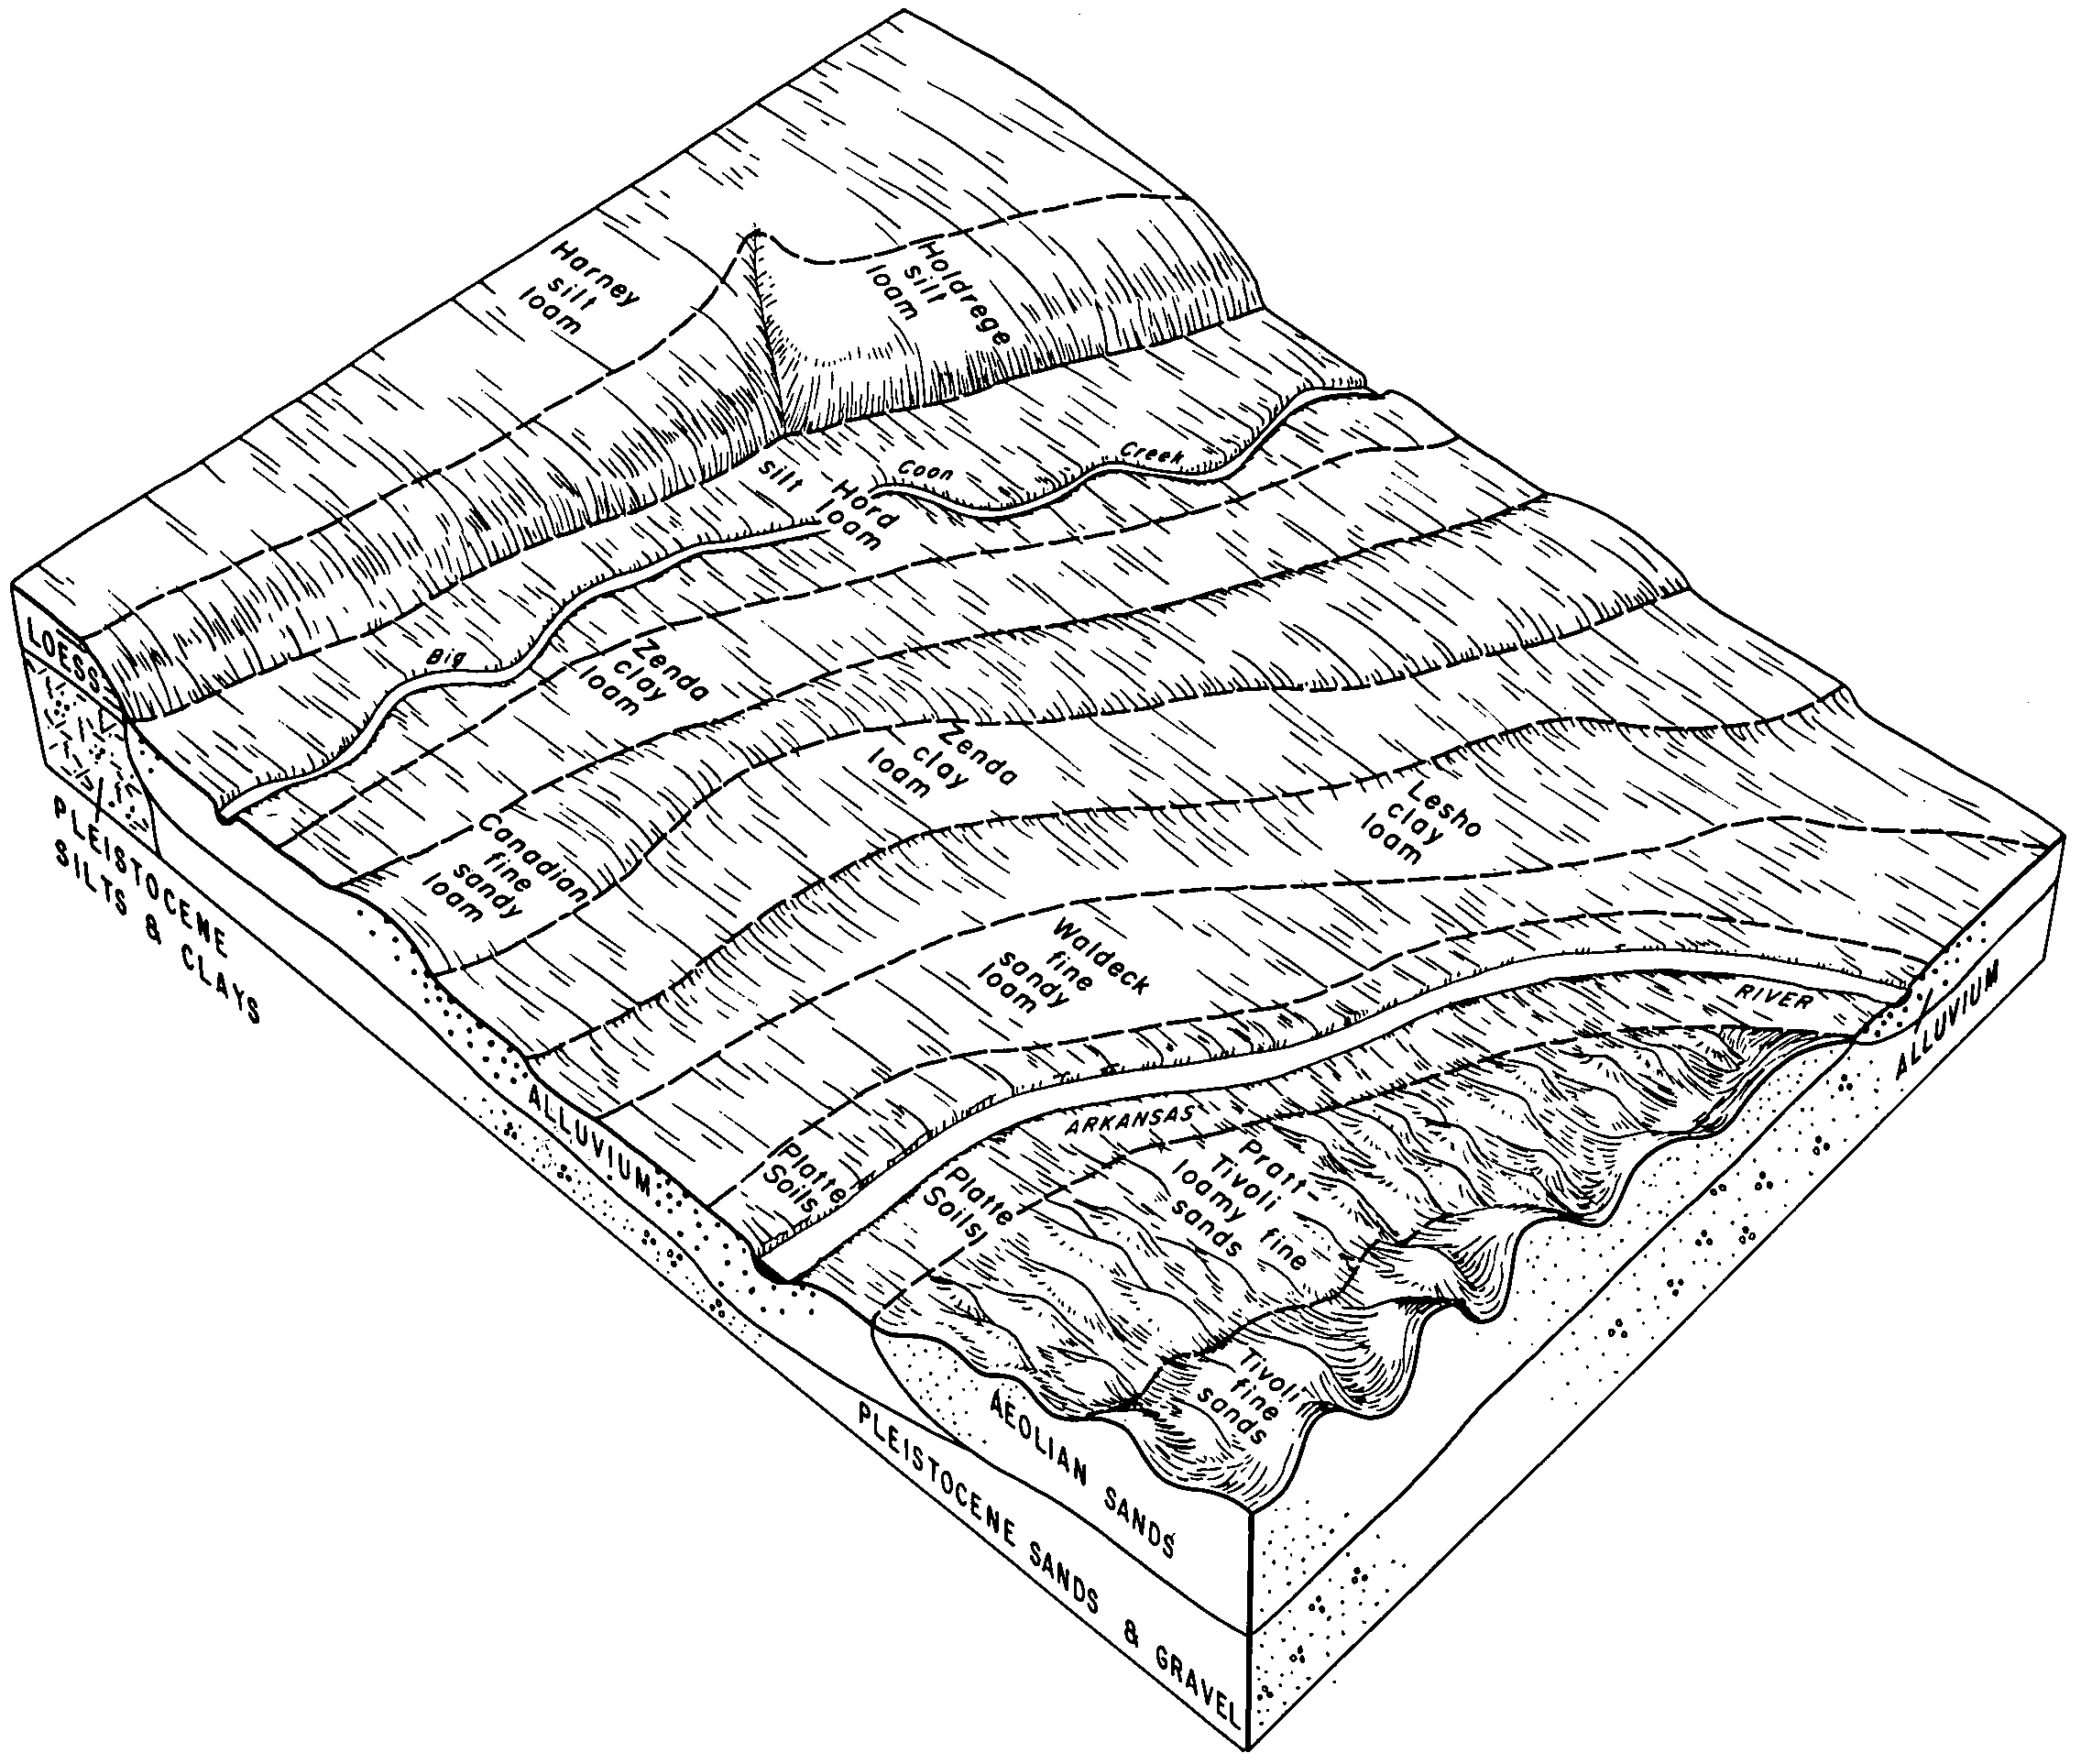
    Pattern of soils in associations 1, 3, and 7. Association 1 is to the left of Big Coon Creek. Association 7 extends from Big Coon Creek to the Arkansas River. Association 3 is to the right of the Arkansas River (Soil Survey of Edwards County, Kansas; 1973).

  5. KS-2012-01-23-02 | Finney County - November 1965

    Typical cross section of the valley of the Arkansas River (Soil Survey of Finney County, Kansas; 1965).

  6. KS-2012-01-23-04 | Finney County - November 1965

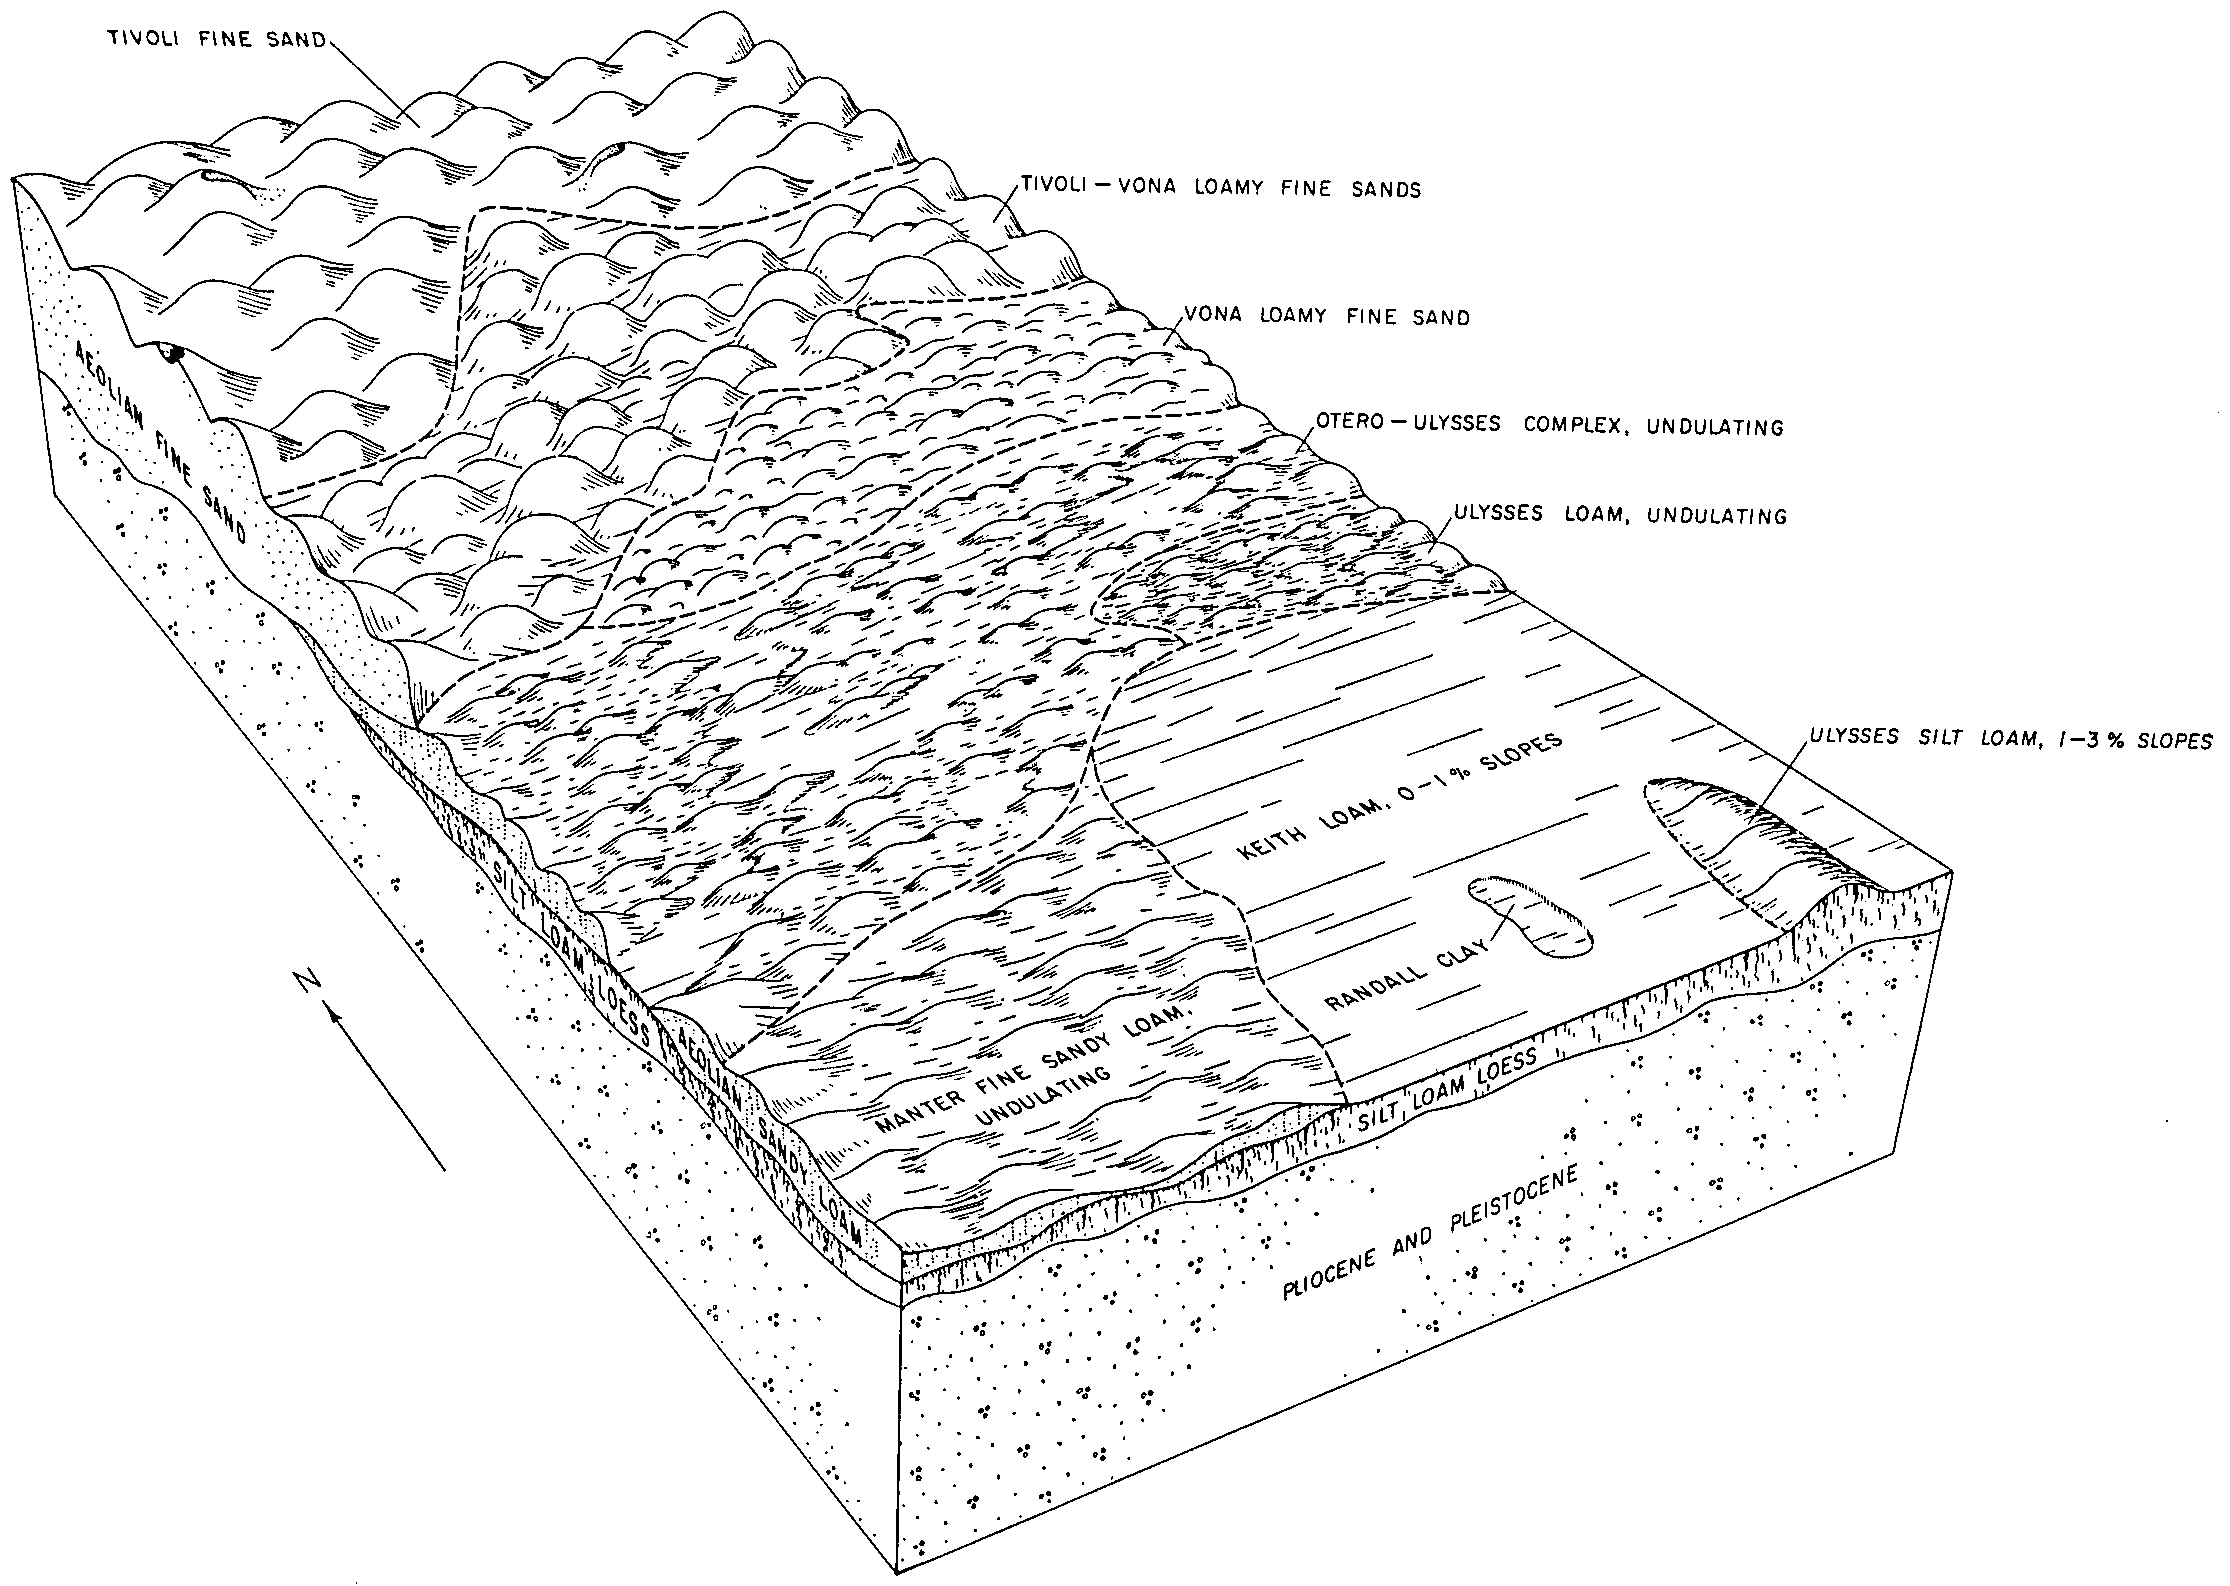
    Typical cross section of the Manter-Keith association (Soil Survey of Finney County, Kansas; 1965).

  7. KS-2012-01-23-05 | Ford County - August 1965

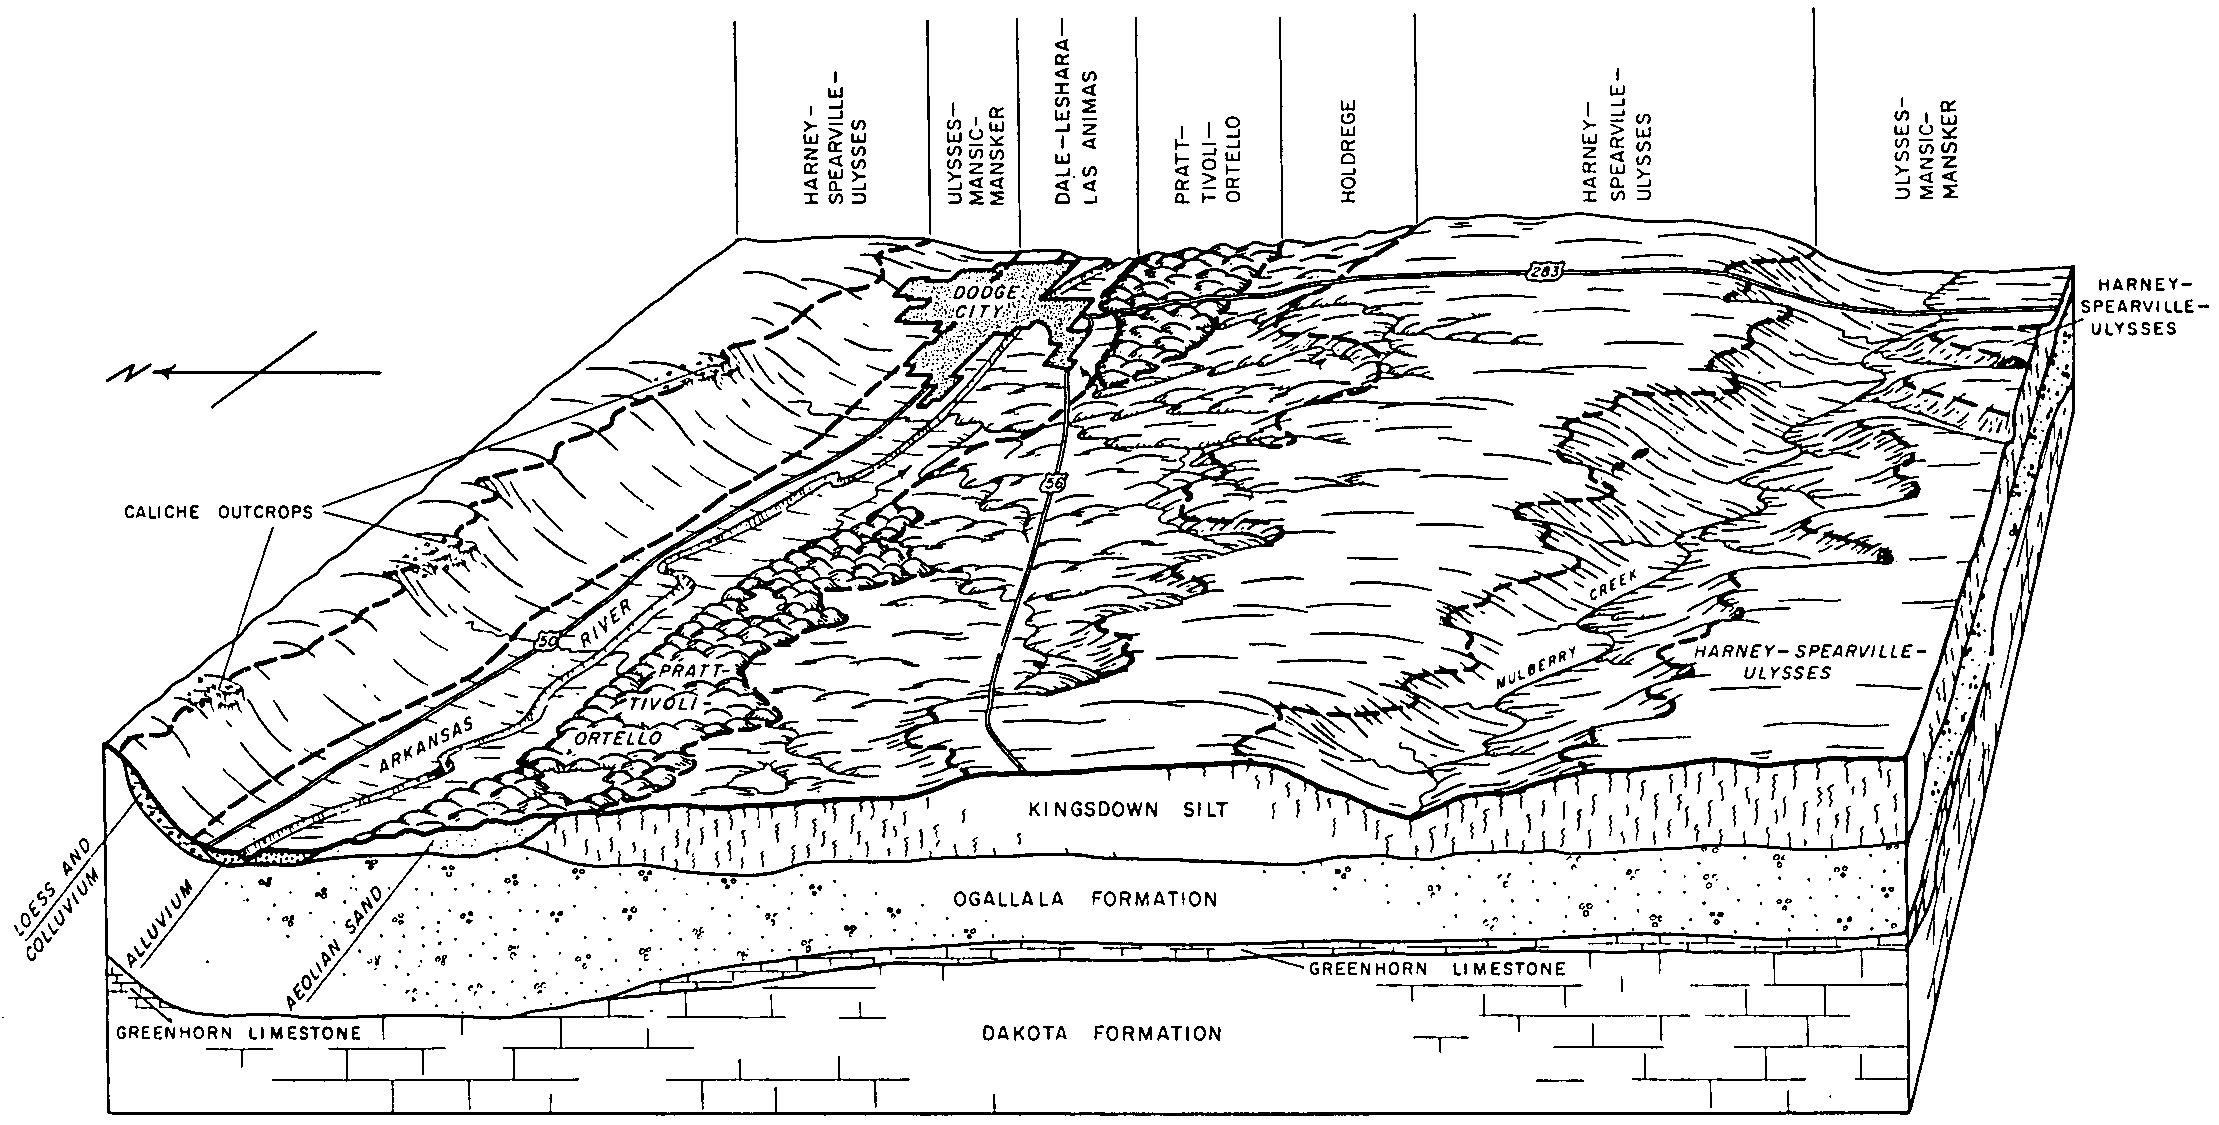
    A geologic cross section west of Dodge City showing the major soil associations in Ford County (Soil Survey of Ford County, Kansas; 1965).

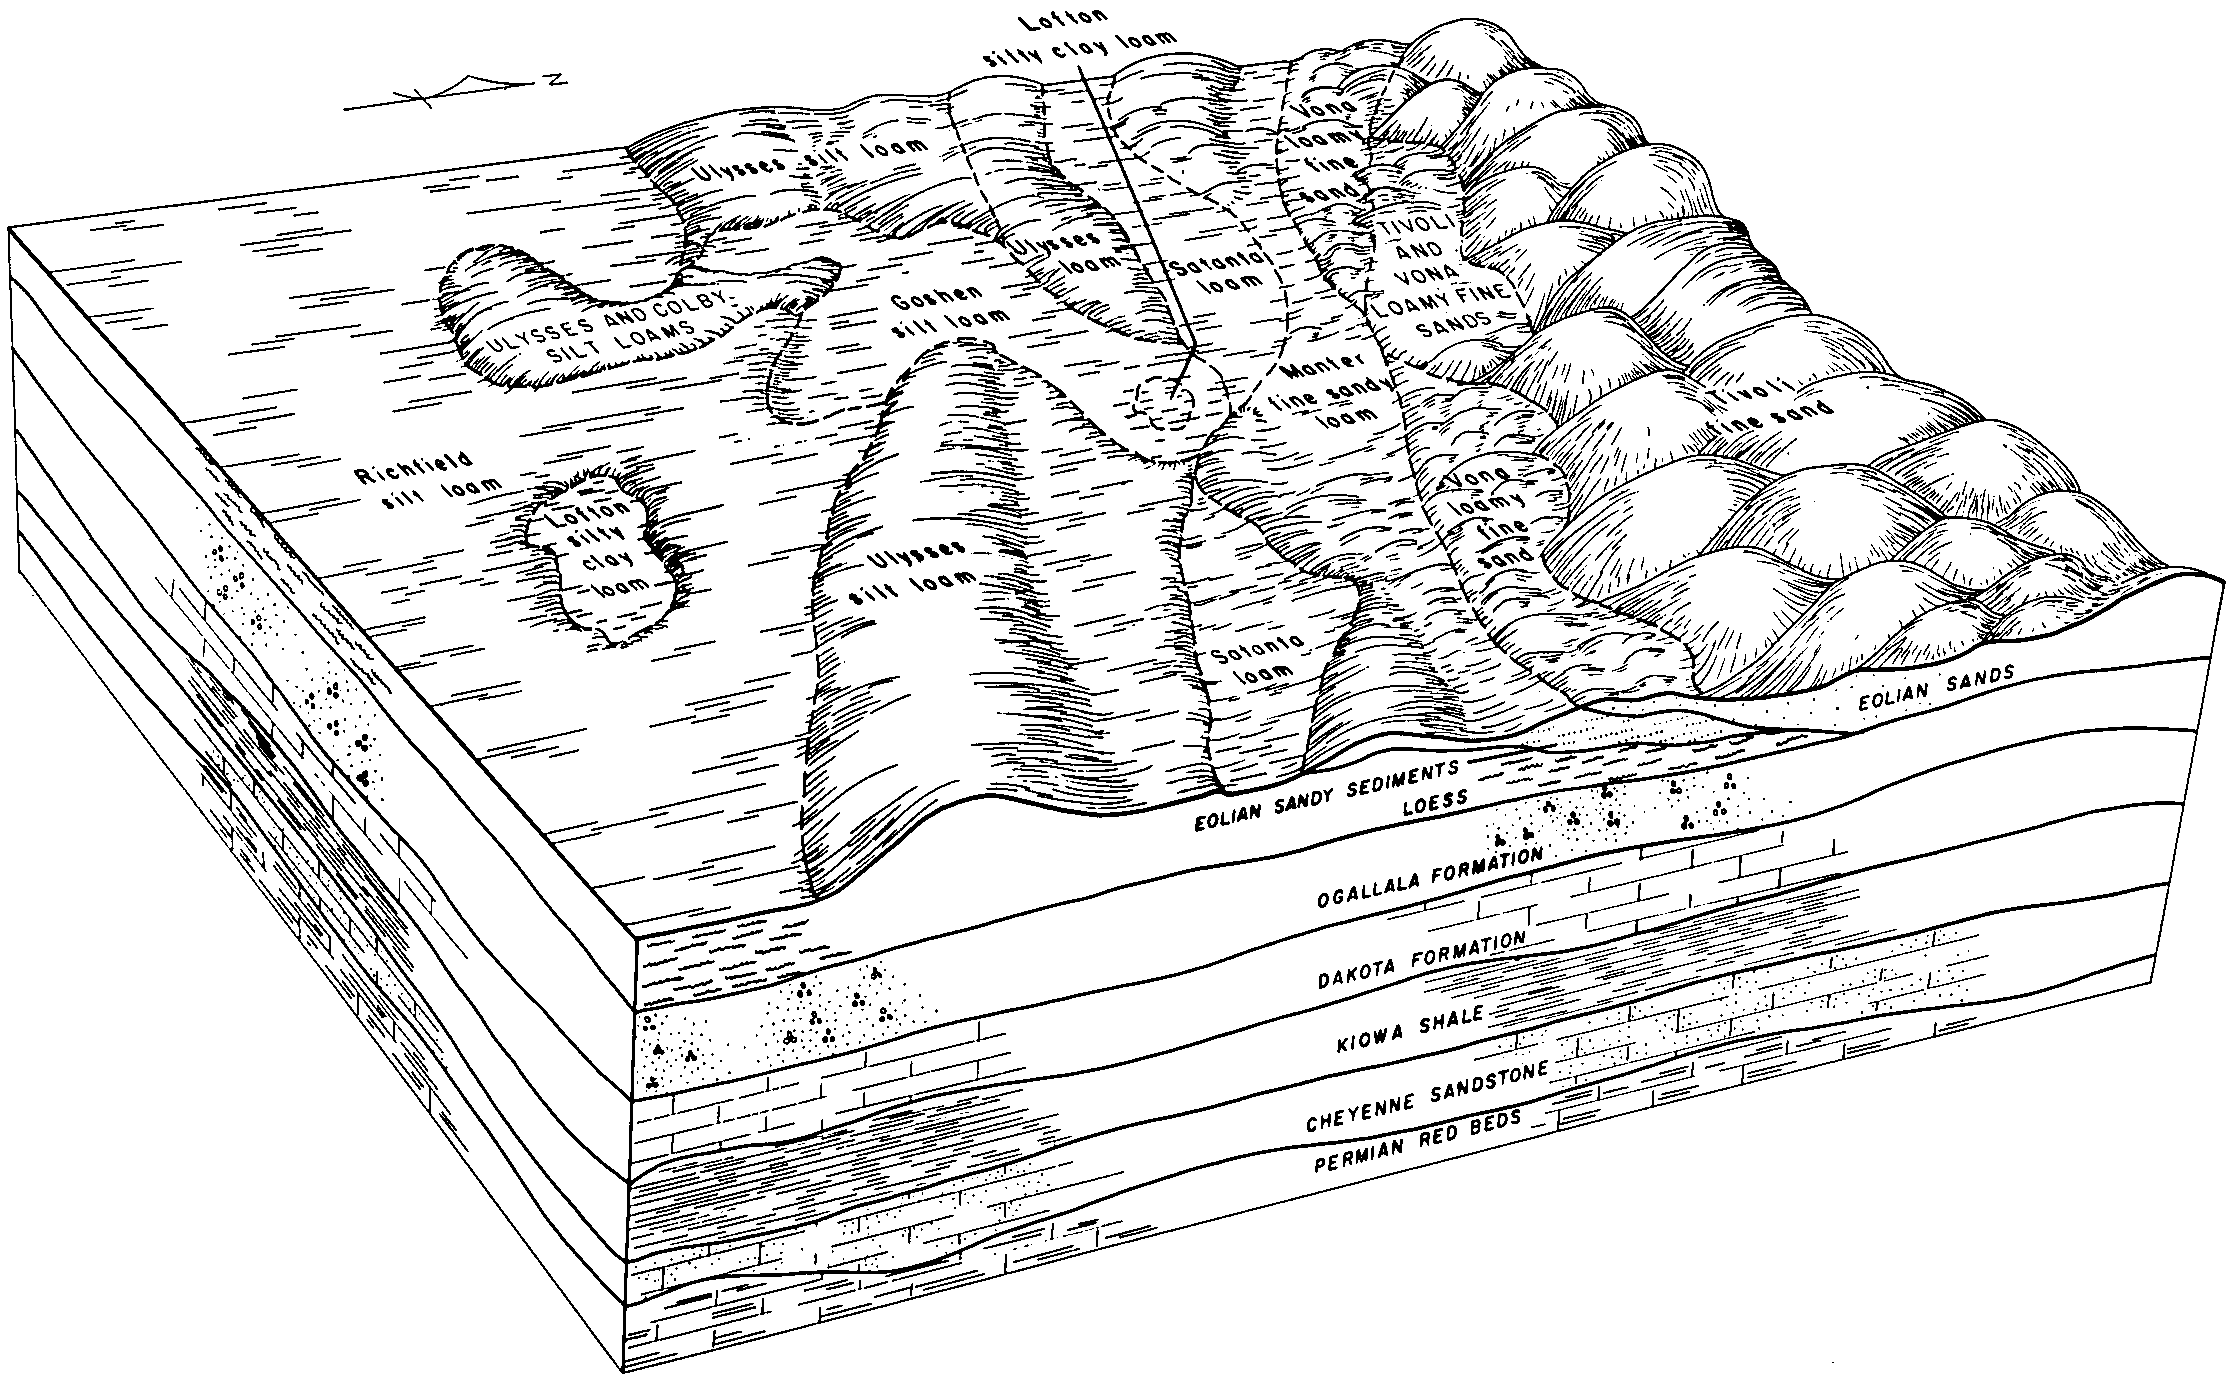
  8. KS-2012-01-23-13 | Grant County - December 1969

    Relationships of soils in association 2 (Soil Survey of Grant County, Kansas; 1969).

  9. KS-2012-01-23-15 | Grant County - December 1969

    Relationships of soils in association 4 (Soil Survey of Grant County, Kansas; 1969).

  10. KS-2012-01-23-16 | Grant County - December 1969

    Relationships of soils in association 5 (Soil Survey of Grant County, Kansas; 1969).

  11. KS-2012-01-23-18 | Gray County - January 1968

    Soils of the Mansic-Ulysses soil association are on the right; on the left are soils of the Pratt-Tivoli soil association (Soil Survey of Gray County, Kansas; 1968).

  12. KS-2012-01-23-20 | Gray County - January 1968

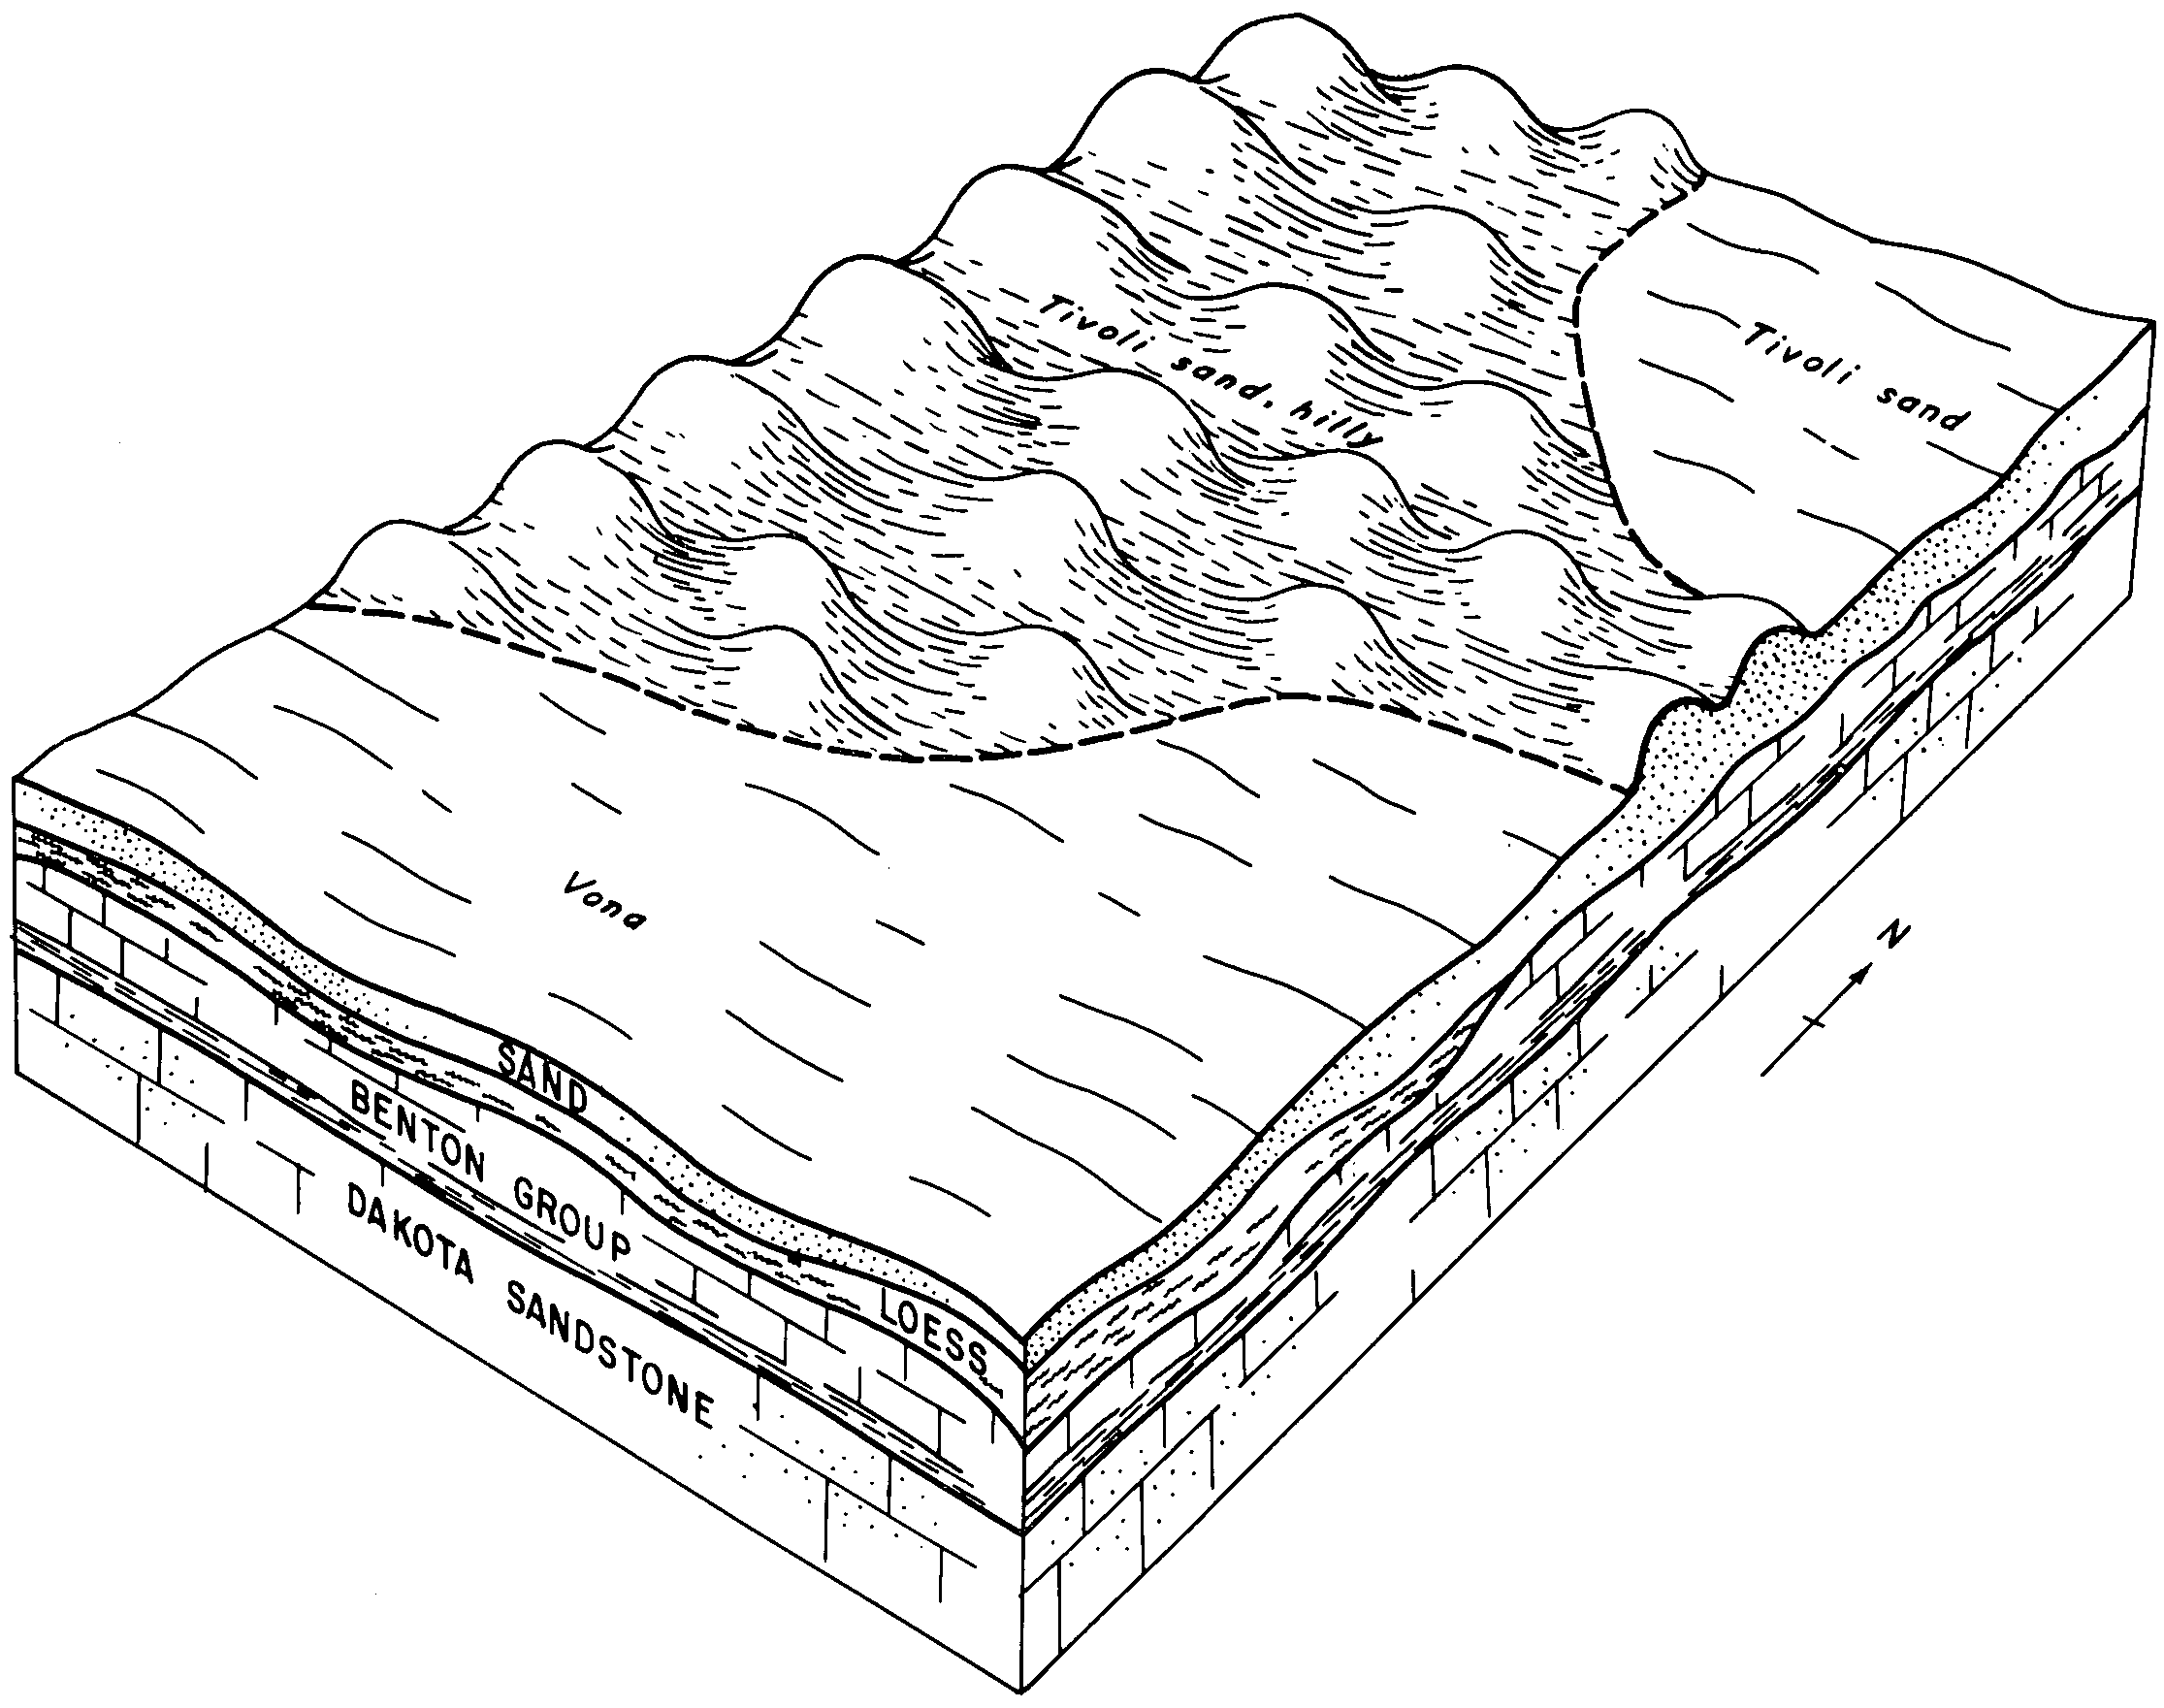
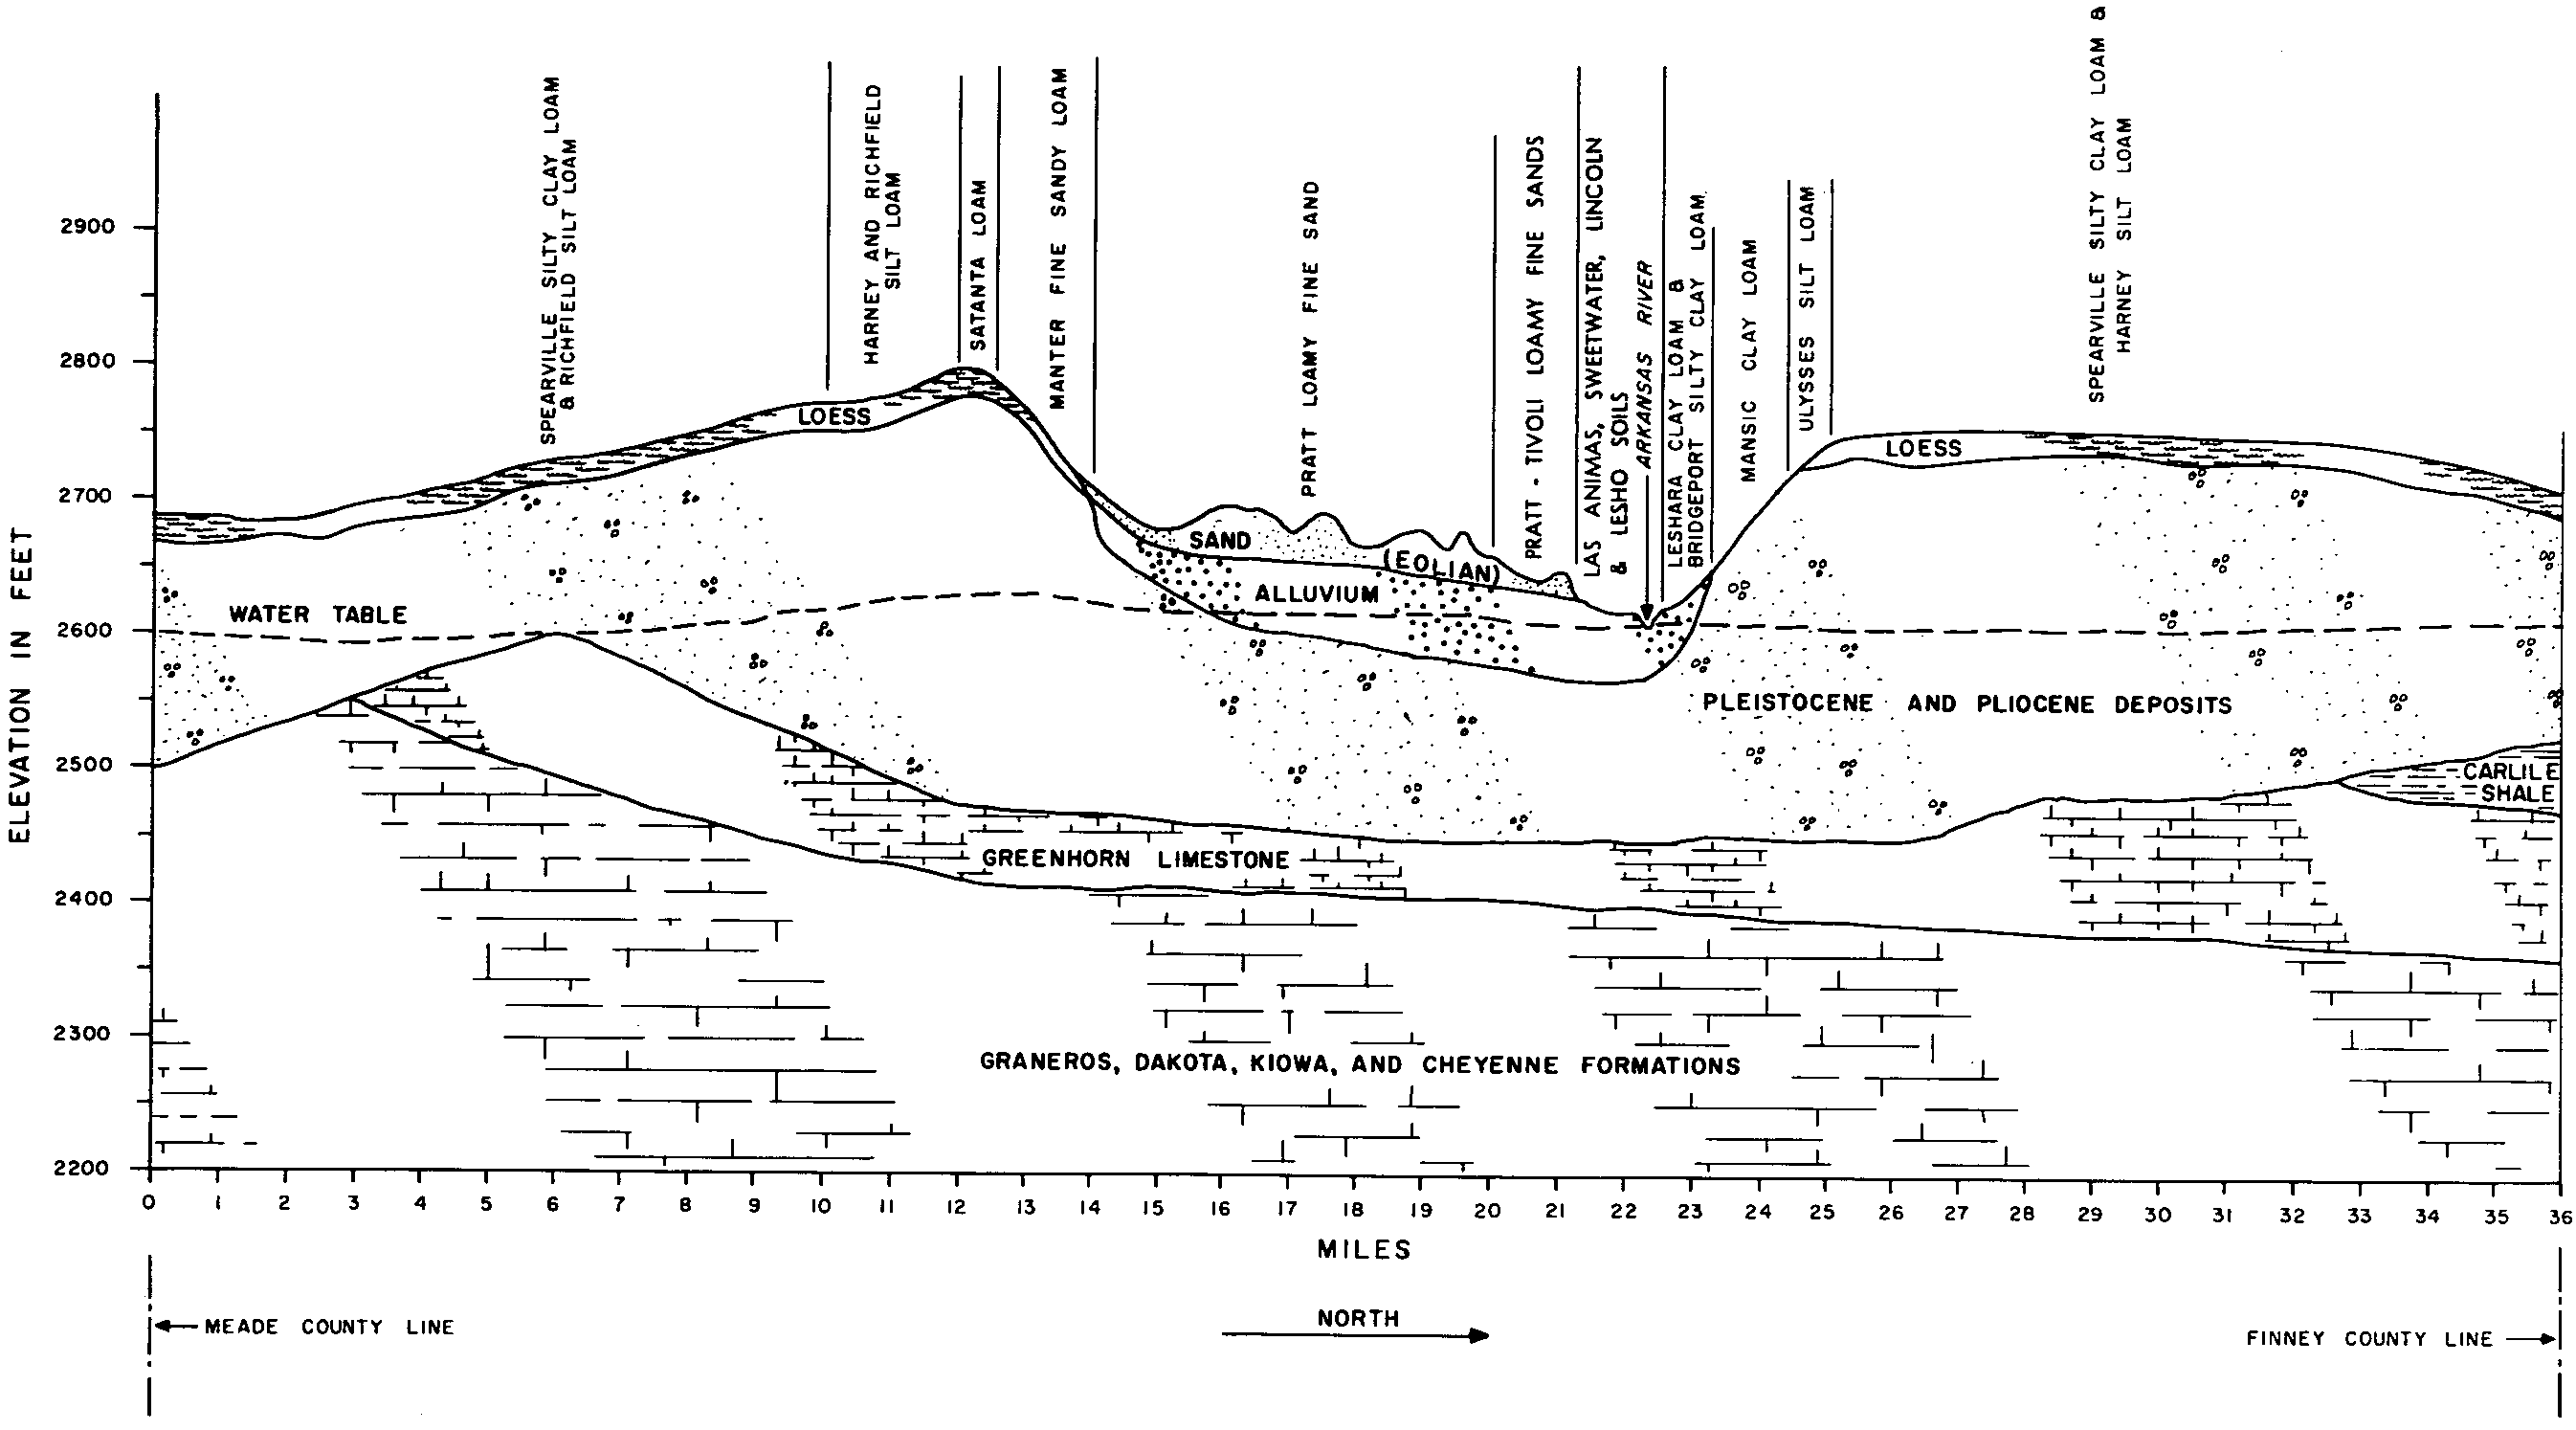
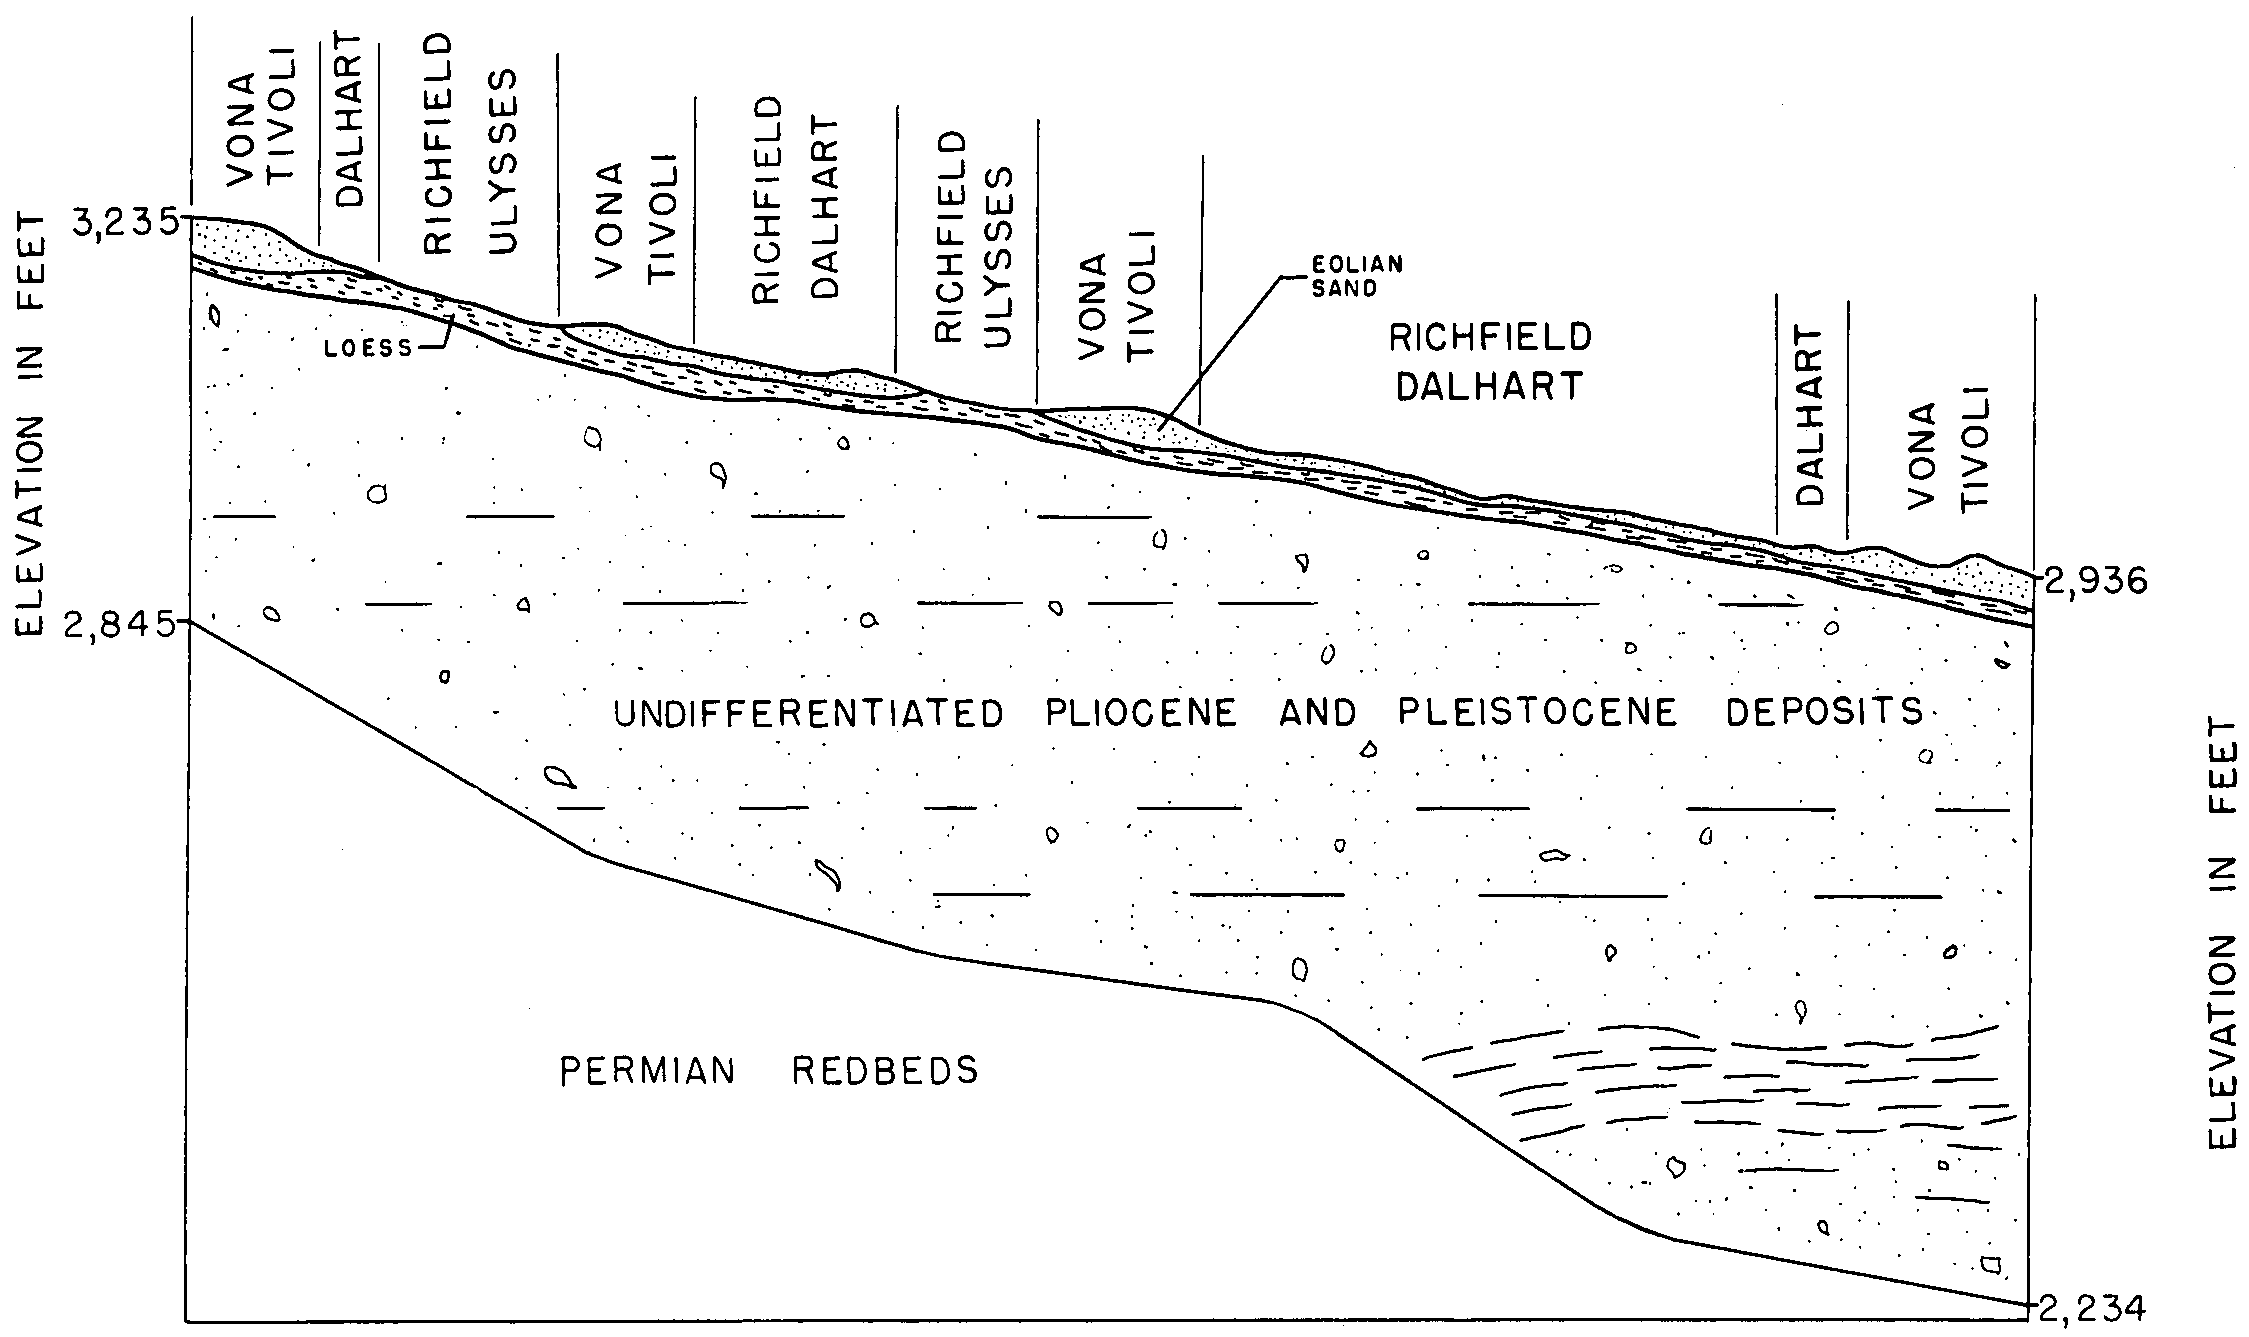
    Approximate geologic cross section through the central part of Gray County and the general location of soils on the landscape (Soil Survey of Gray County, Kansas; 1968).

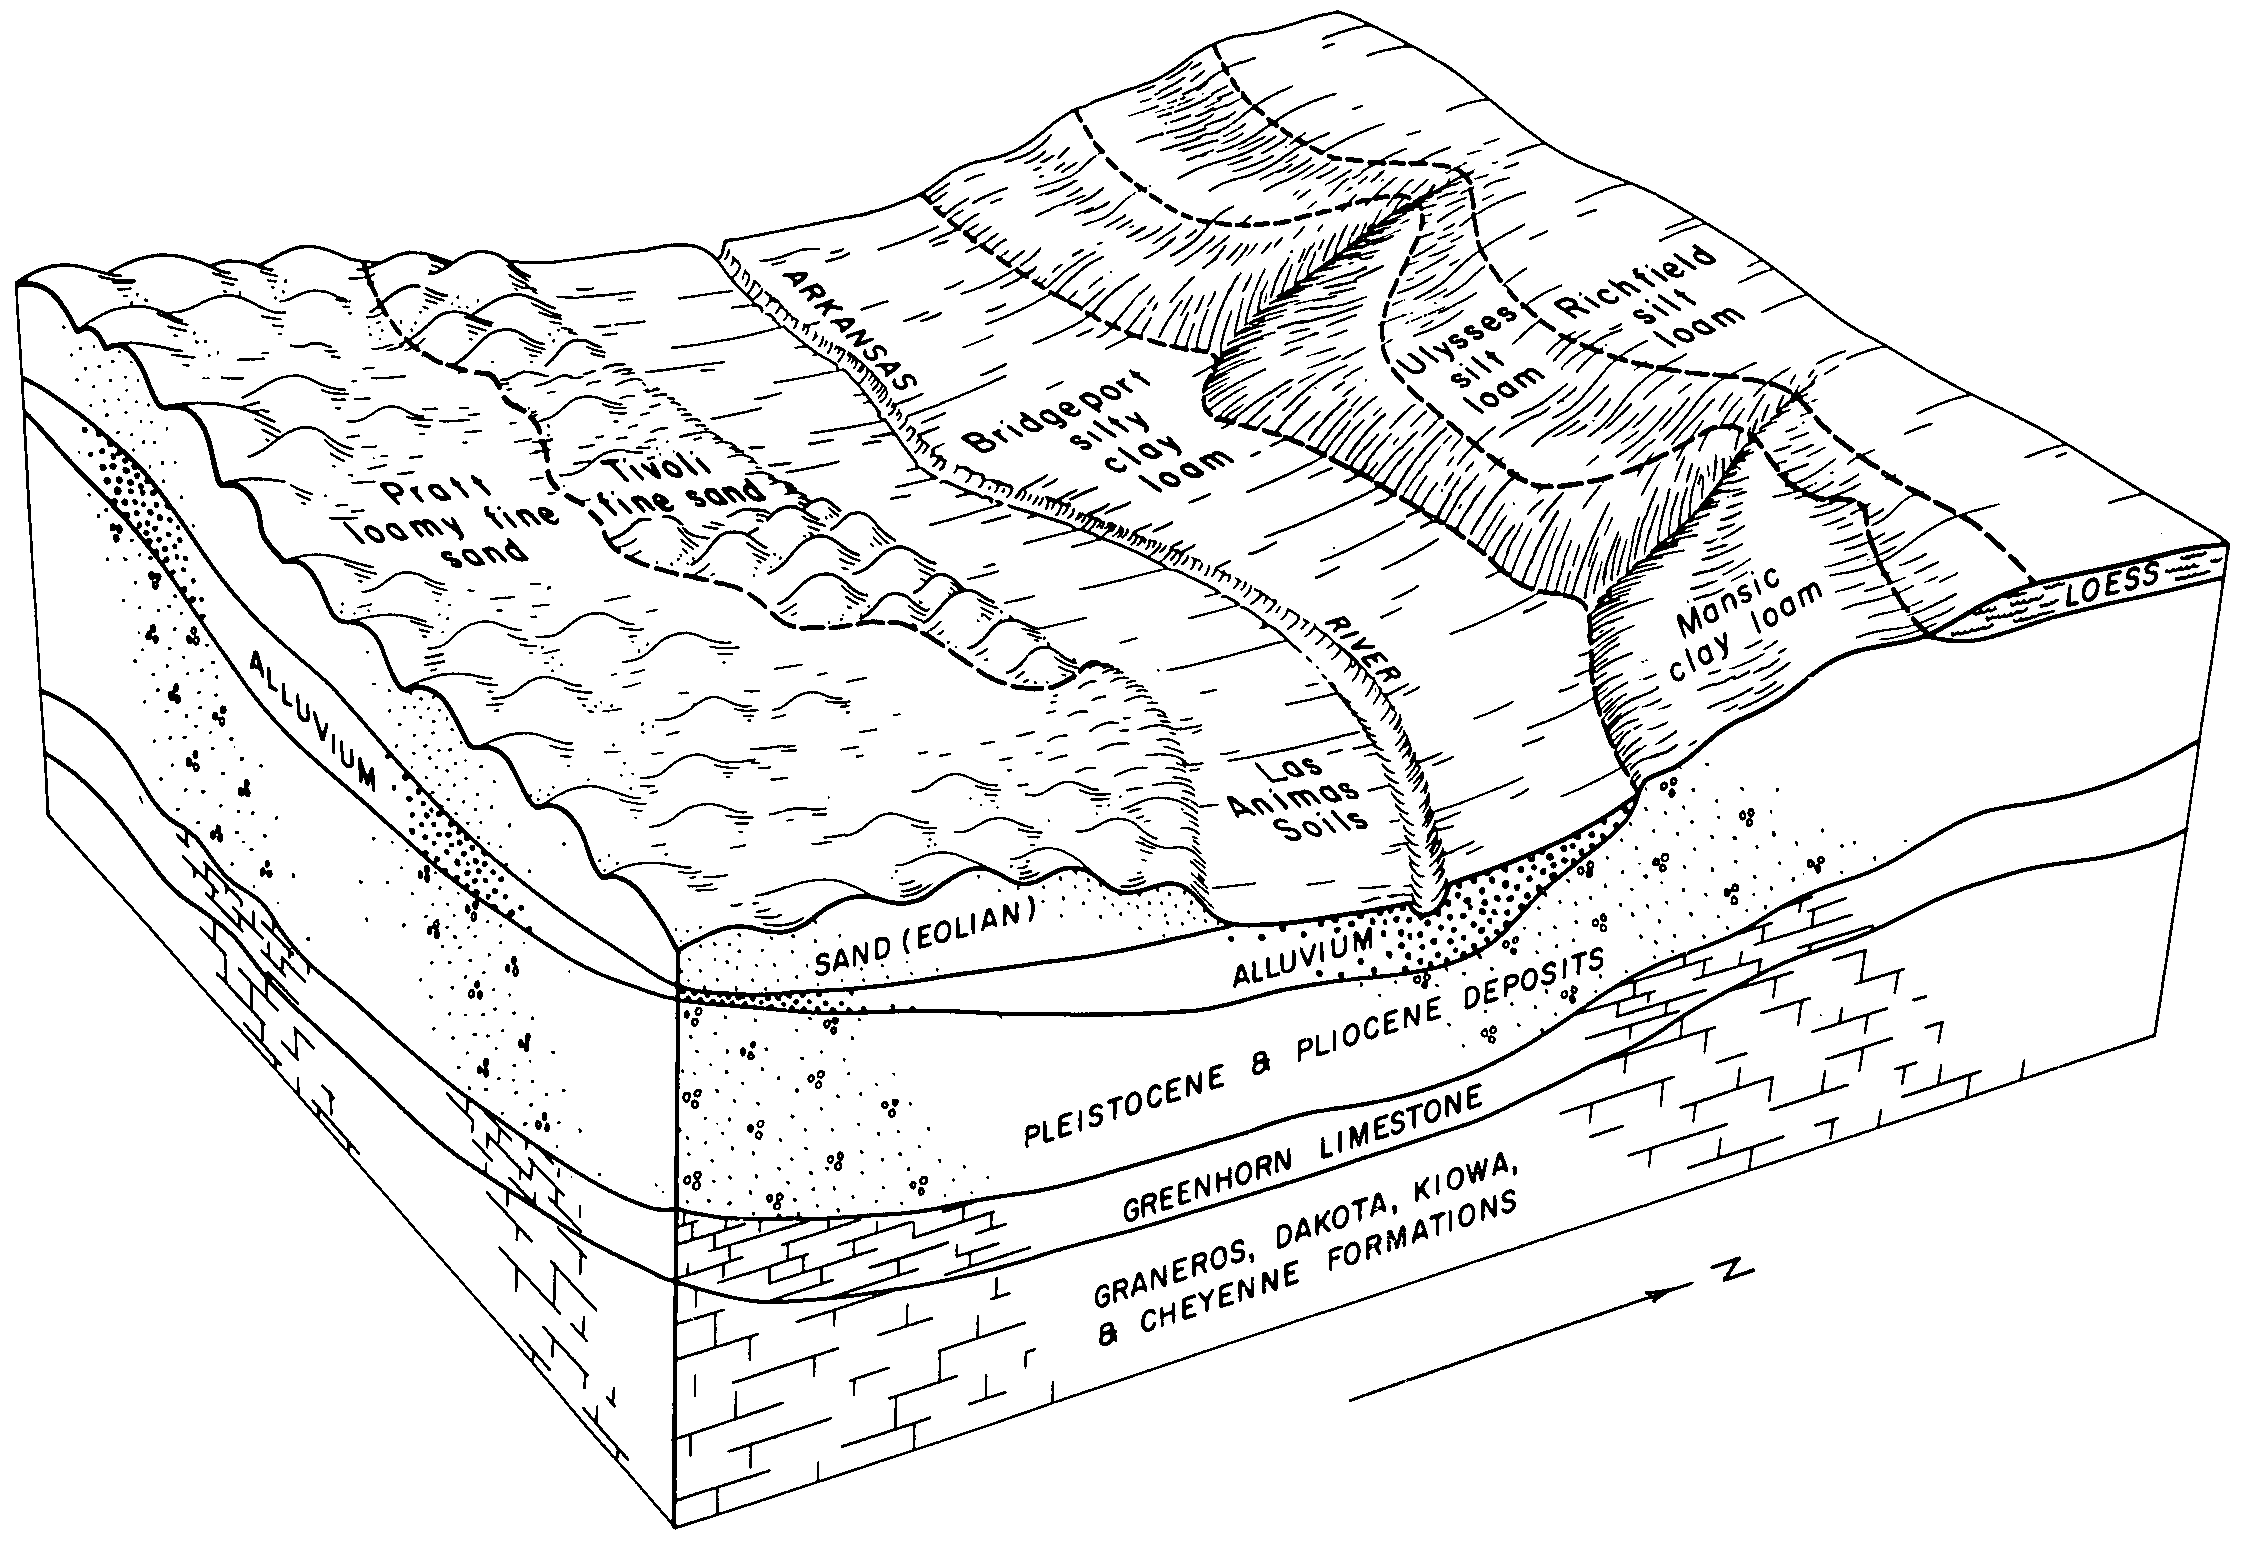
  13. KS-2012-01-23-25 | Hamilton County - November 1961

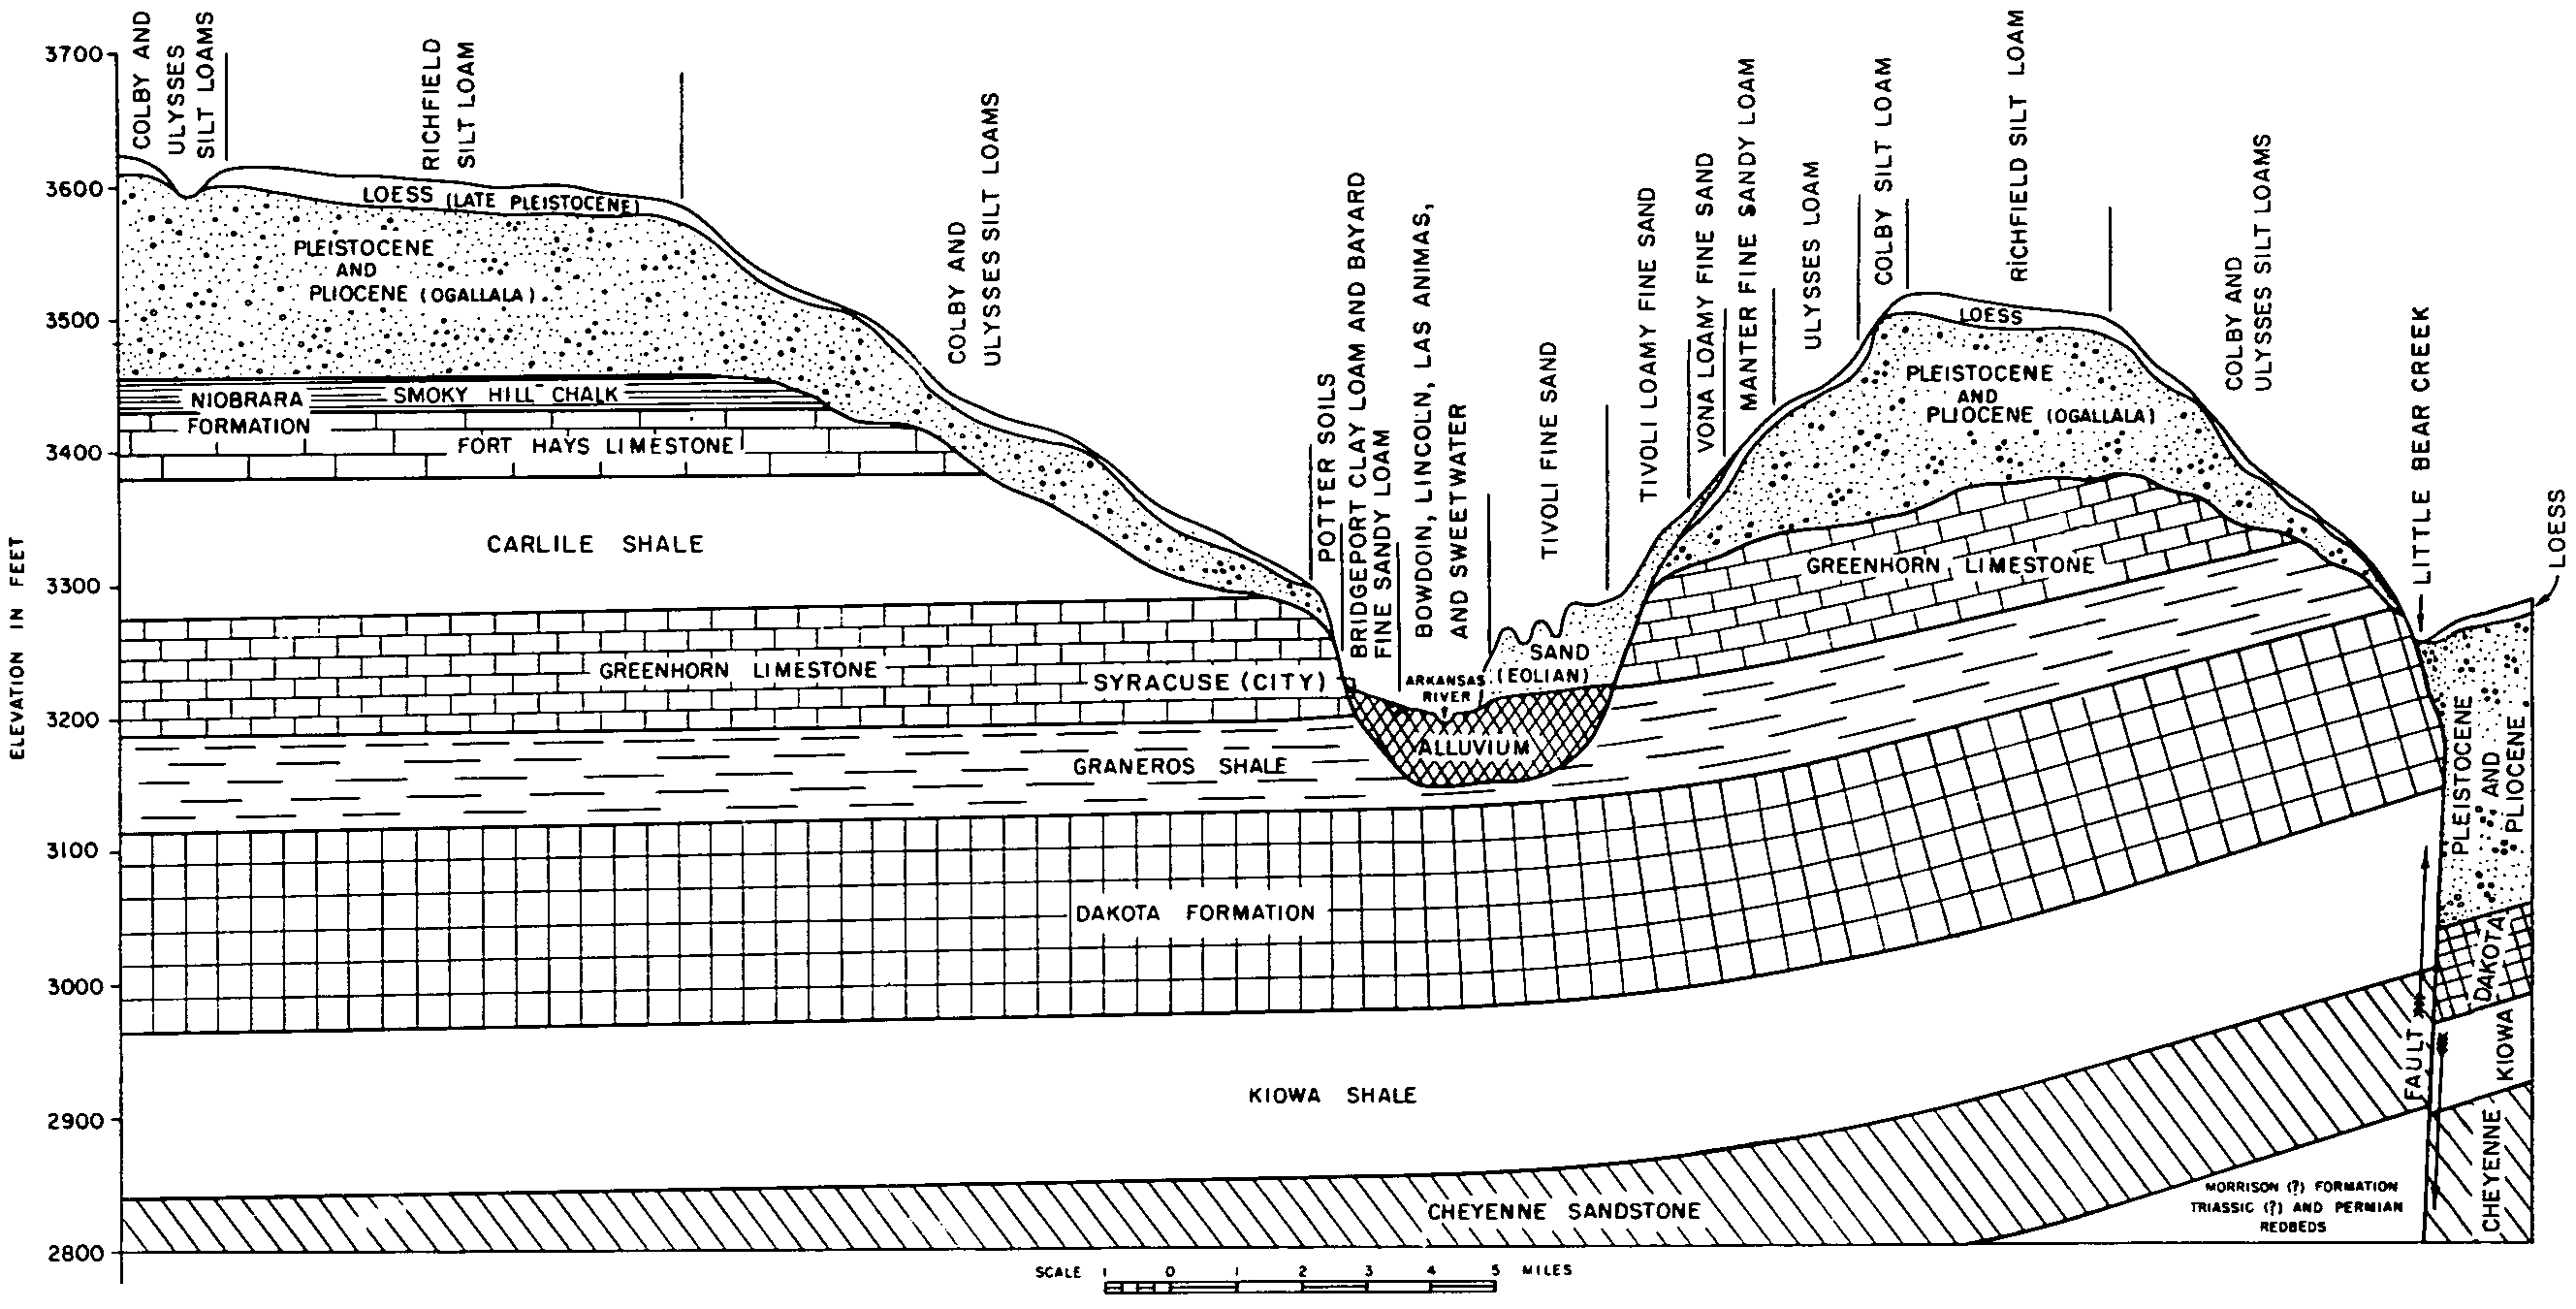
    Geologic profile extending in a north-south direction through the central part of Hamilton County (Soil Survey of Hamilton County, Kansas; 1961).

  14. KS-2012-01-23-27 | Harvey County - November 1974

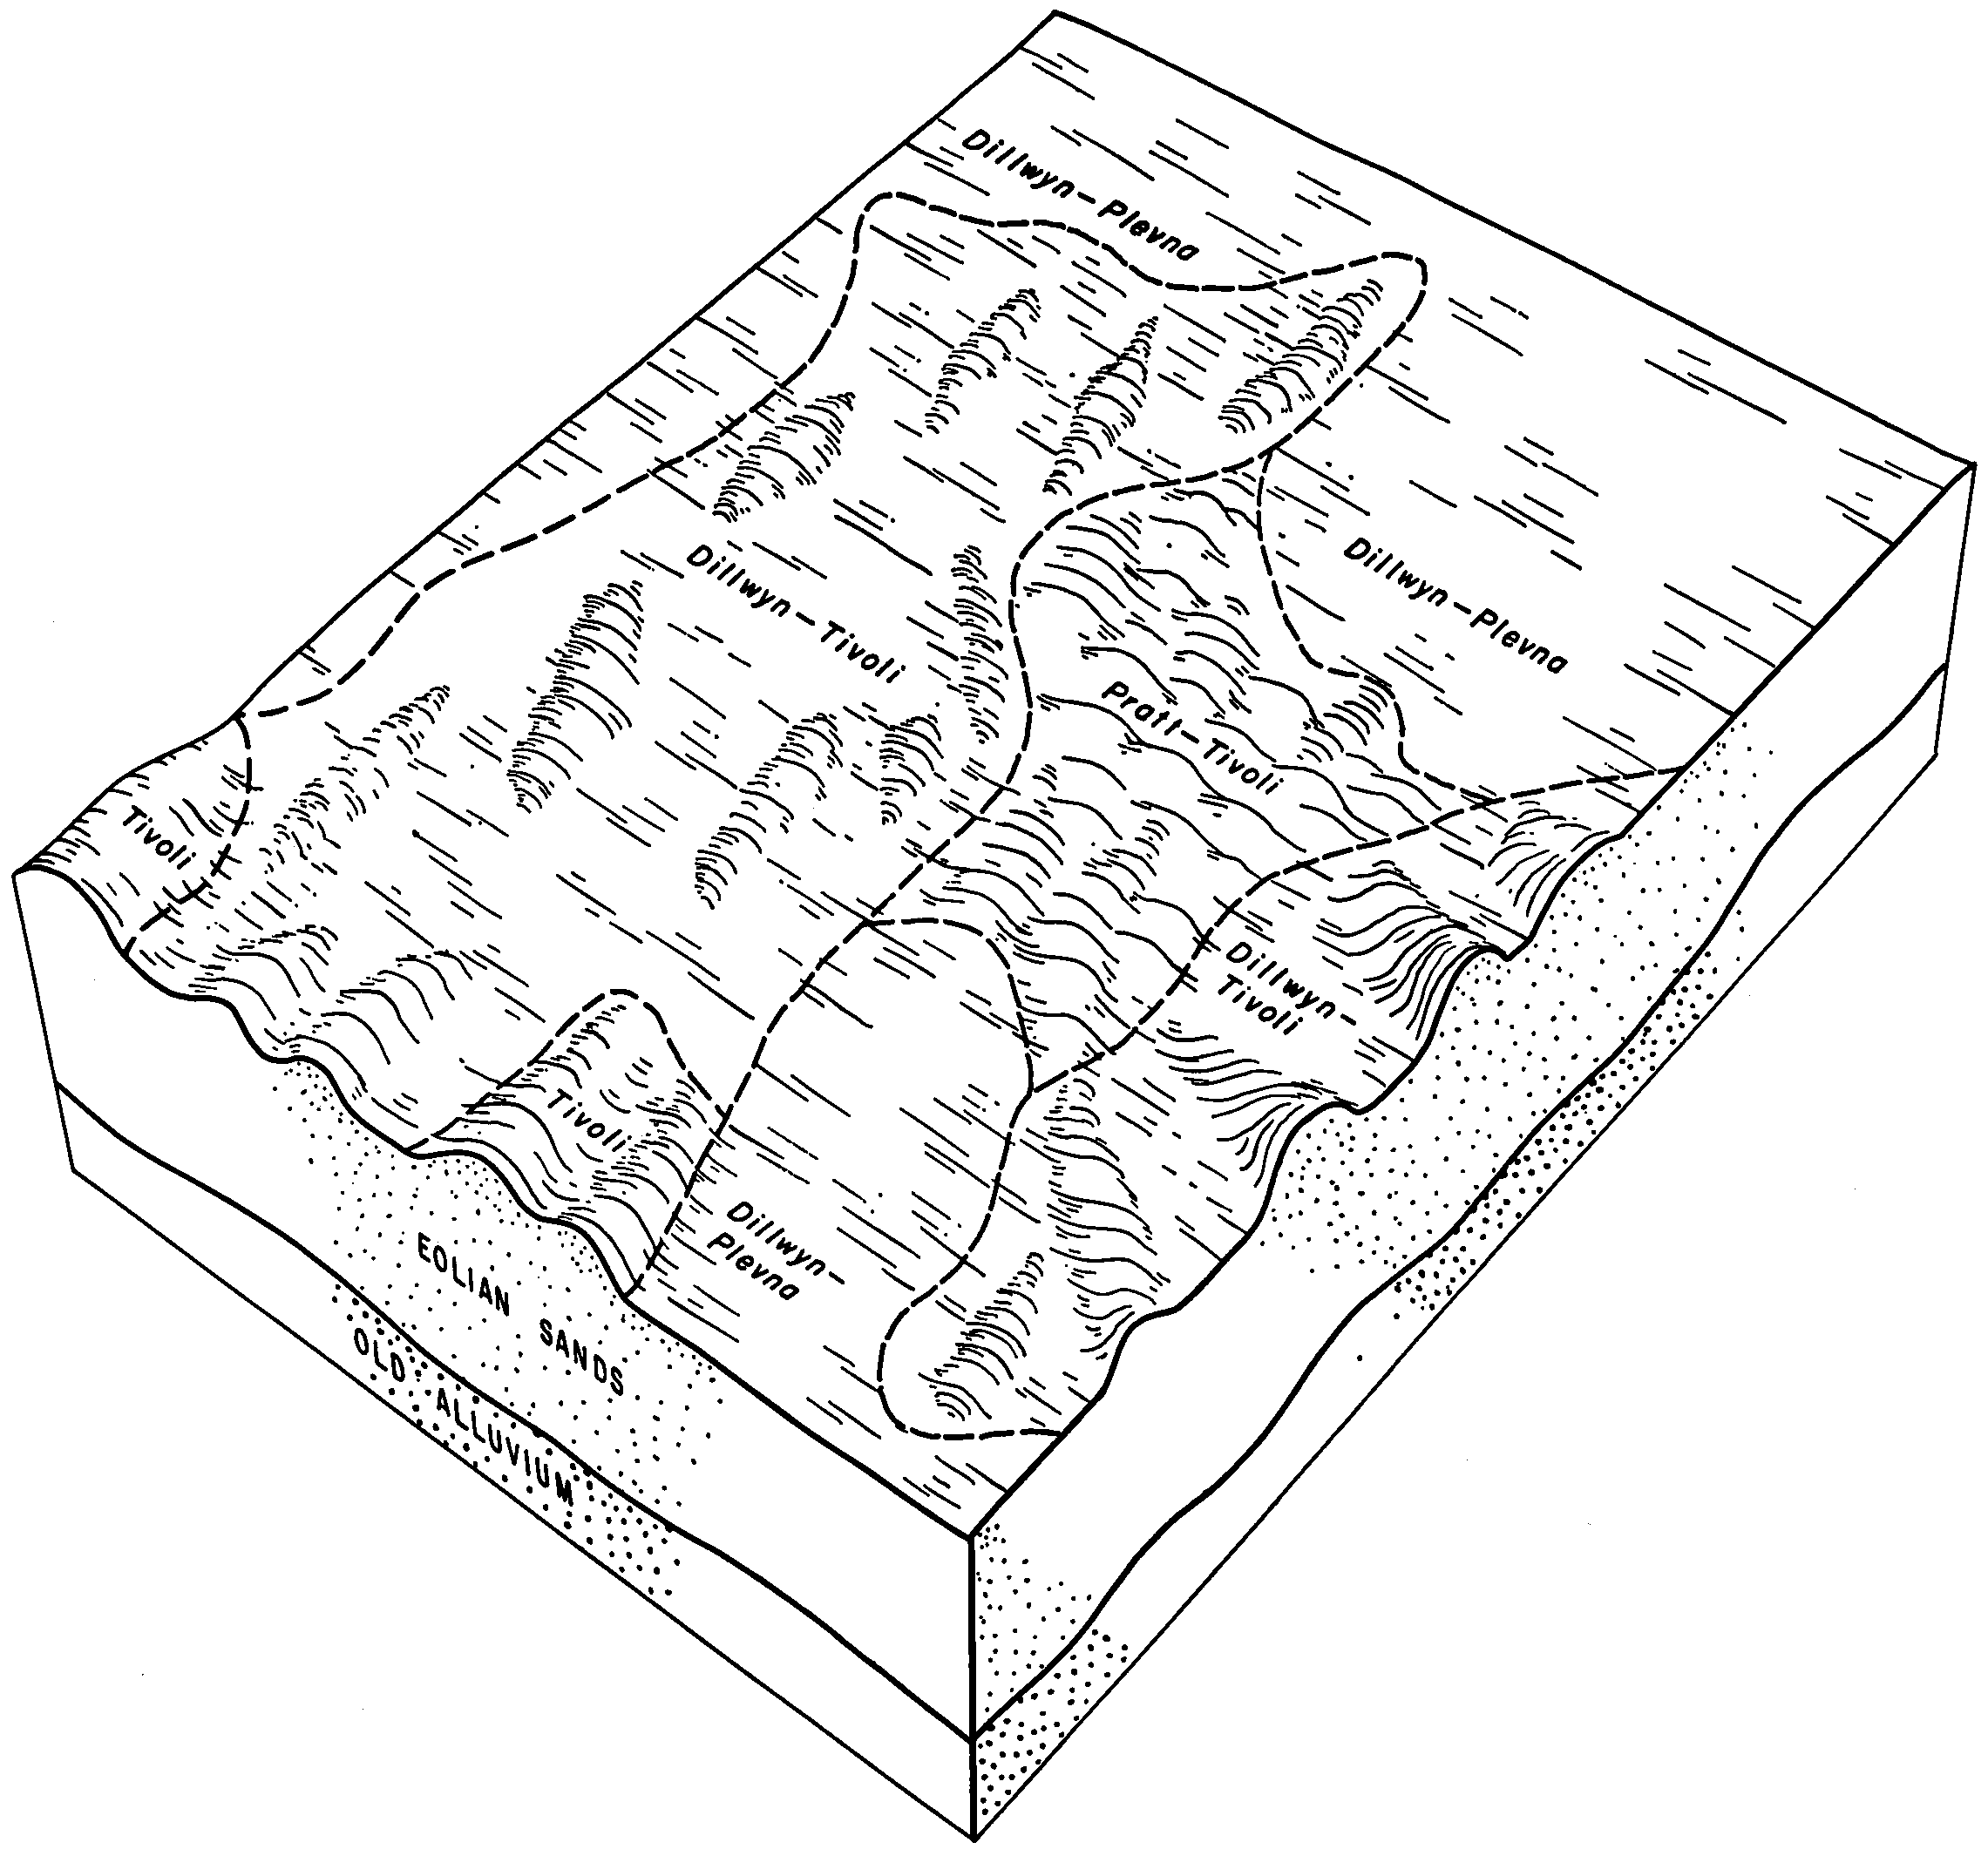
    Typical pattern of soils in the Dillwyn-Tivoli association (Soil Survey of Harvey County, Kansas; 1974).

  15. KS-2012-01-23-30 | Haskell County - October 1968

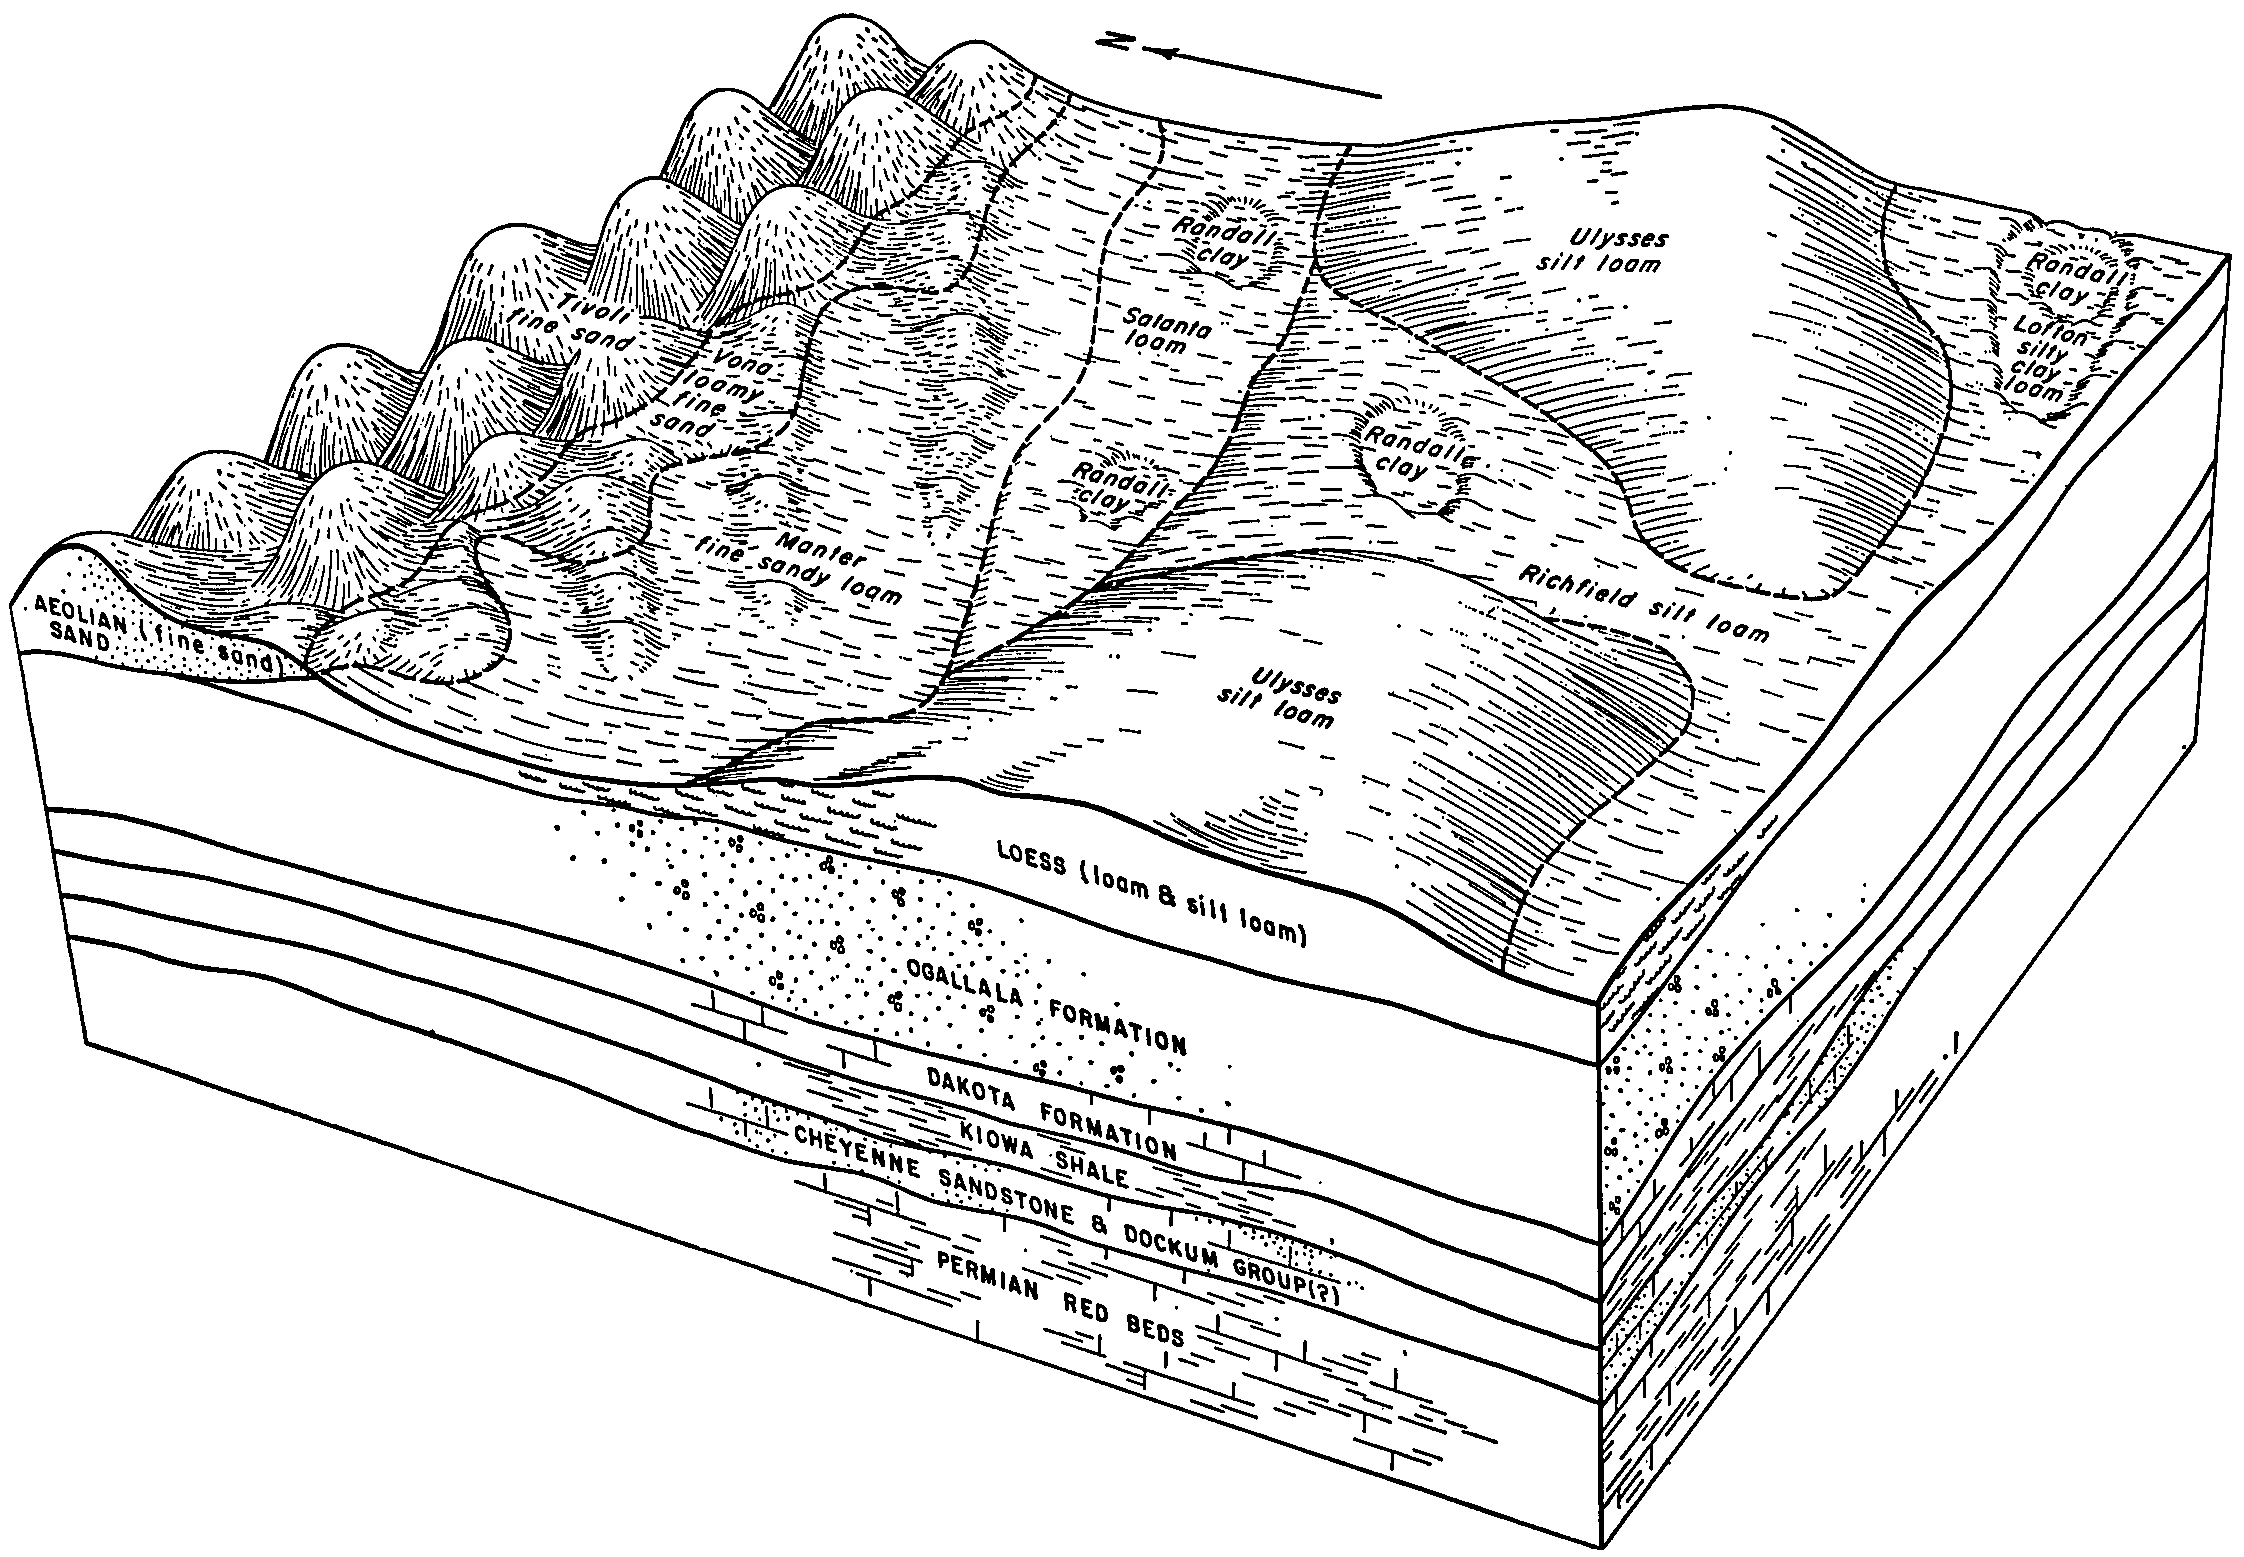
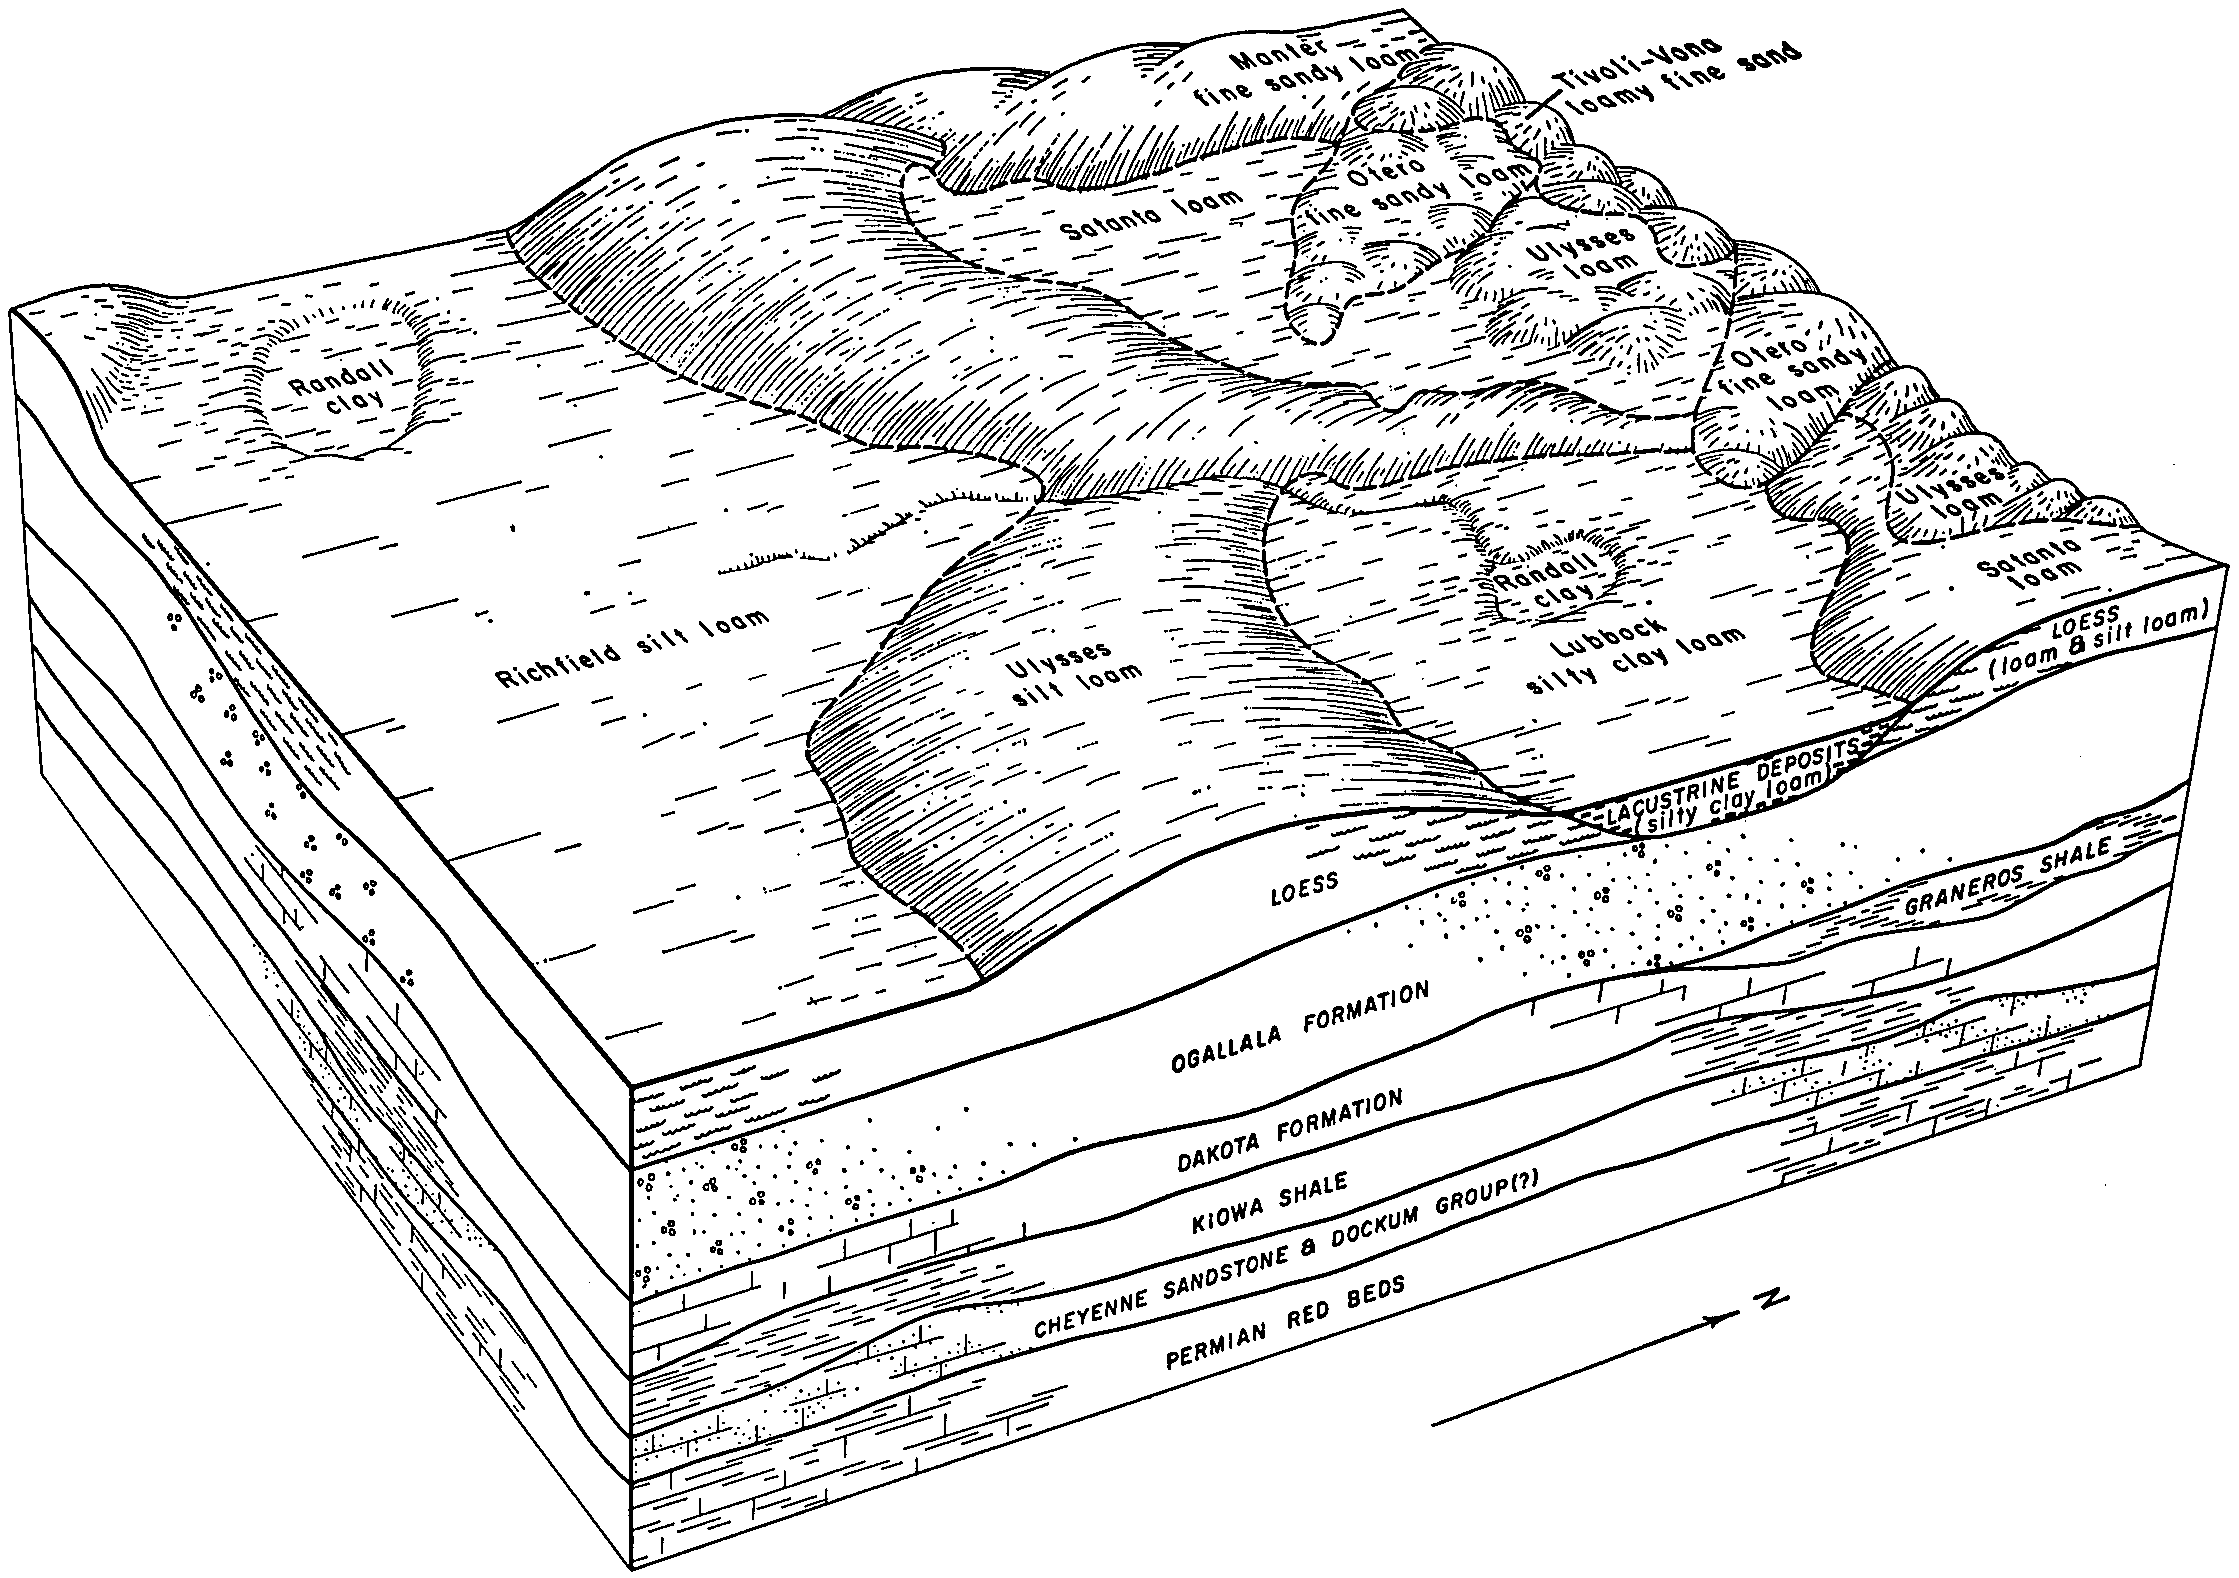
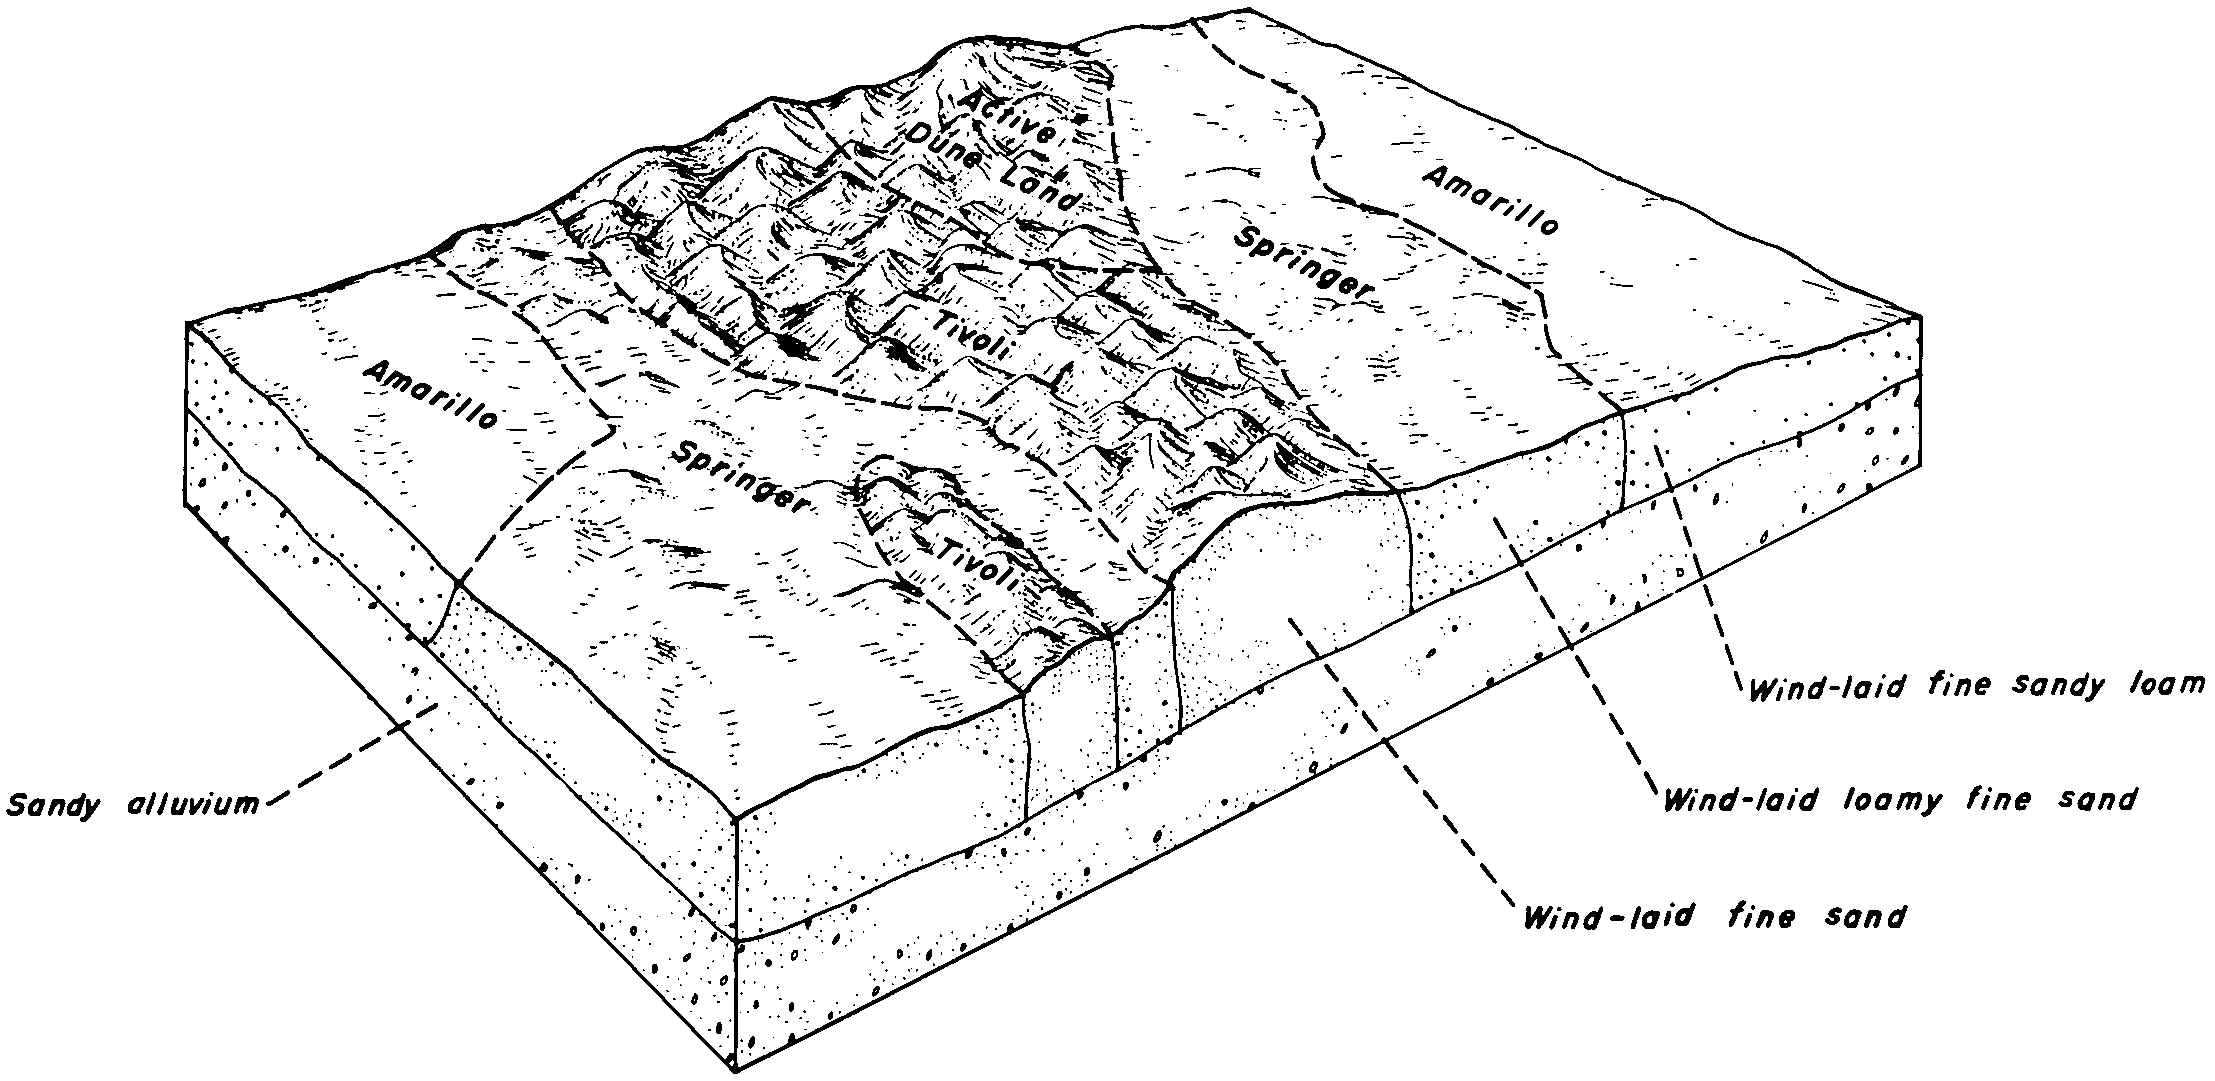
    Typical topographic relation of three soil associations in Haskell County. Tivoli-Vona association, the farthest north, blocks drainageways flowing from the Satanta-Manter and the Richfield-Ulysses associations to the south (Soil Survey of Haskell County, Kansas; 1968).

  16. KS-2012-01-23-31 | Haskell County - October 1968

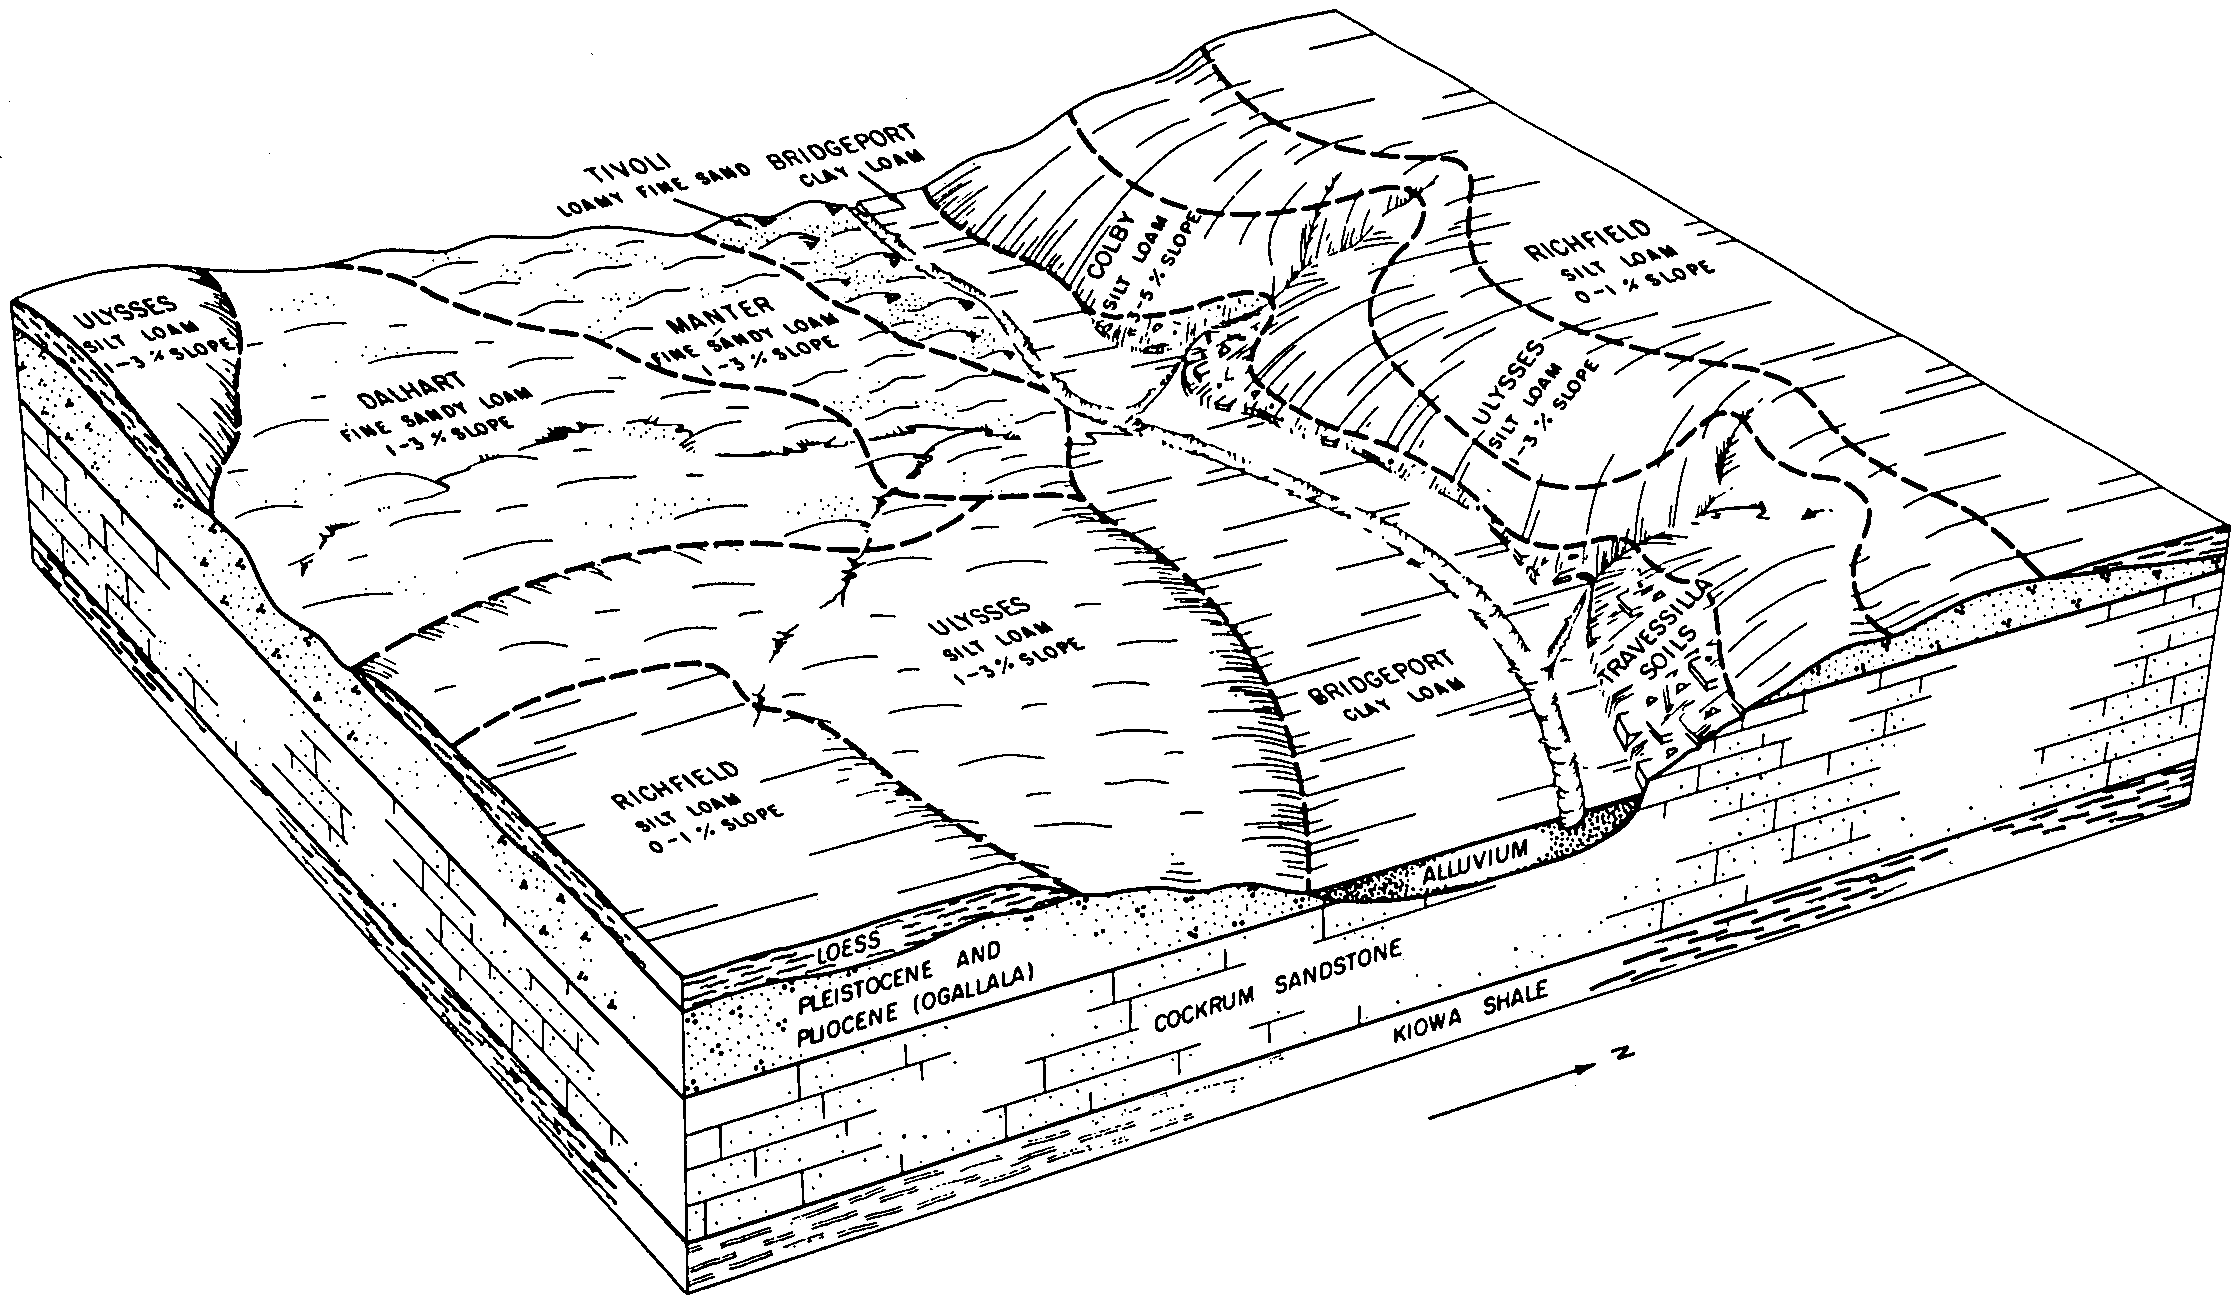
    Soils of the Richfield-Ulysses association in the central part of the county (Soil Survey of Haskell County, Kansas; 1968).

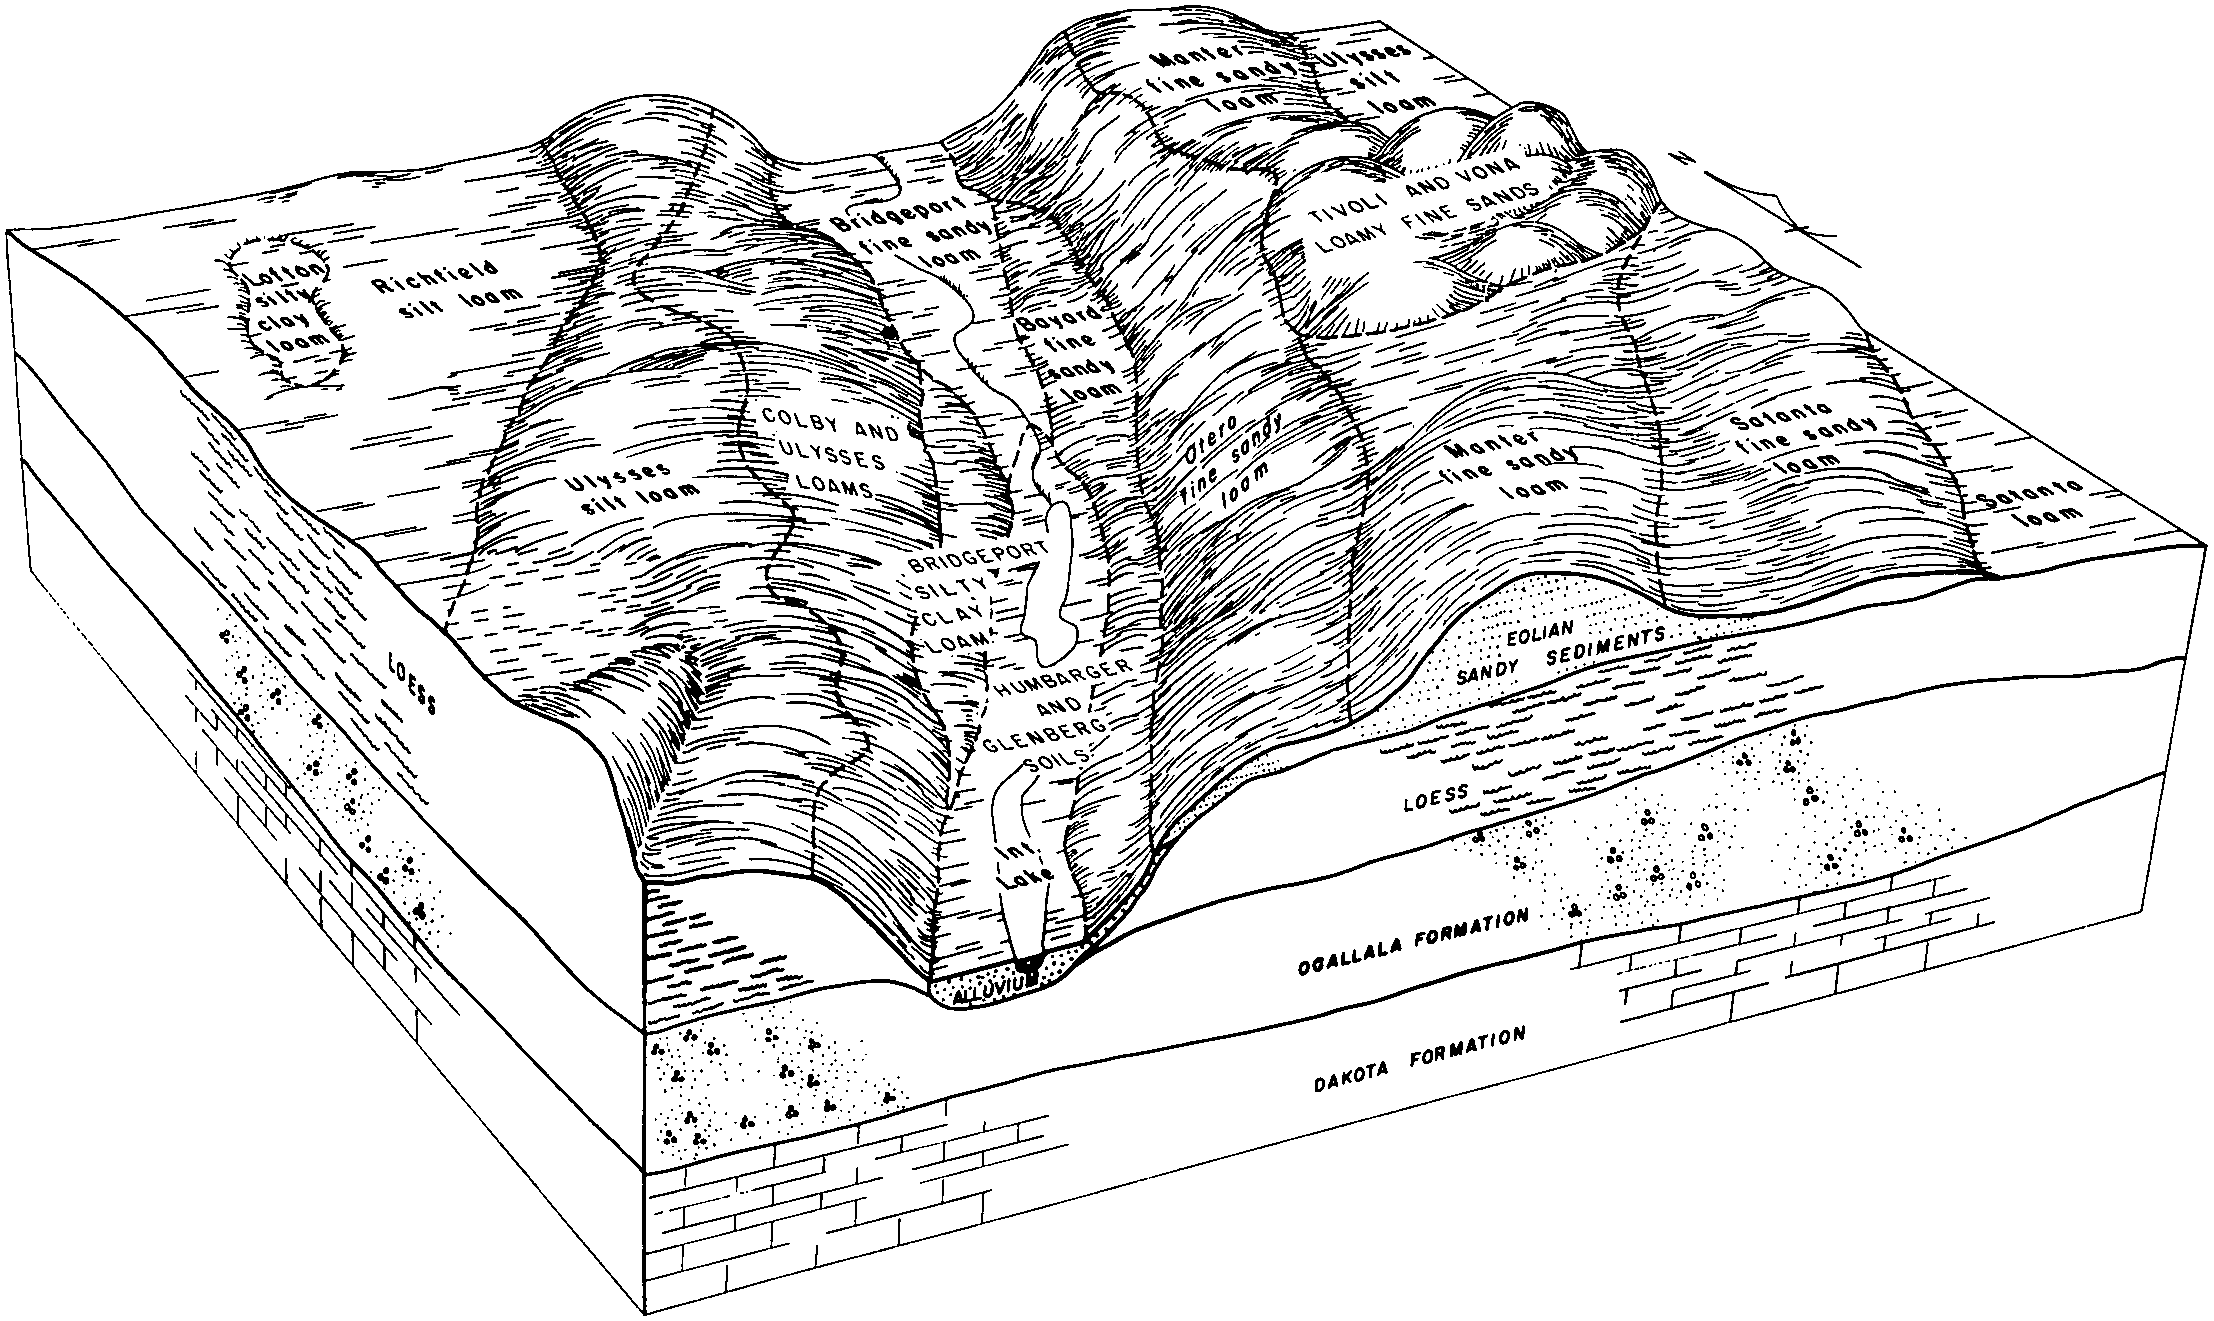
  17. KS-2012-01-23-44 | Kearny County - November 1963

    An approximate geologic profile of Kearny County, extending in a north-south direction across the county near Hartland (Soil Survey of Kearny County, Kansas; 1963).

  18. KS-2012-01-25-13 | Pratt County - September 1968

    Major soils of associations 1 and 2 and the positions they normally occupy on the landscape (Soil Survey of Pratt County, Kansas; 1968).

  19. KS-2012-01-25-27 | Rice County - December 1974

    Distribution of the soils in the Carwile-Farnum-Tabler and Canadian-Kaski-Platte associations (Soil Survey of Rice County, Kansas; 1974).

  20. KS-2012-01-26-11 | Stanton County - December 1961

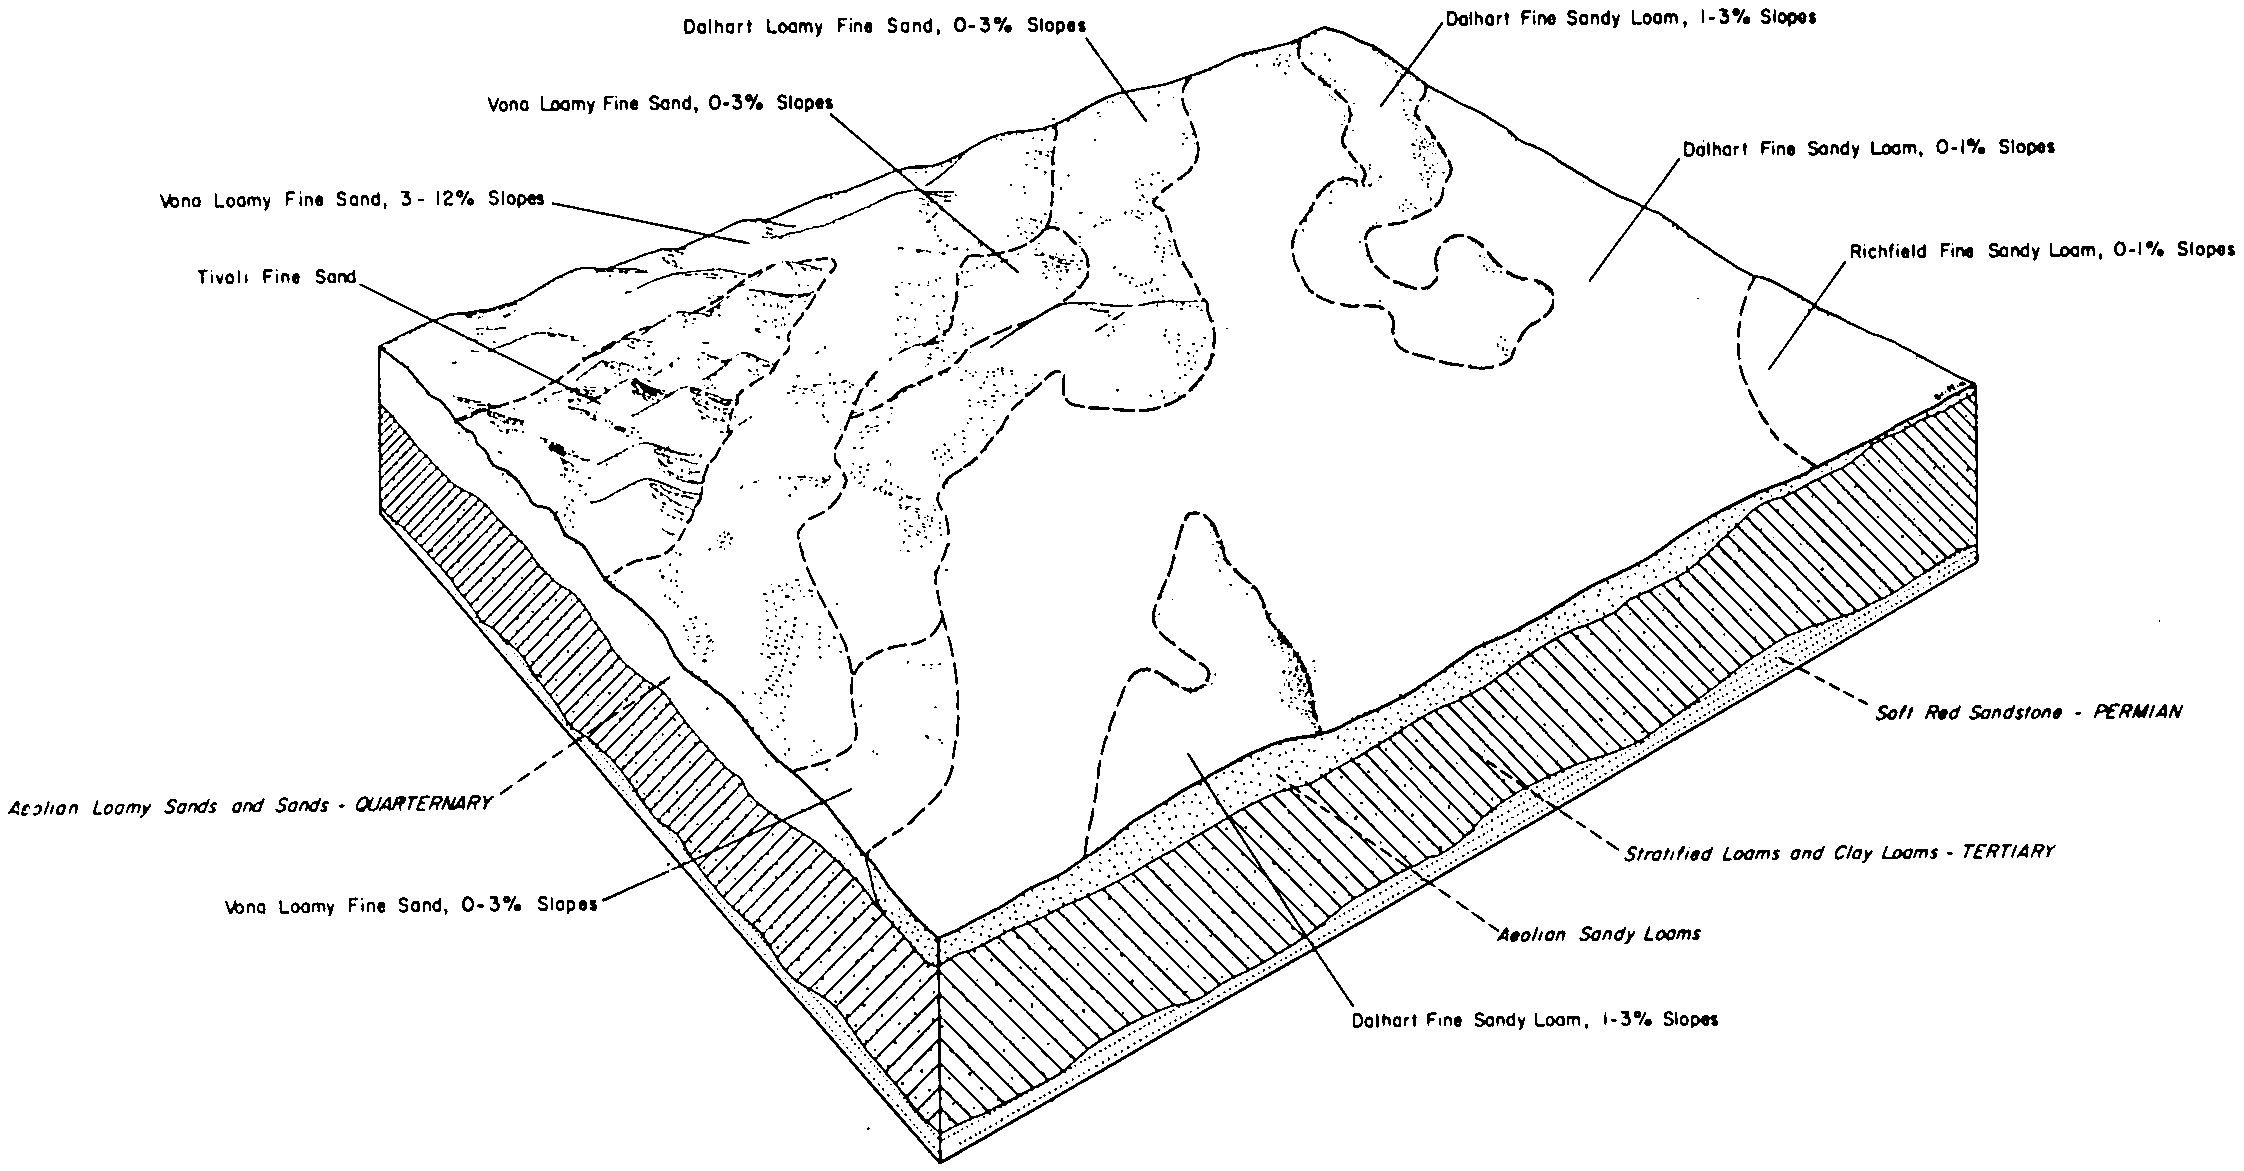
    Diagram of the Manter-Dalhart-Ulysses soil association in the valley of Bear Creek (Soil Survey of Stanton County, Kansas; 1961).

  21. KS-2012-01-26-14 | Stevens County - October 1961

    Geological cross section through the central part of Stevens County (Soil Survey of Stevens County, Kansas; 1961).

  22. NM-2012-02-14-03 | Harding County - November 1973

    Typical pattern of soils in association 10 in the eastern part of the county (Soil Survey of Harding County, New Mexico; November 1973).

  23. NM-2012-02-14-11 | Lea County - January 1974

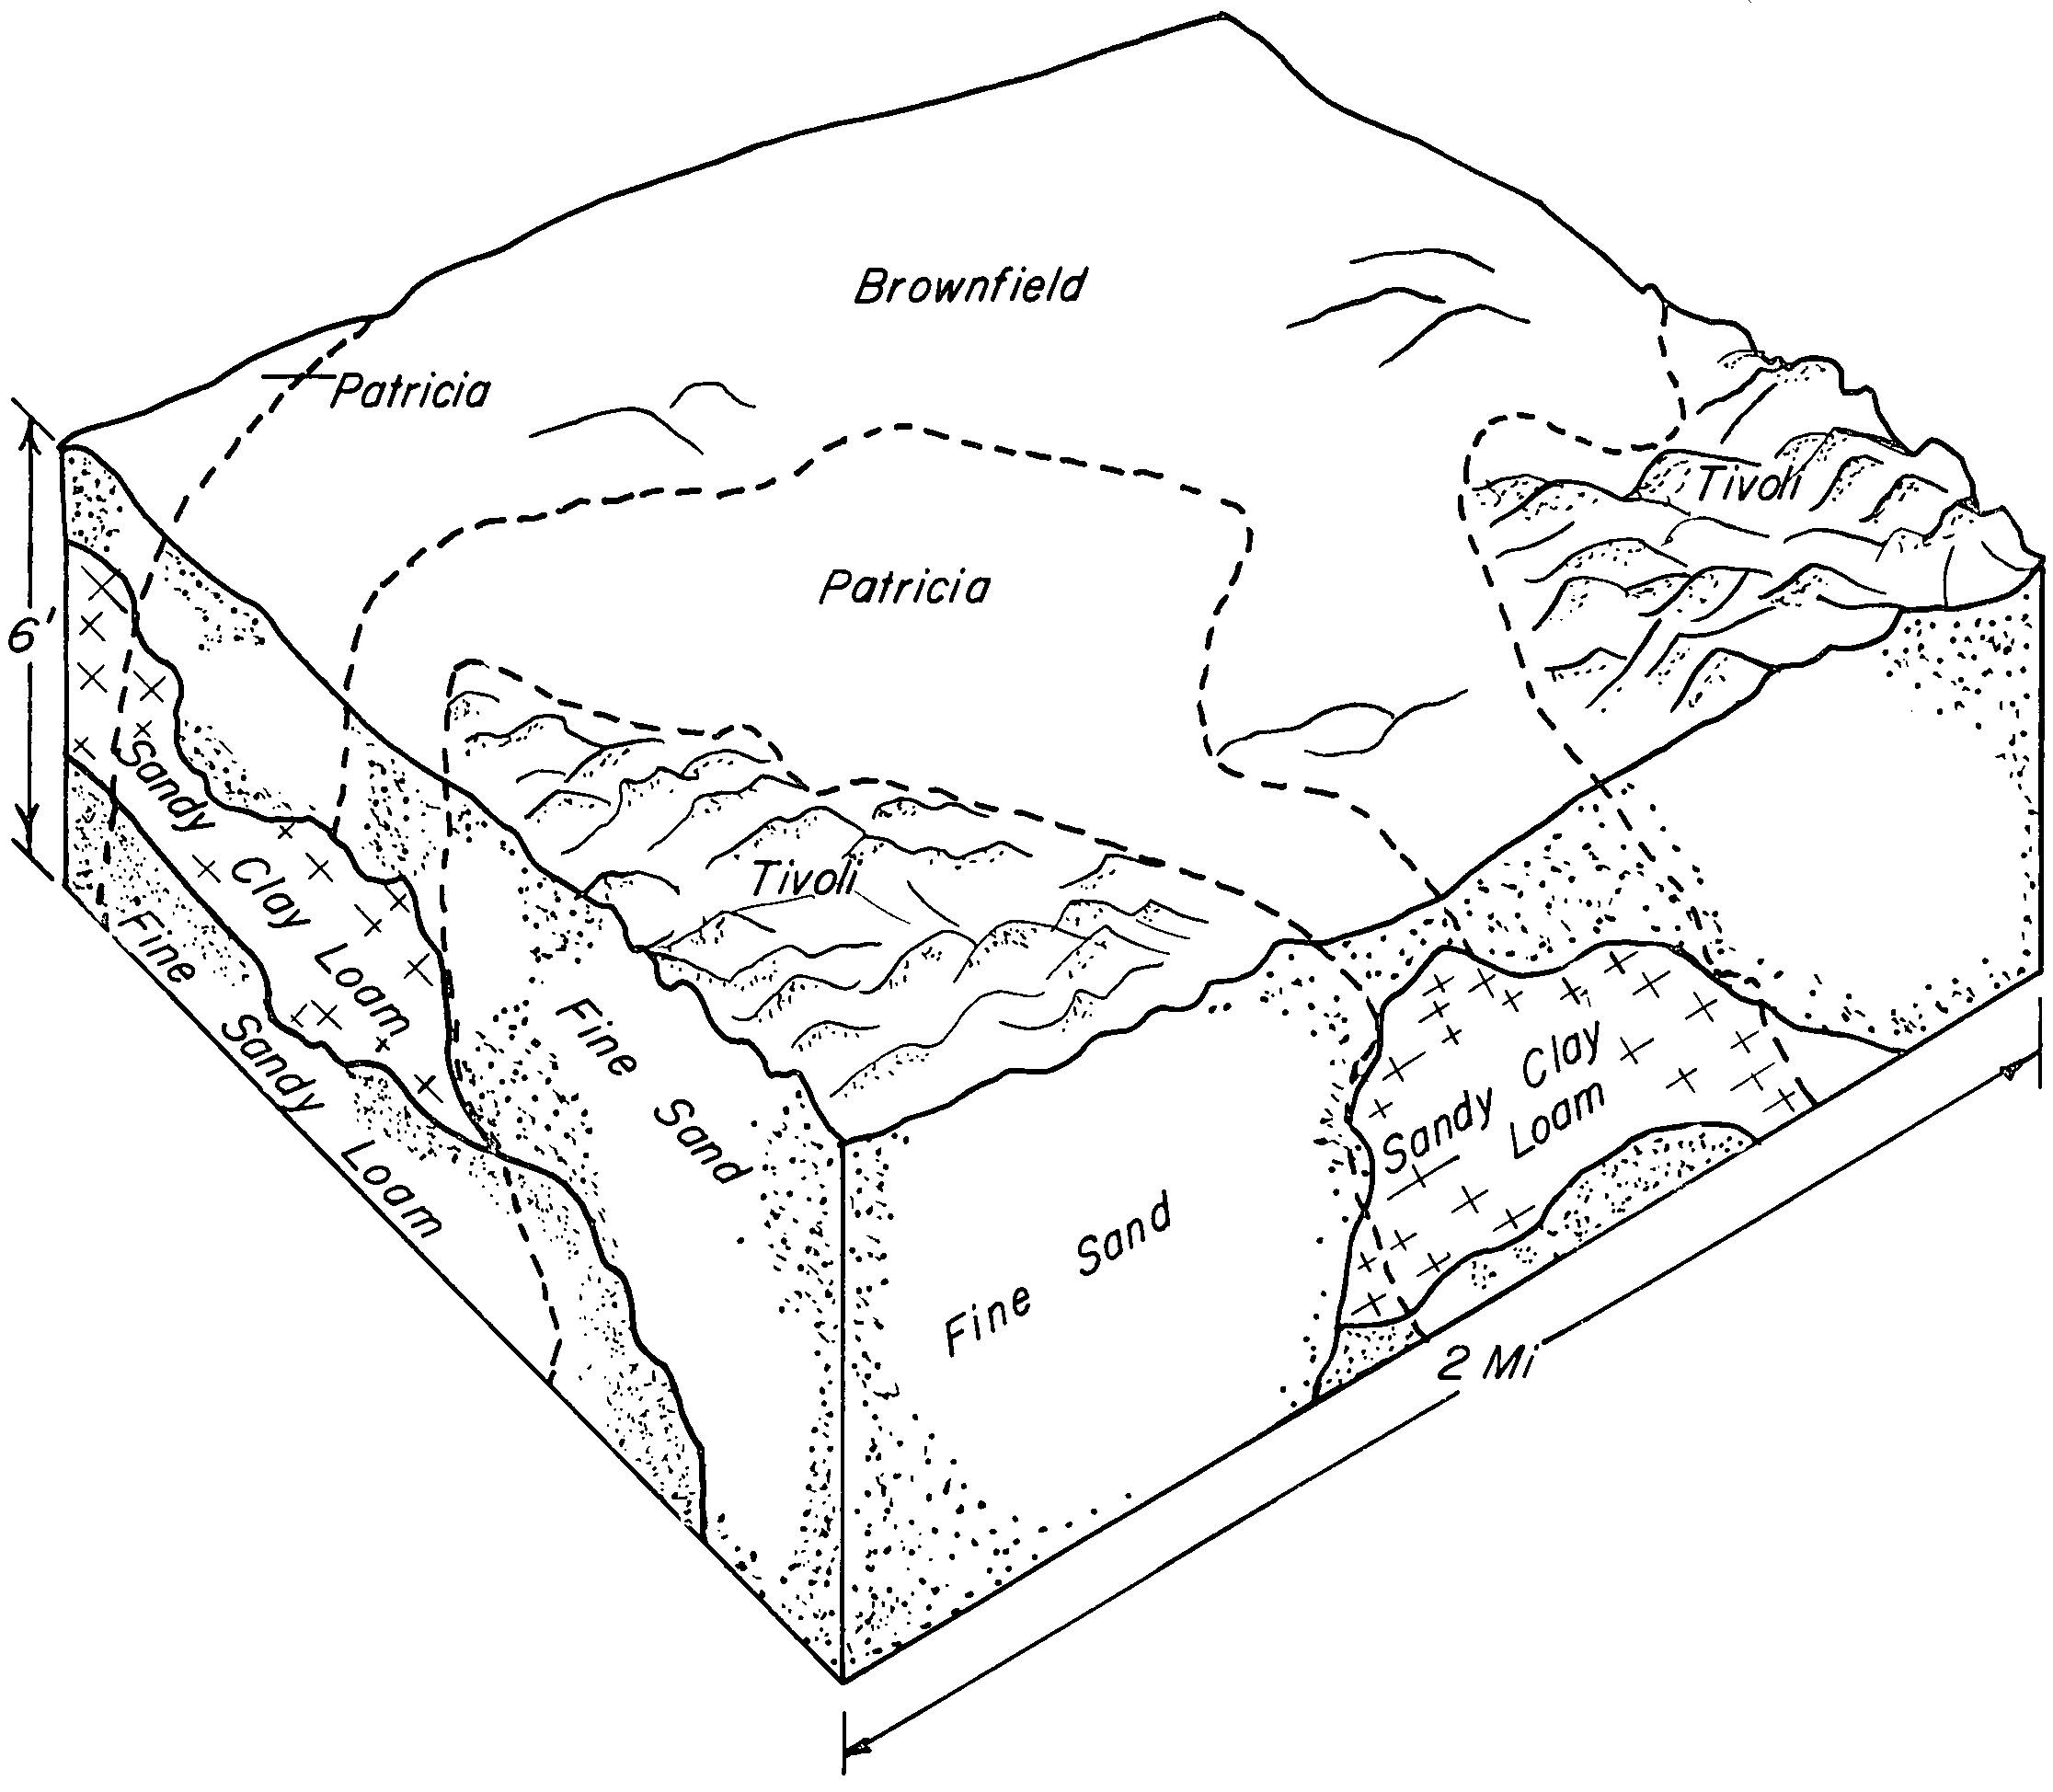
    Typical pattern of soils, topography, and underlying material in Brownfield-Patricia-Tivoli association (Soil Survey of Lea County, New Mexico; January 1974).

  24. NM-2012-02-14-17 | Portales Area - May 1959

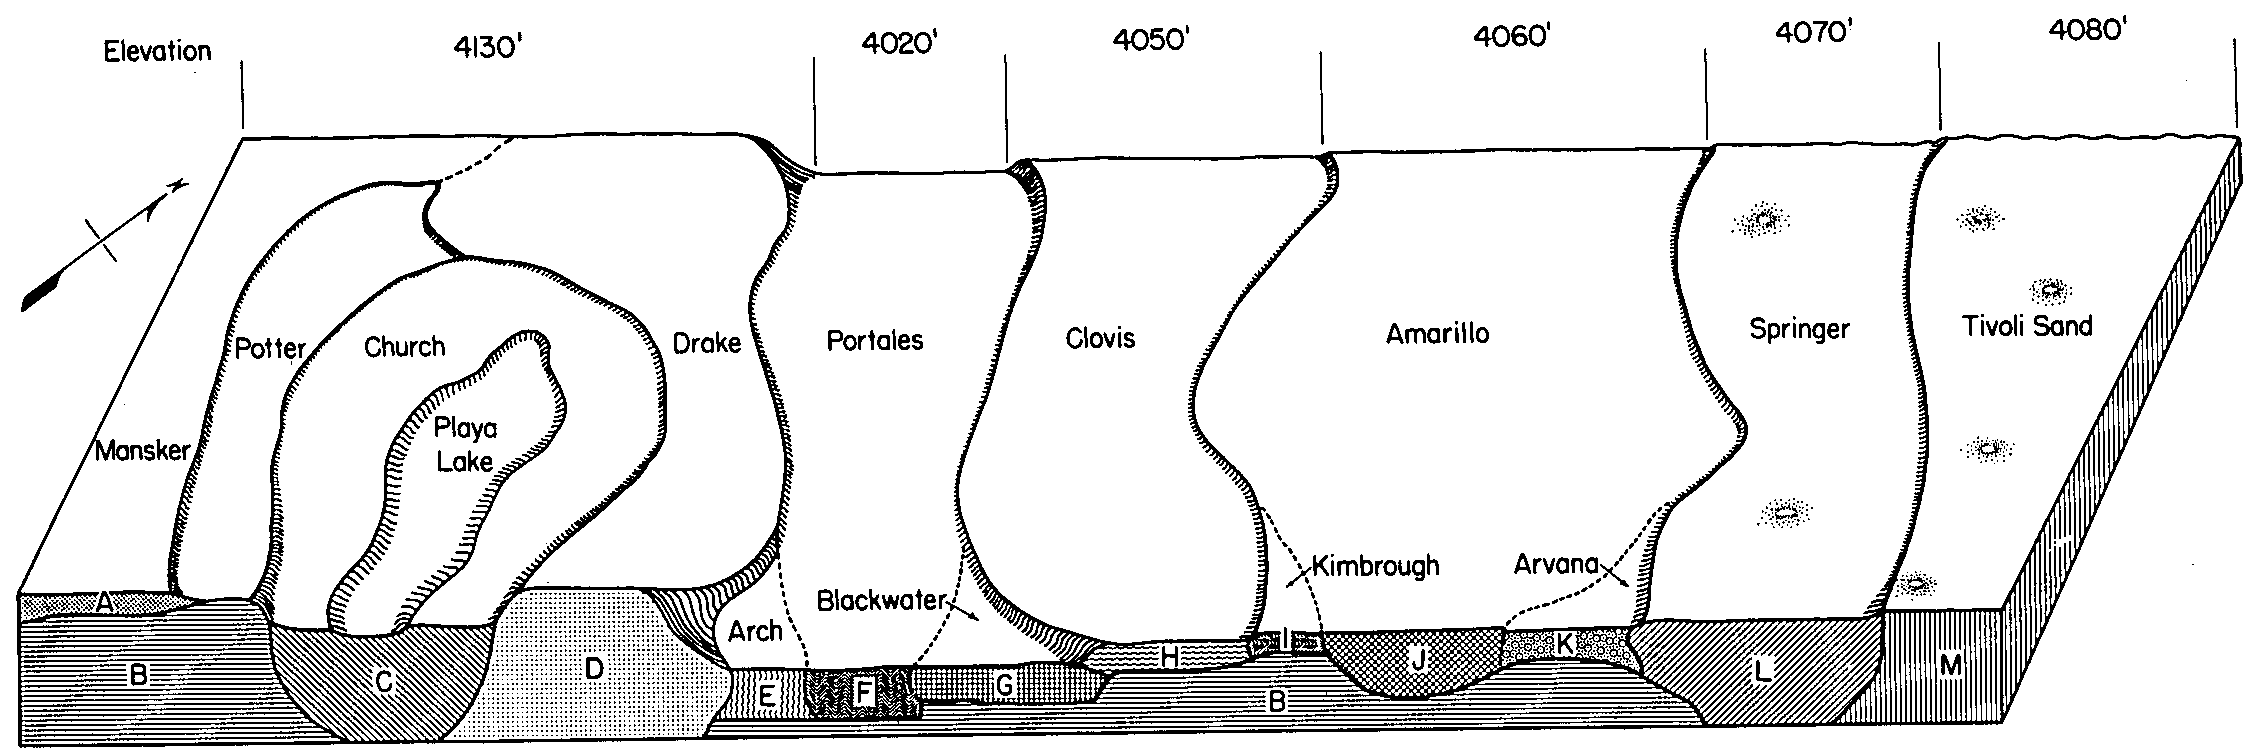
    Relative position and underlying material of main soils of Portales Valley: A, B, Mansker (shallow) and Potter (very shallow), underlain by rocky caliche and High Plains marl. C, Church, underlain by strongly calcareous lake sediments. D, Drake, underlain by strongly calcareous sediments from lakebeds. E, F, Arch and Portales, underlain by strongly calcareous valley fill of mixed wind- and water-deposited materials. G, Blackwater, underlain by valley fill and, in turn, by hard caliche at moderate depths. H, Clovis, underlain by mixed water- and wind-deposited sediments from the High Plains upland. I, J, K, Kimbrough, Amarillo, and Arvana, underlain by mixed water- and wind-deposited materials from the High Plains upland; Kimbrough soils underlain by hard caliche at shallow depth, and Arvana soils by hard caliche at moderate depth. L, M, Springer (deep) and Tivoli (very deep), underlain by wind-deposited sands (Soil Survey of Portales Area, New Mexico; May 1959).

  25. NM-2012-02-15-01 | Roosevelt County - March 1967

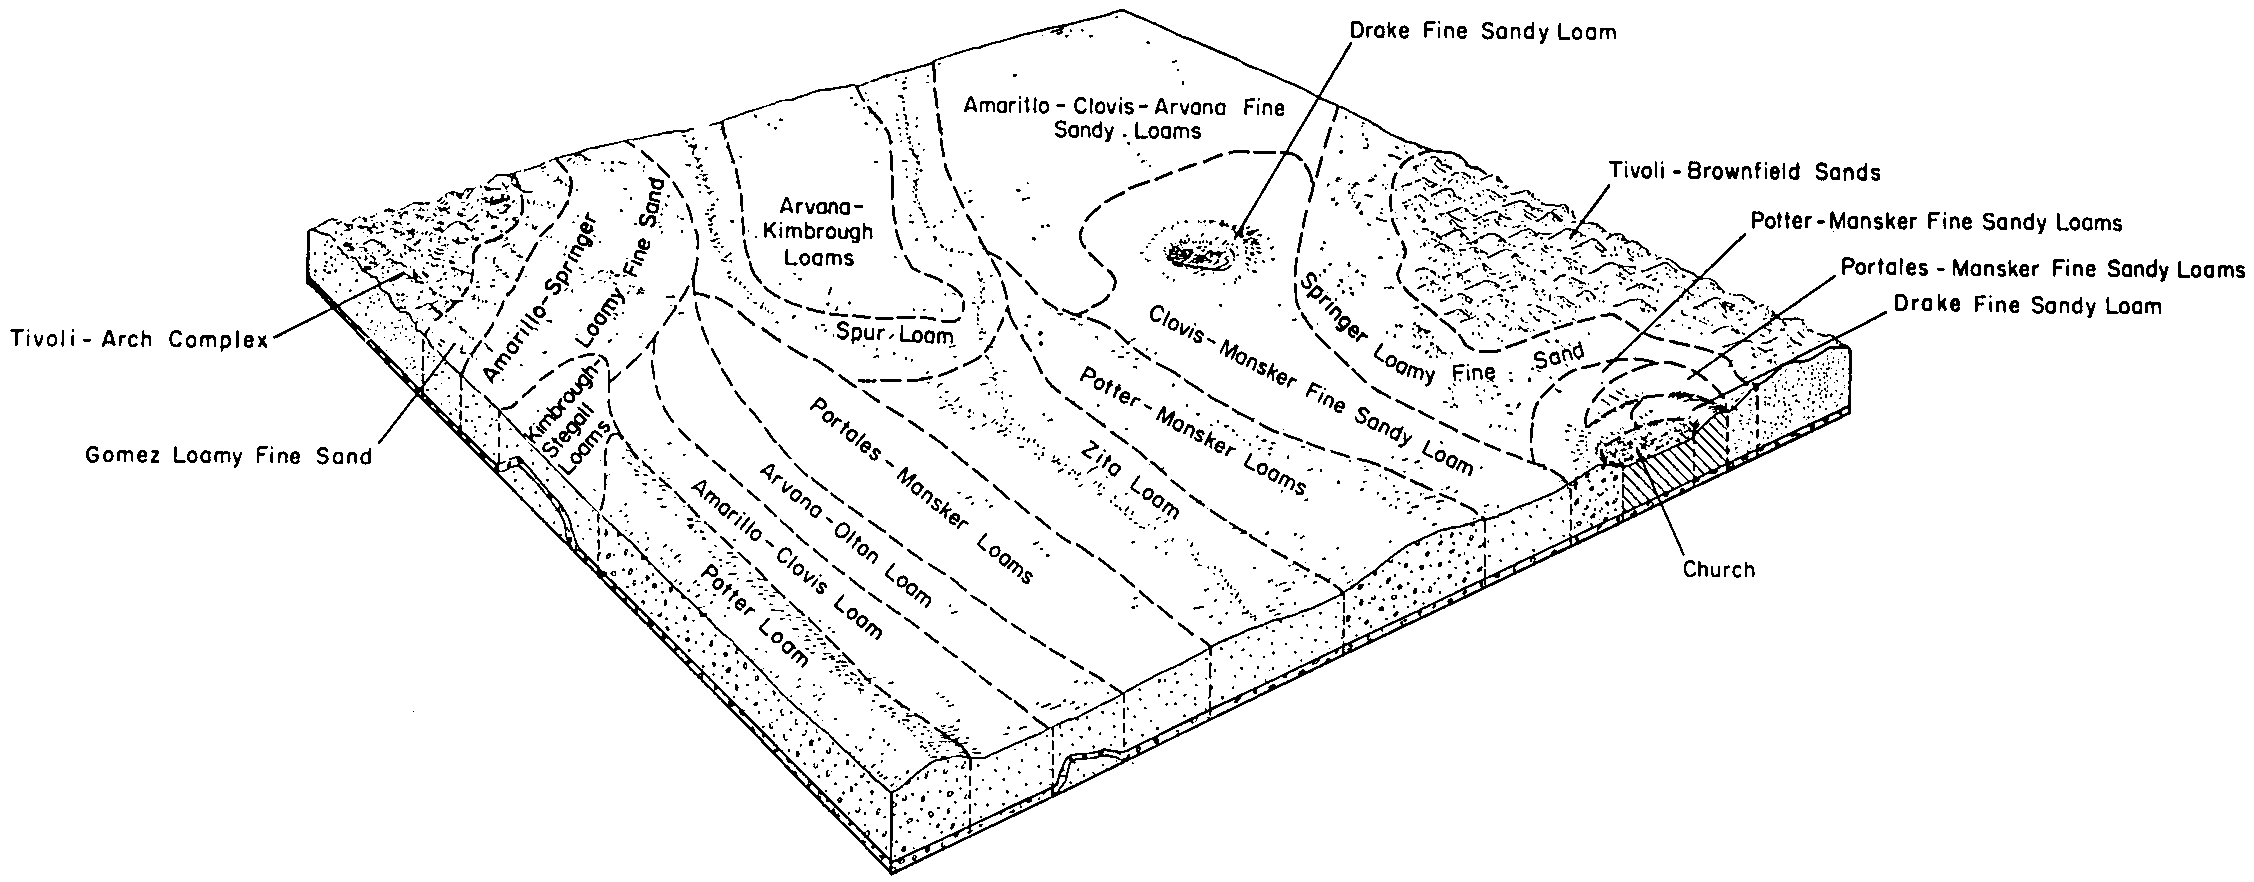
    Generalized diagram of soil patterns that extend southwest to northeast through Roosevelt County (Soil Survey of Roosevelt County, New Mexico; March 1967).

  26. OK-2010-09-29-19 | Woods County - 2003

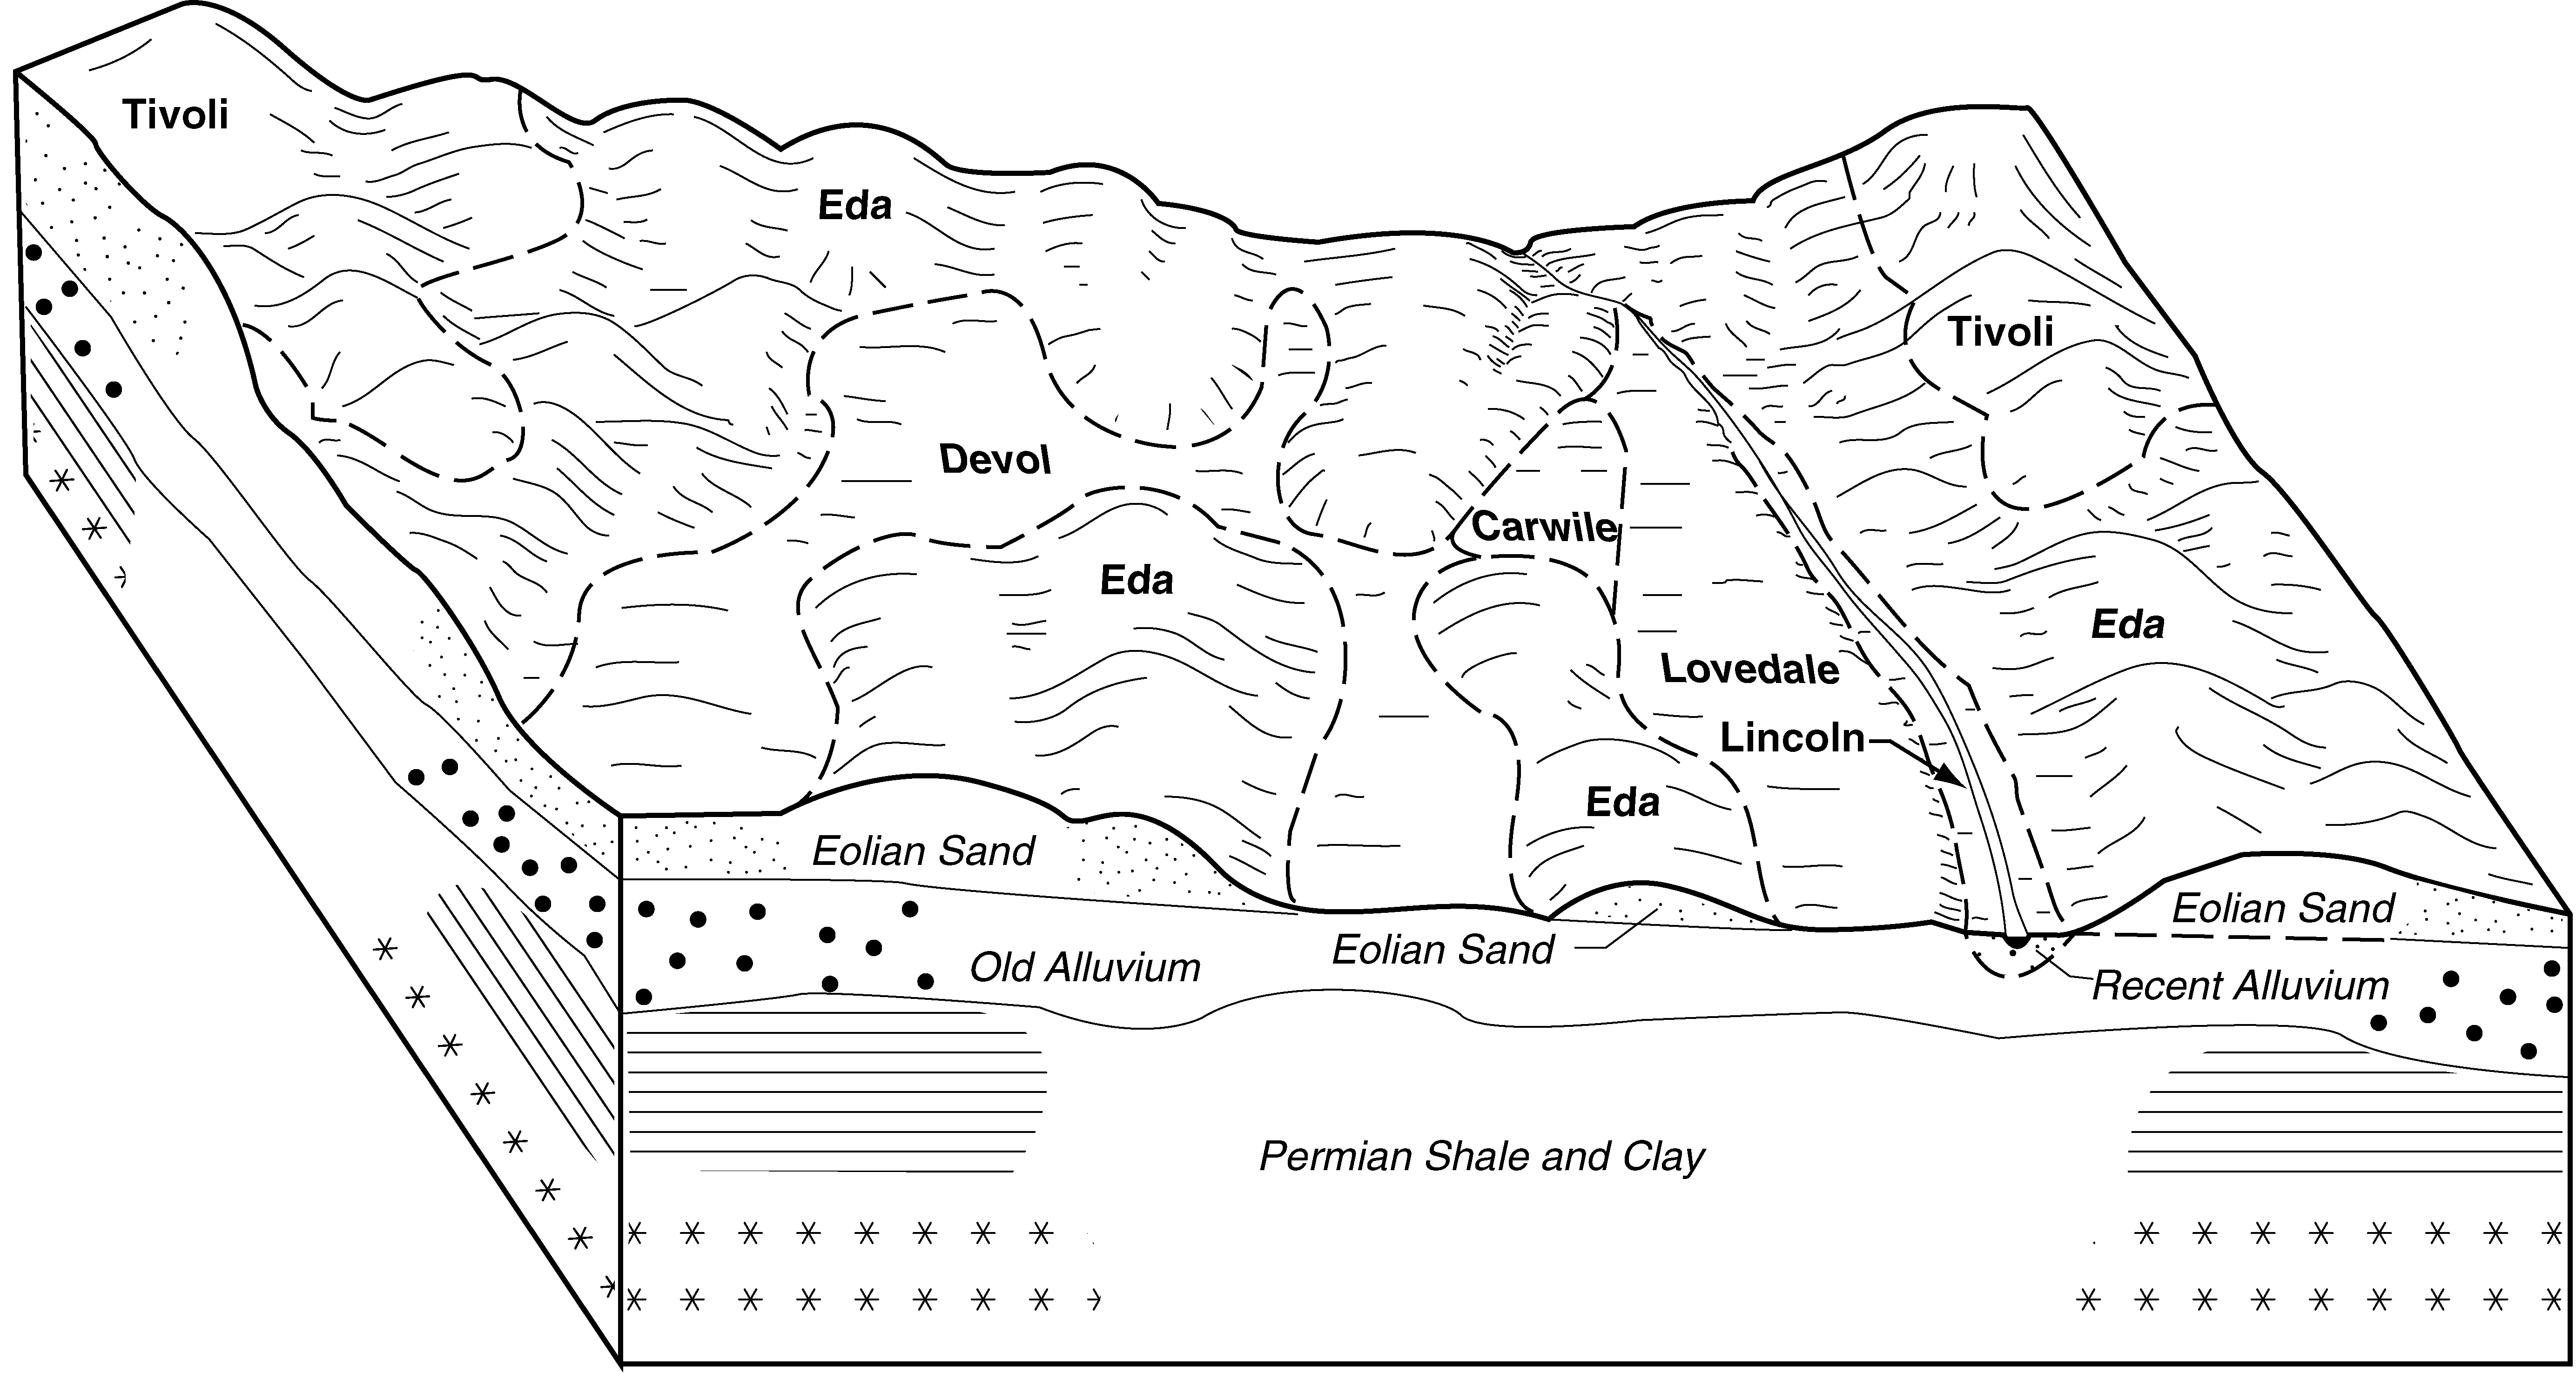
    Typical pattern of soils and underlying material in the Eda-Devol-Lovedale general soil map unit (Soil Survey of Woods County, Oklahoma; 2003).

  27. OK-2012-02-16-03 | Beaver County - August 1962

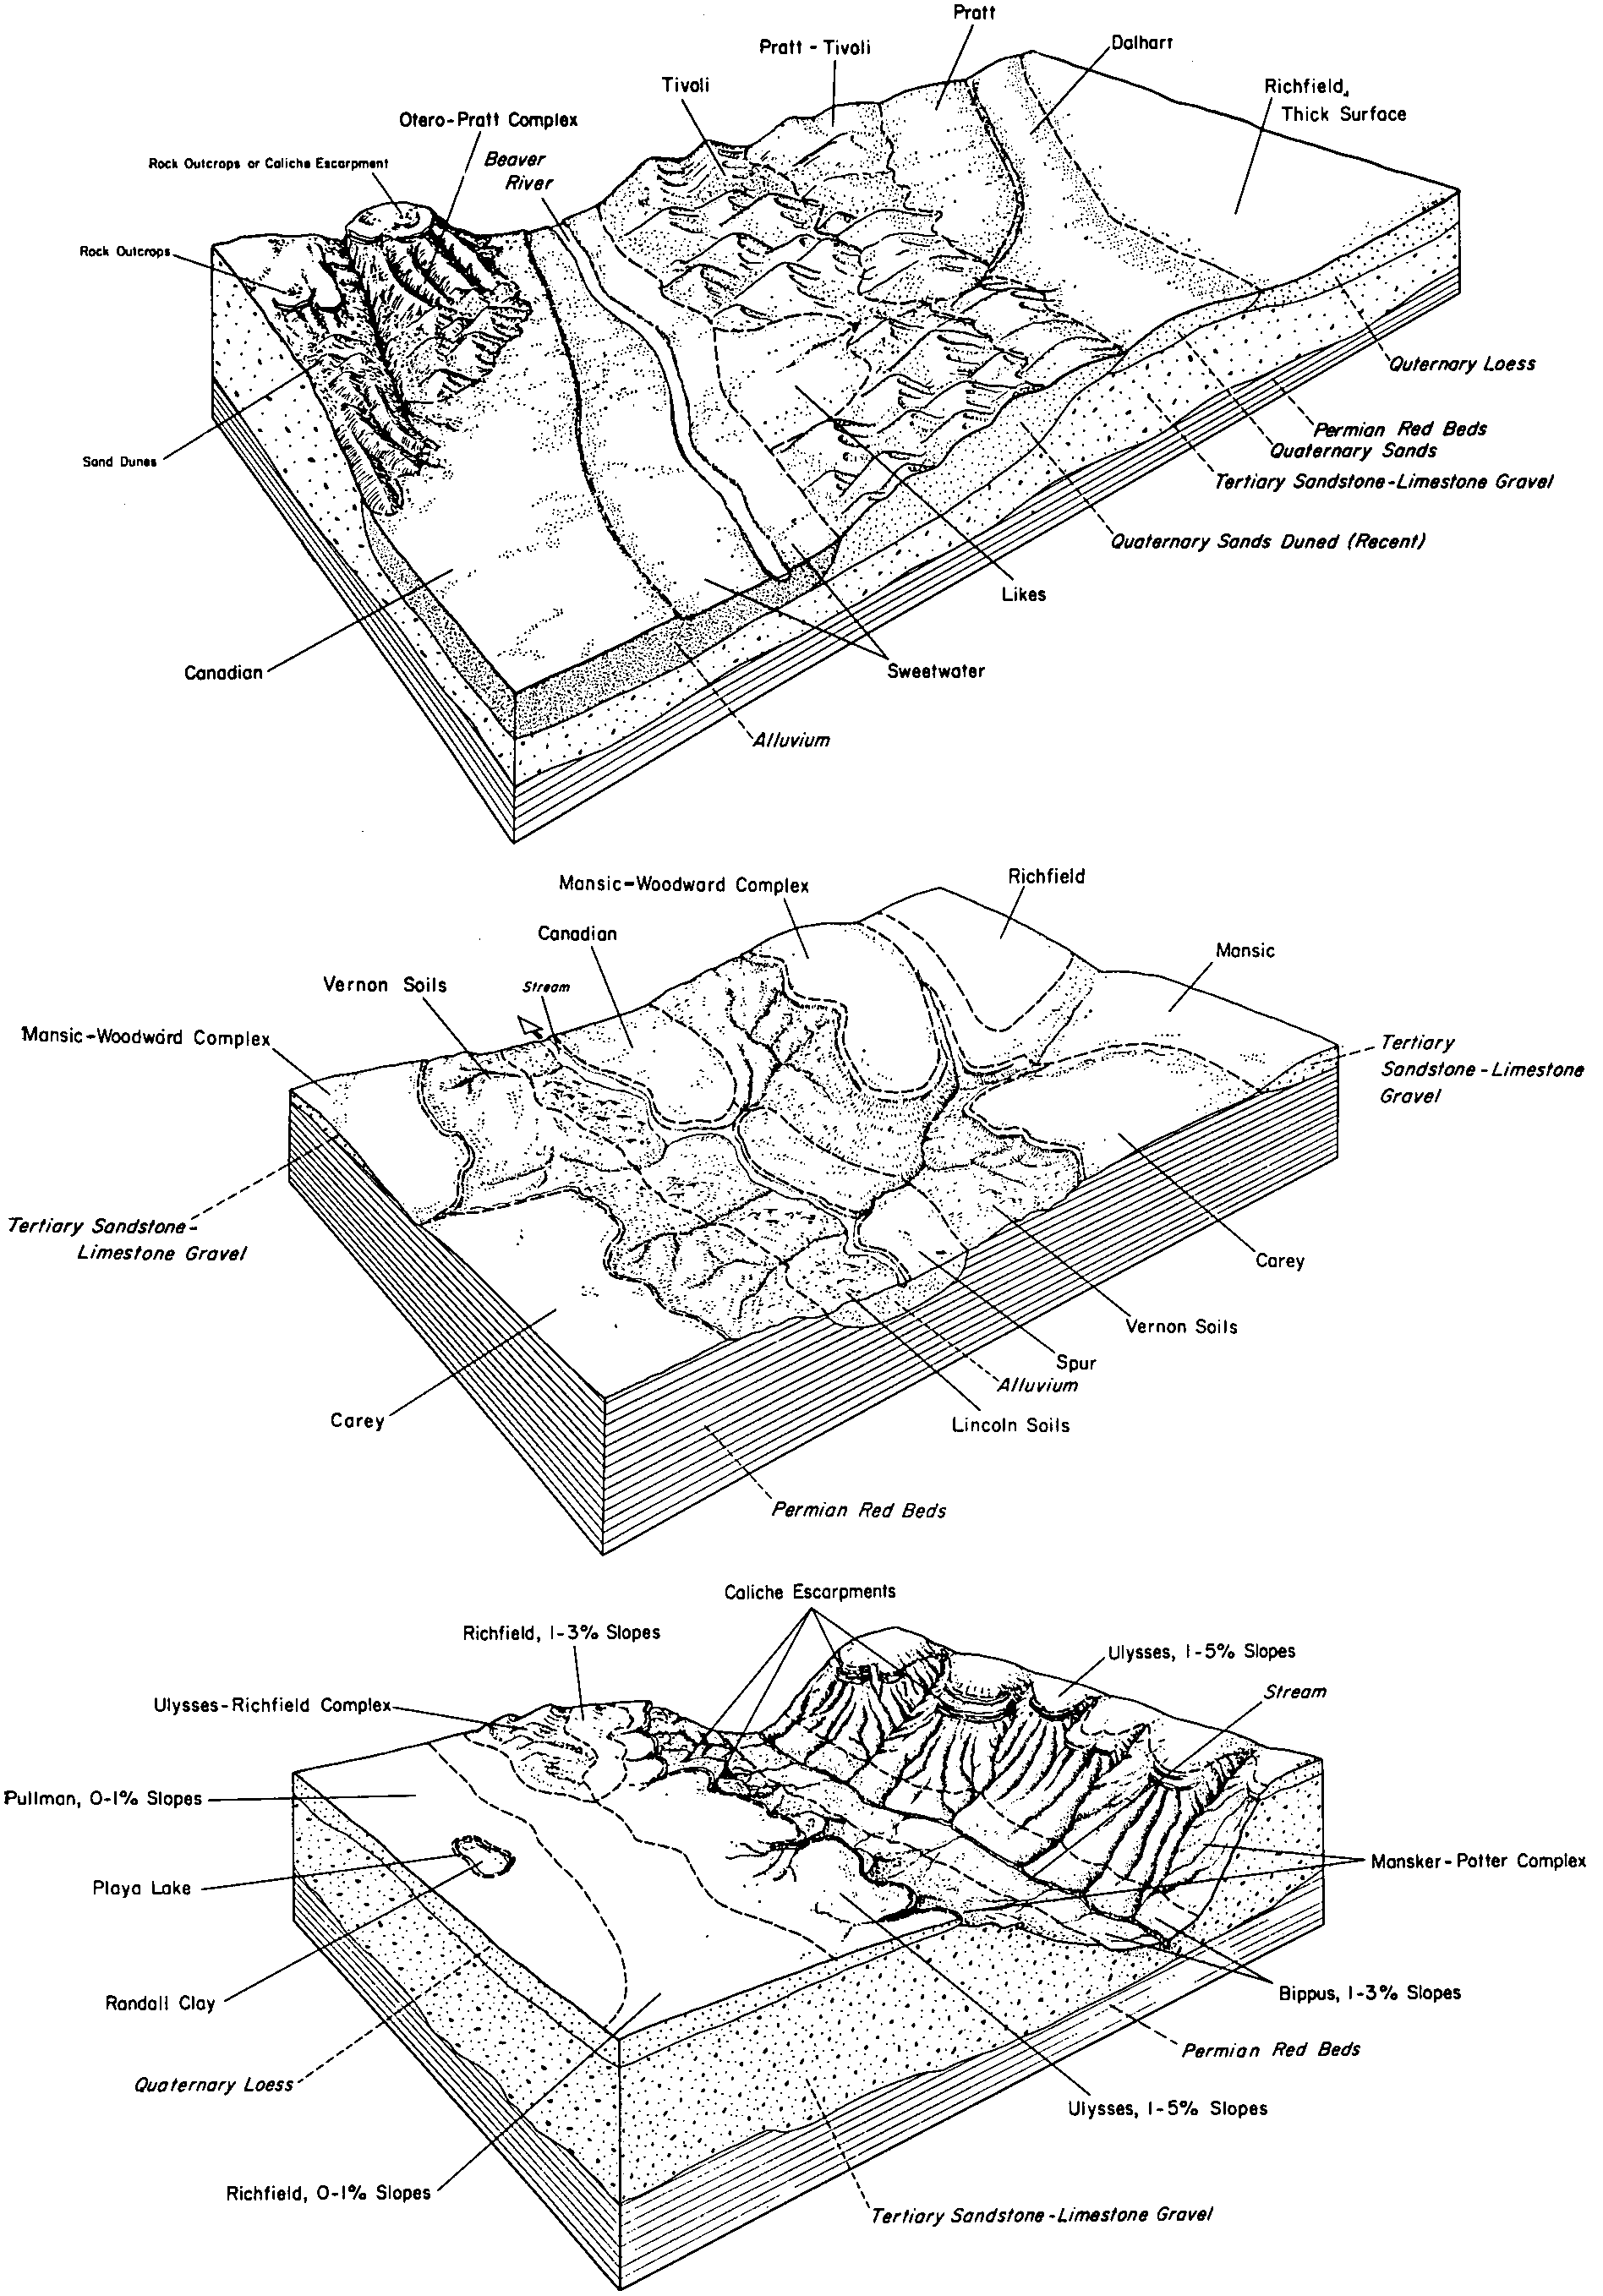
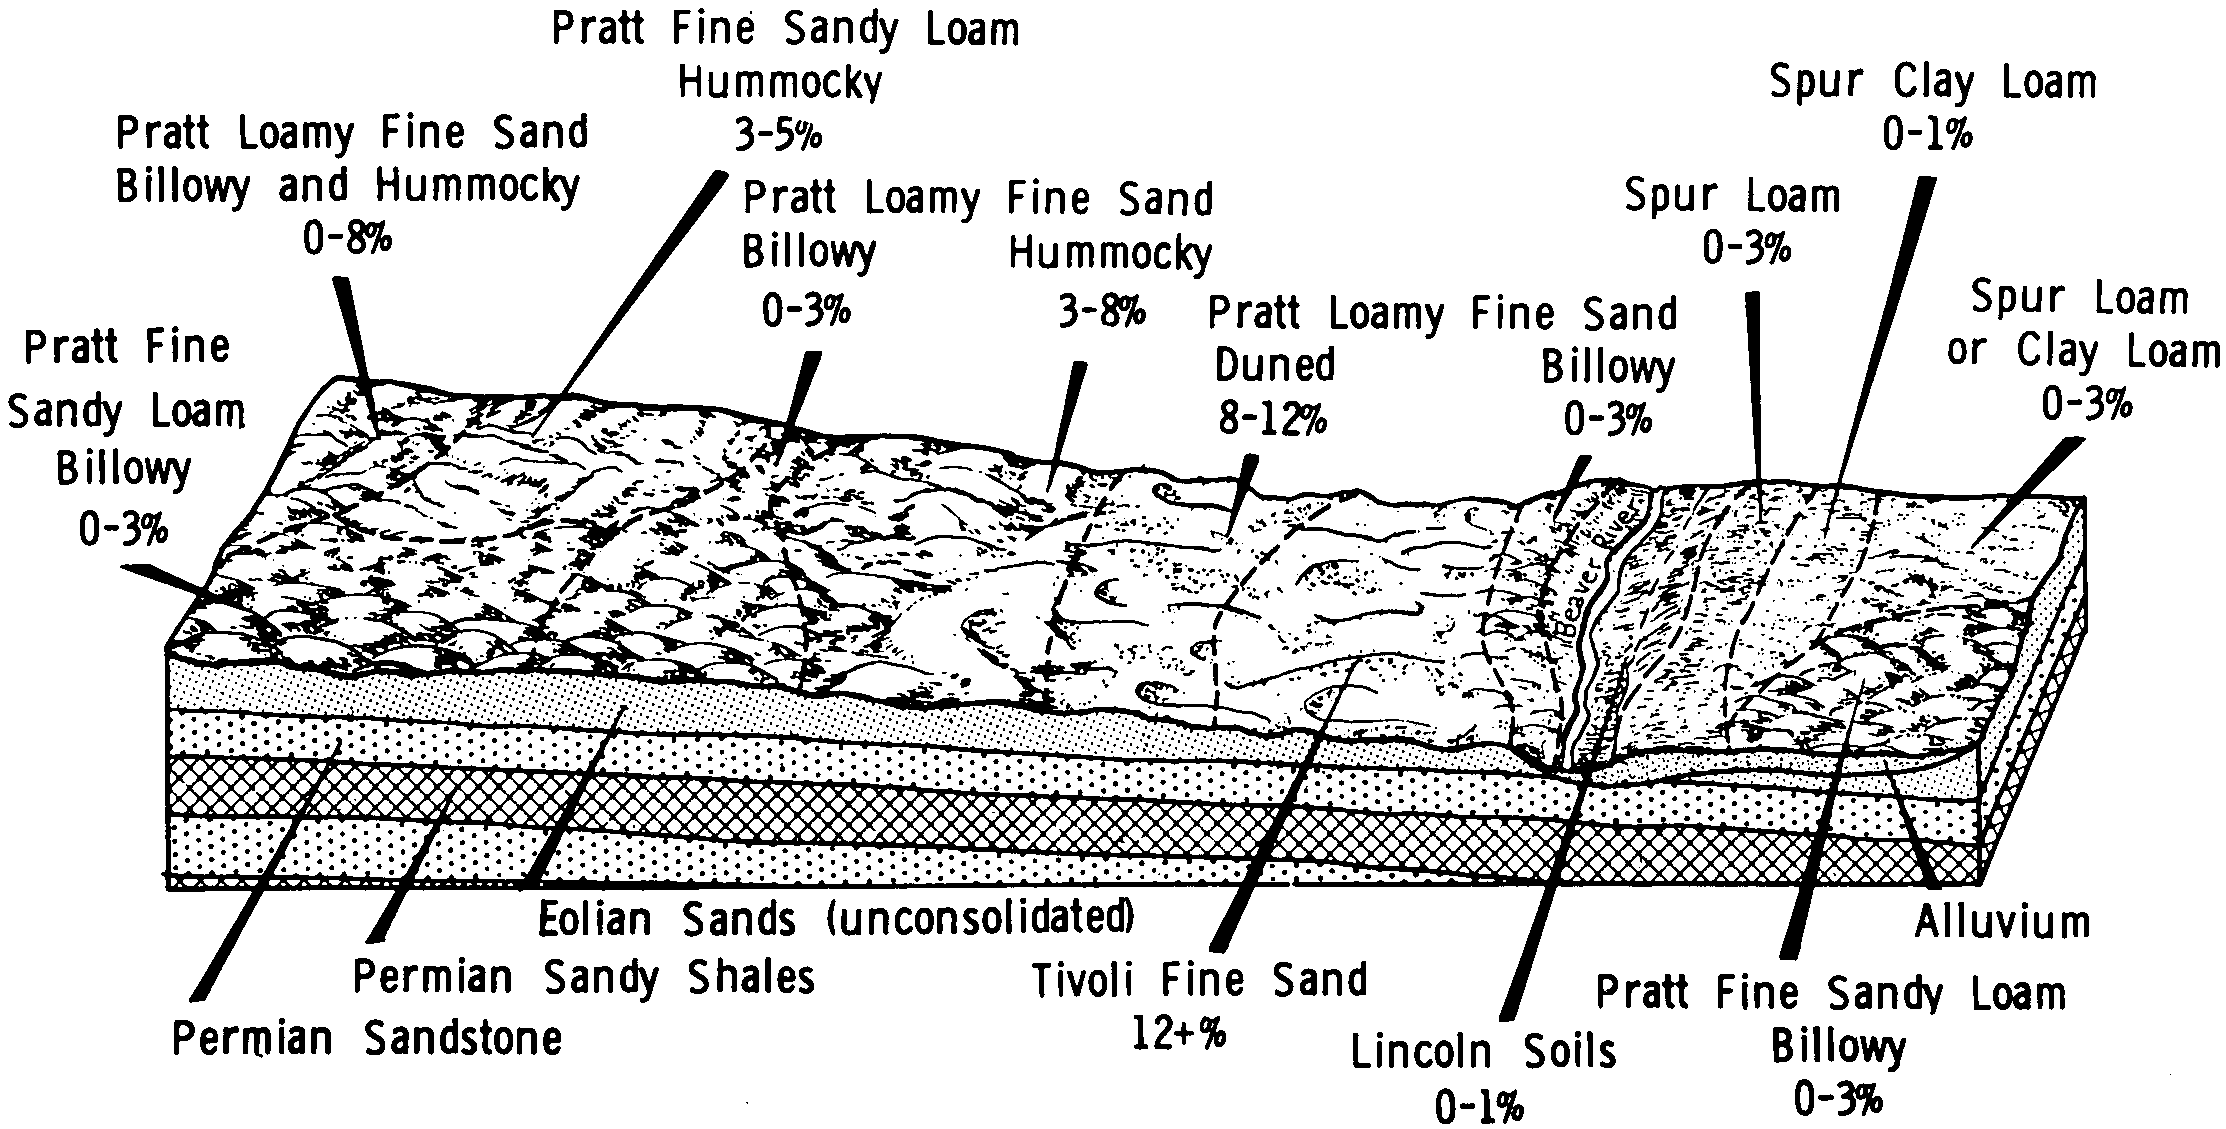
    Parent material and parent rock of most of the soils in Beaver County, and their position on the landscape (Soil Survey of Beaver County, Oklahoma; August 1962).

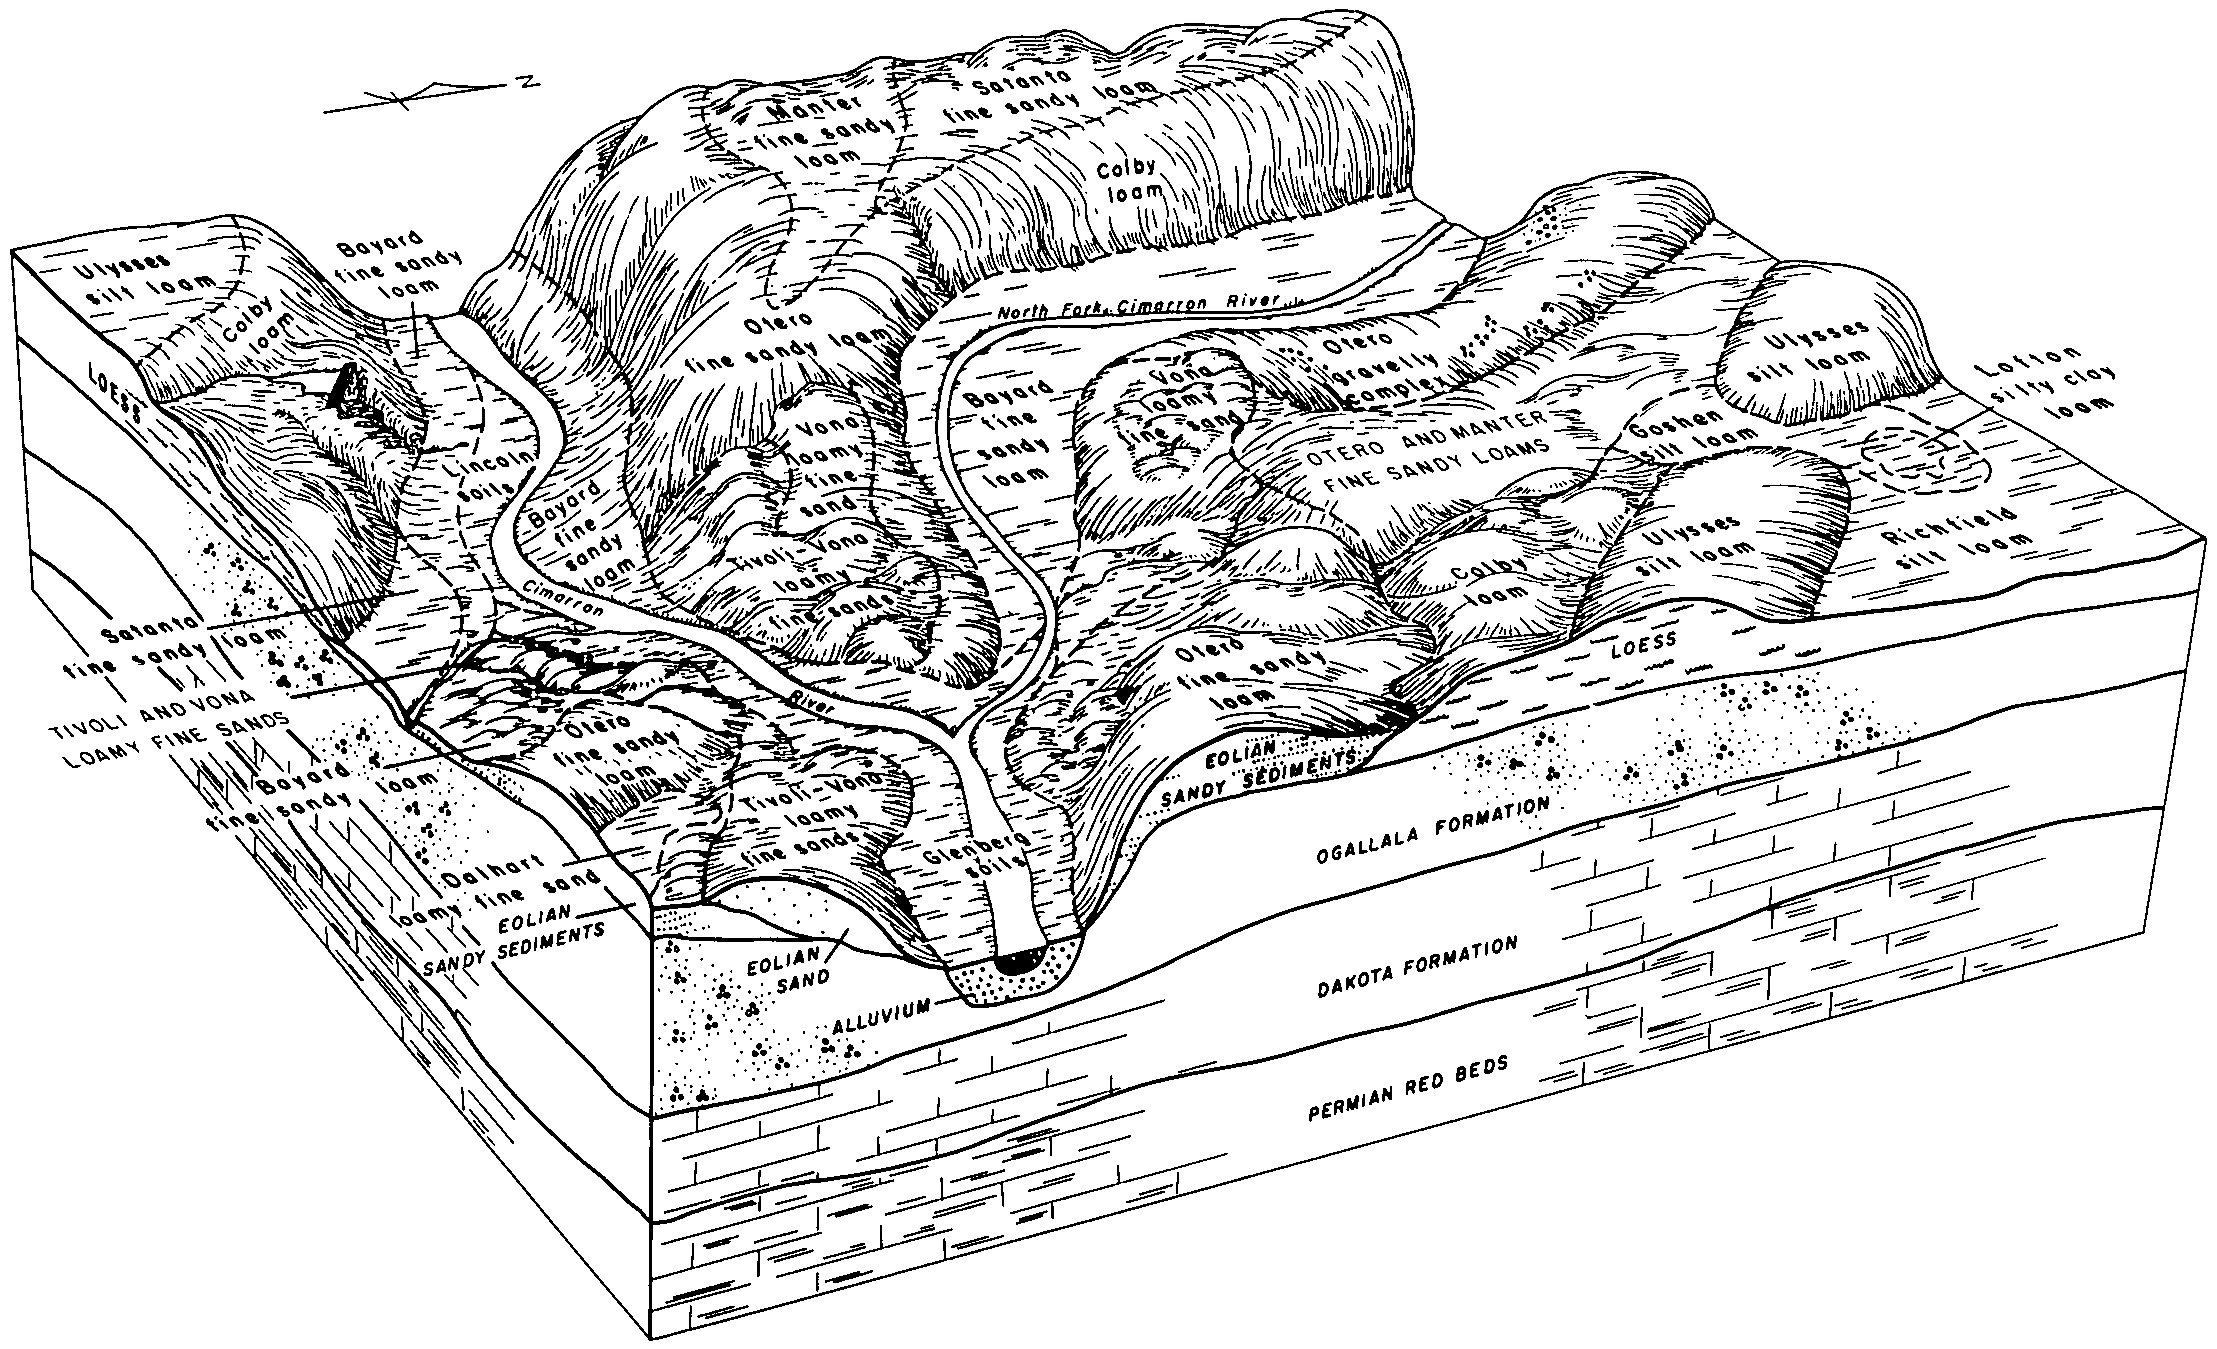
  28. OK-2012-02-16-09 | Cimarron County - June 1960

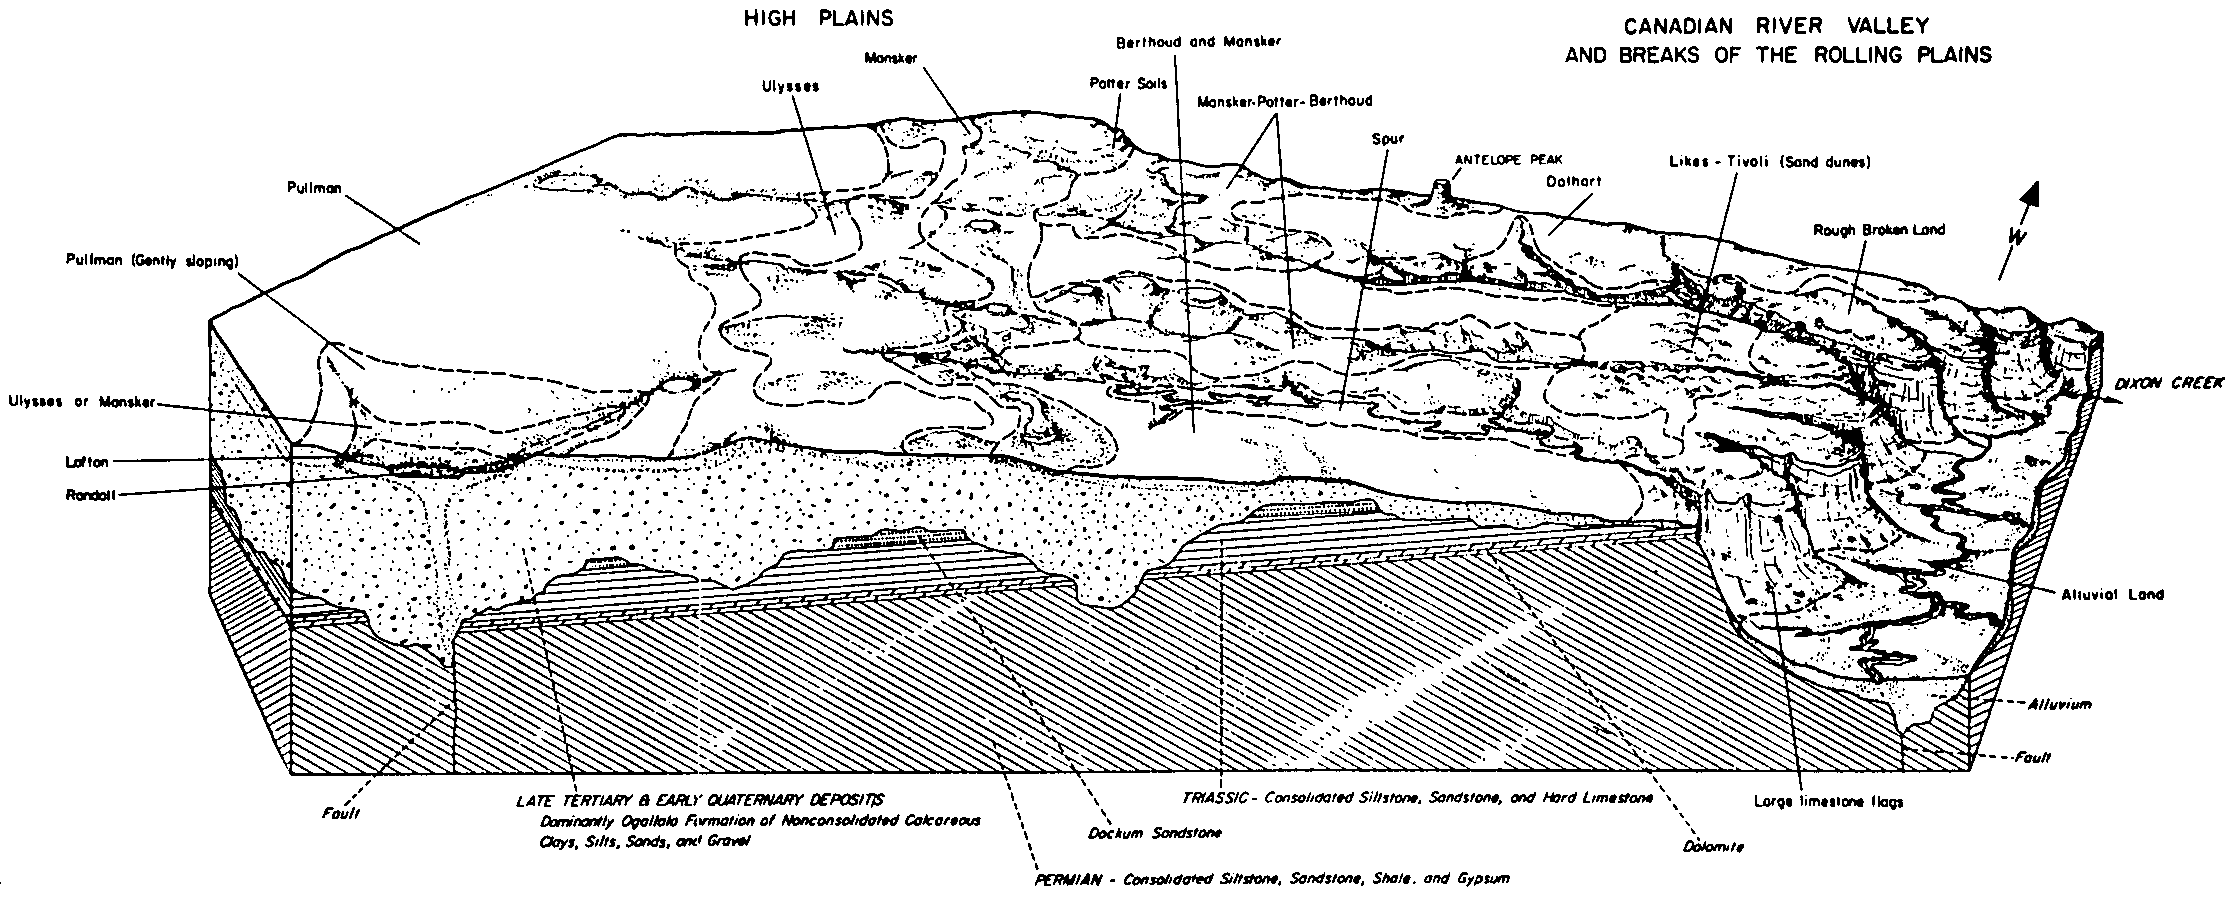
    Typical landscape in the central and eastern part of Cimarron County: Associations 1, 2, 3, and 5 (Soil Survey of Cimarron County, Oklahoma; June 1960).

  29. OK-2012-02-16-21 | Cotton County - December 1963

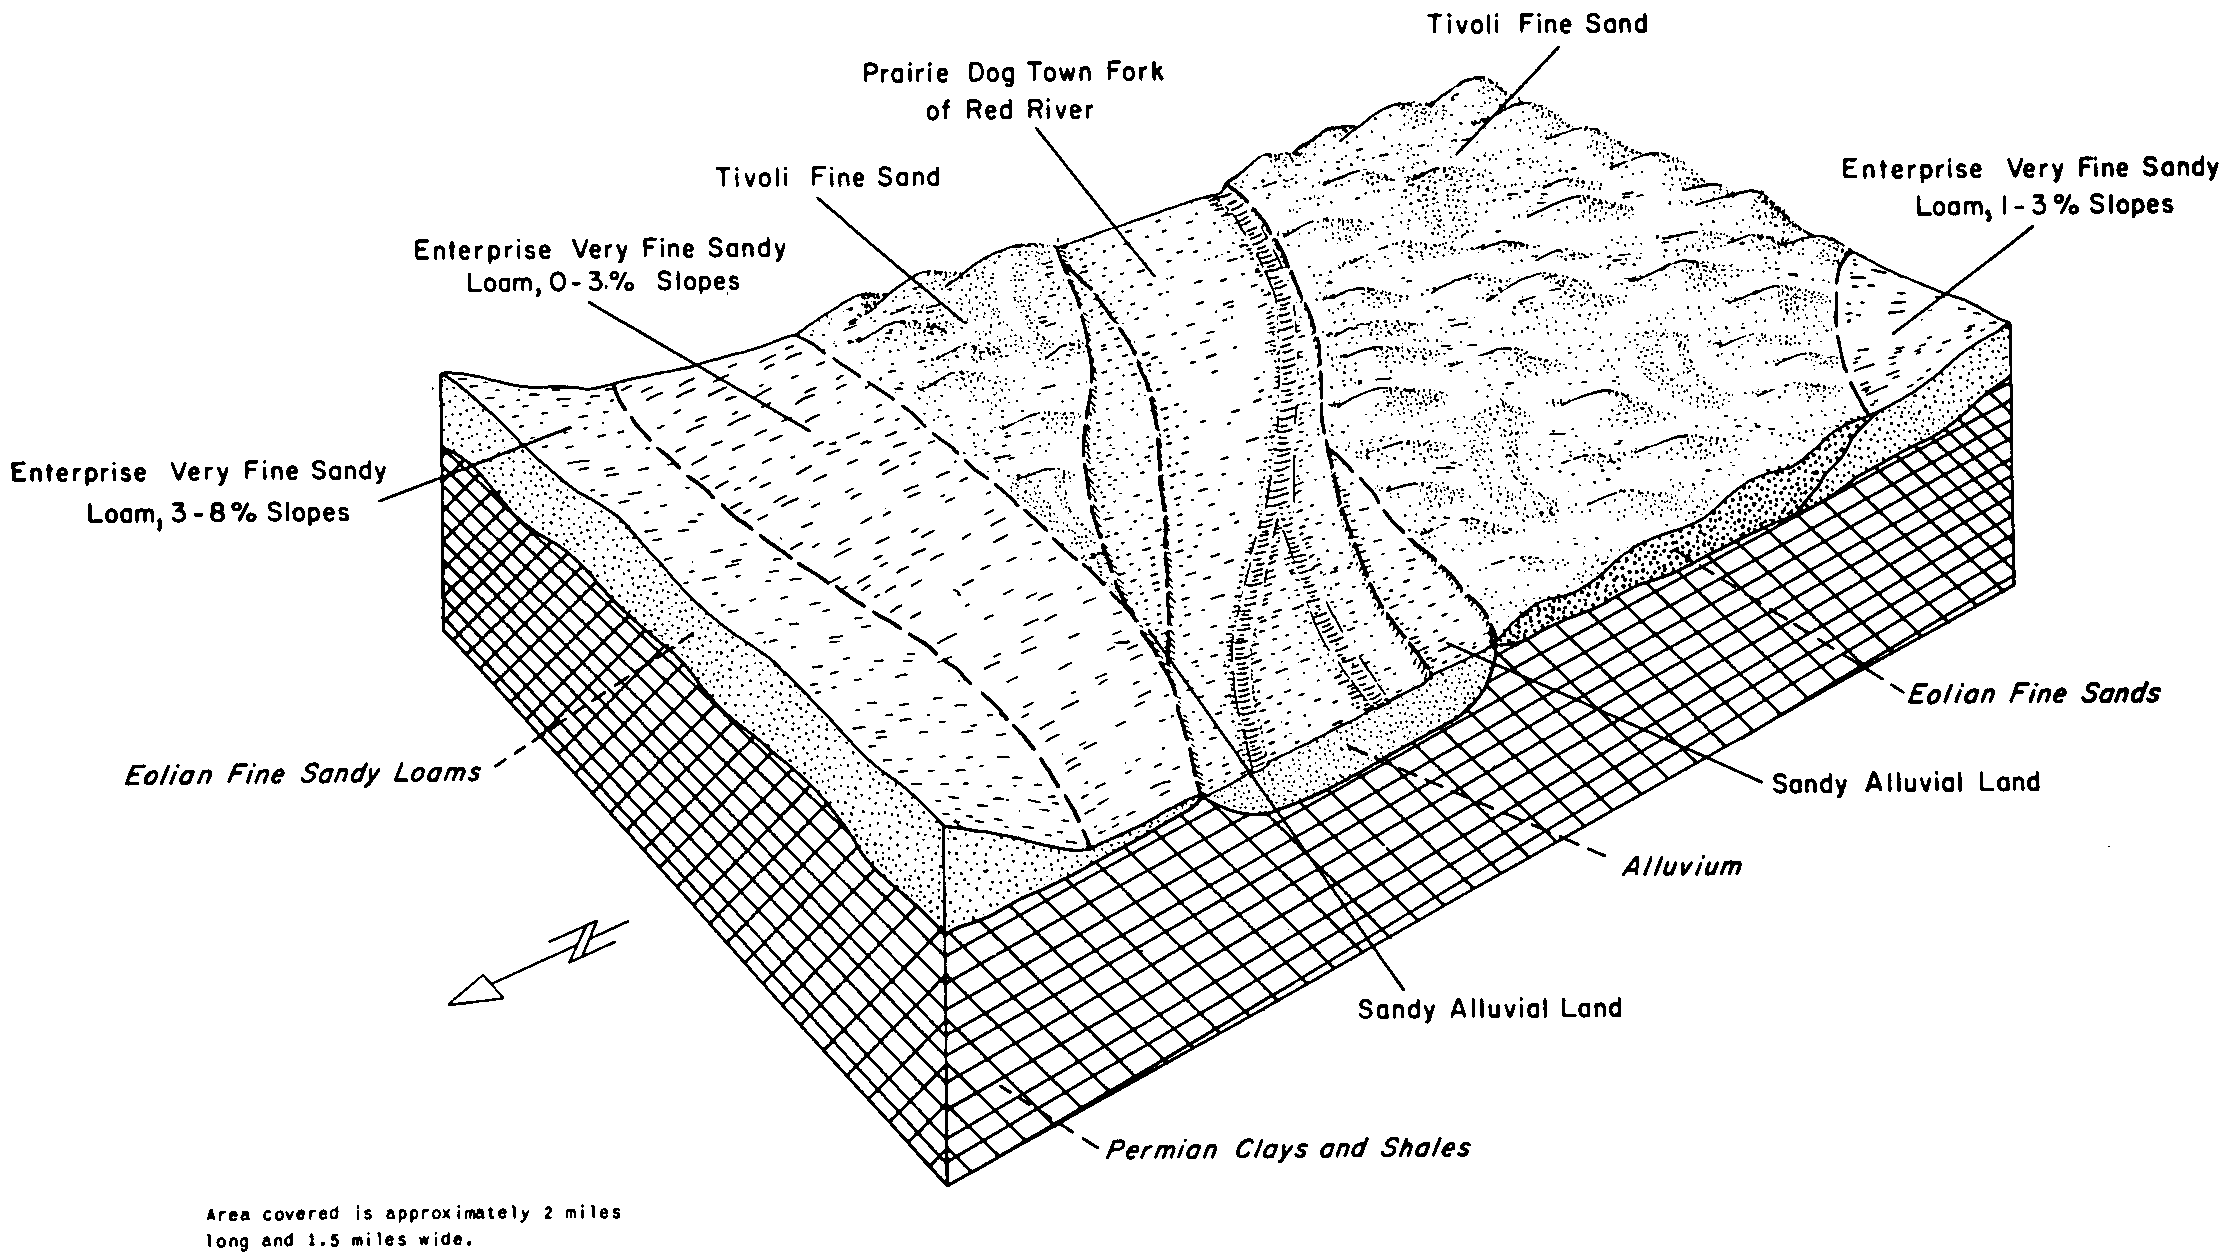
    Typical pattern of Pratt, Tivoli, and associated soils (Soil Survey of Cotton County, Oklahoma; December 1963).

  30. OK-2012-02-16-26 | Dewey County - December 1963

    Typical pattern of the soils in association 4 (Soil Survey of Dewey County, Oklahoma; December 1963).

  31. OK-2012-02-16-27 | Dewey County - December 1963

    Typical pattern of most of the soils in association 5 (Soil Survey of Dewey County, Oklahoma; December 1963).

  32. OK-2012-02-16-35 | Greer County - March 1967

    Major soils in soil association 1, and their relation to the landscape (Soil Survey of Greer County, Oklahoma; March 1967).

  33. OK-2012-02-16-46 | Harper County - June 1960

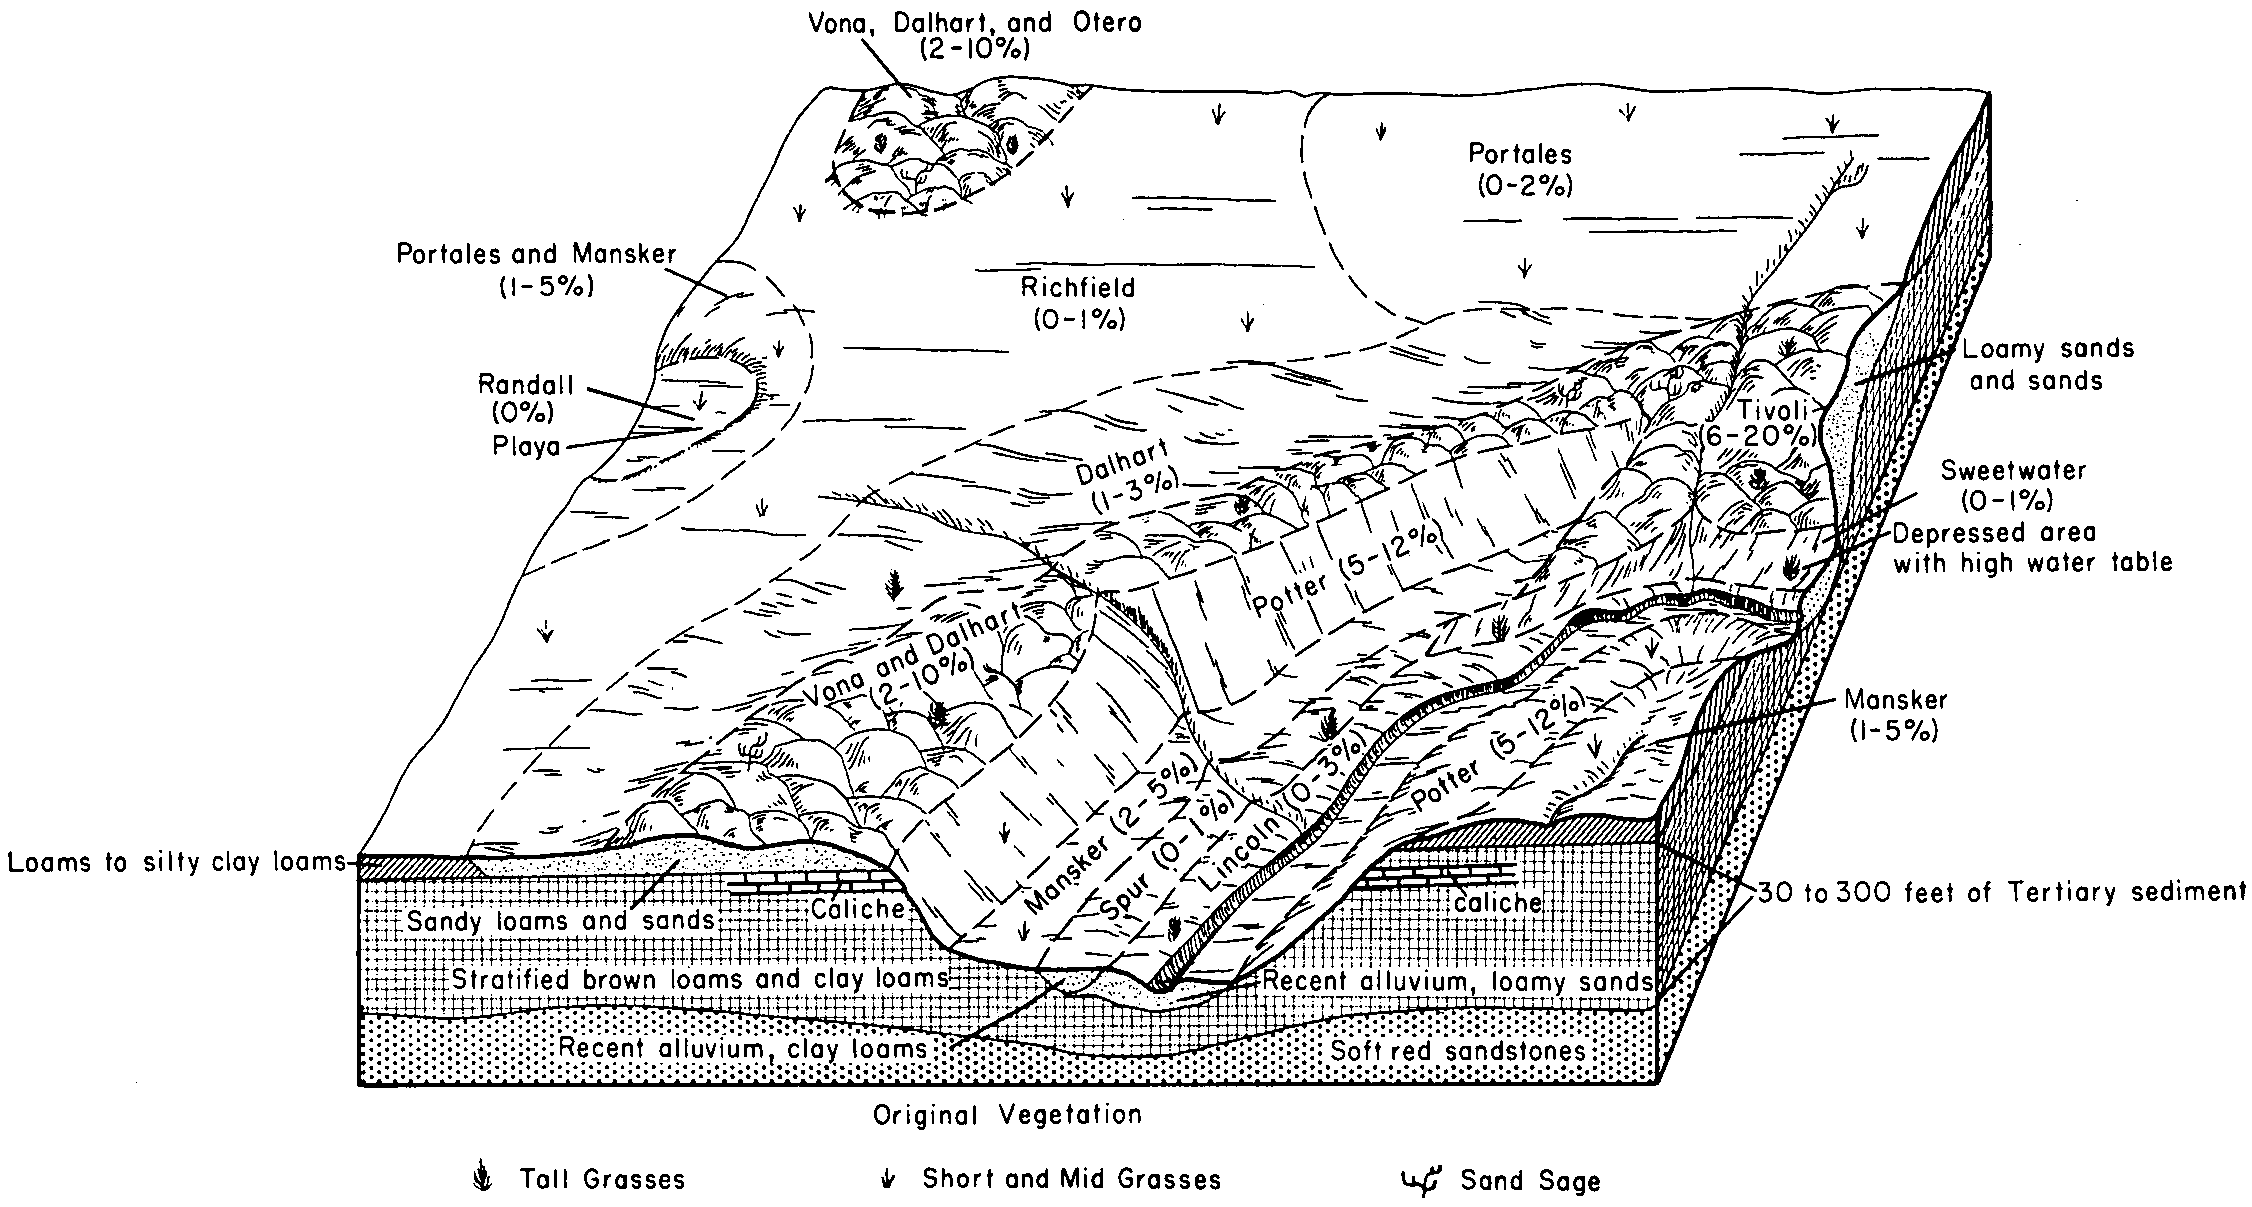
    A schematic drawing showing a normal pattern of soils formed on alluvial plains and on windblown sands. The typical slope range is given for each soil (Soil Survey of Harper County, Oklahoma; June 1960).

  34. OK-2012-02-16-52 | Jackson County - June 1961

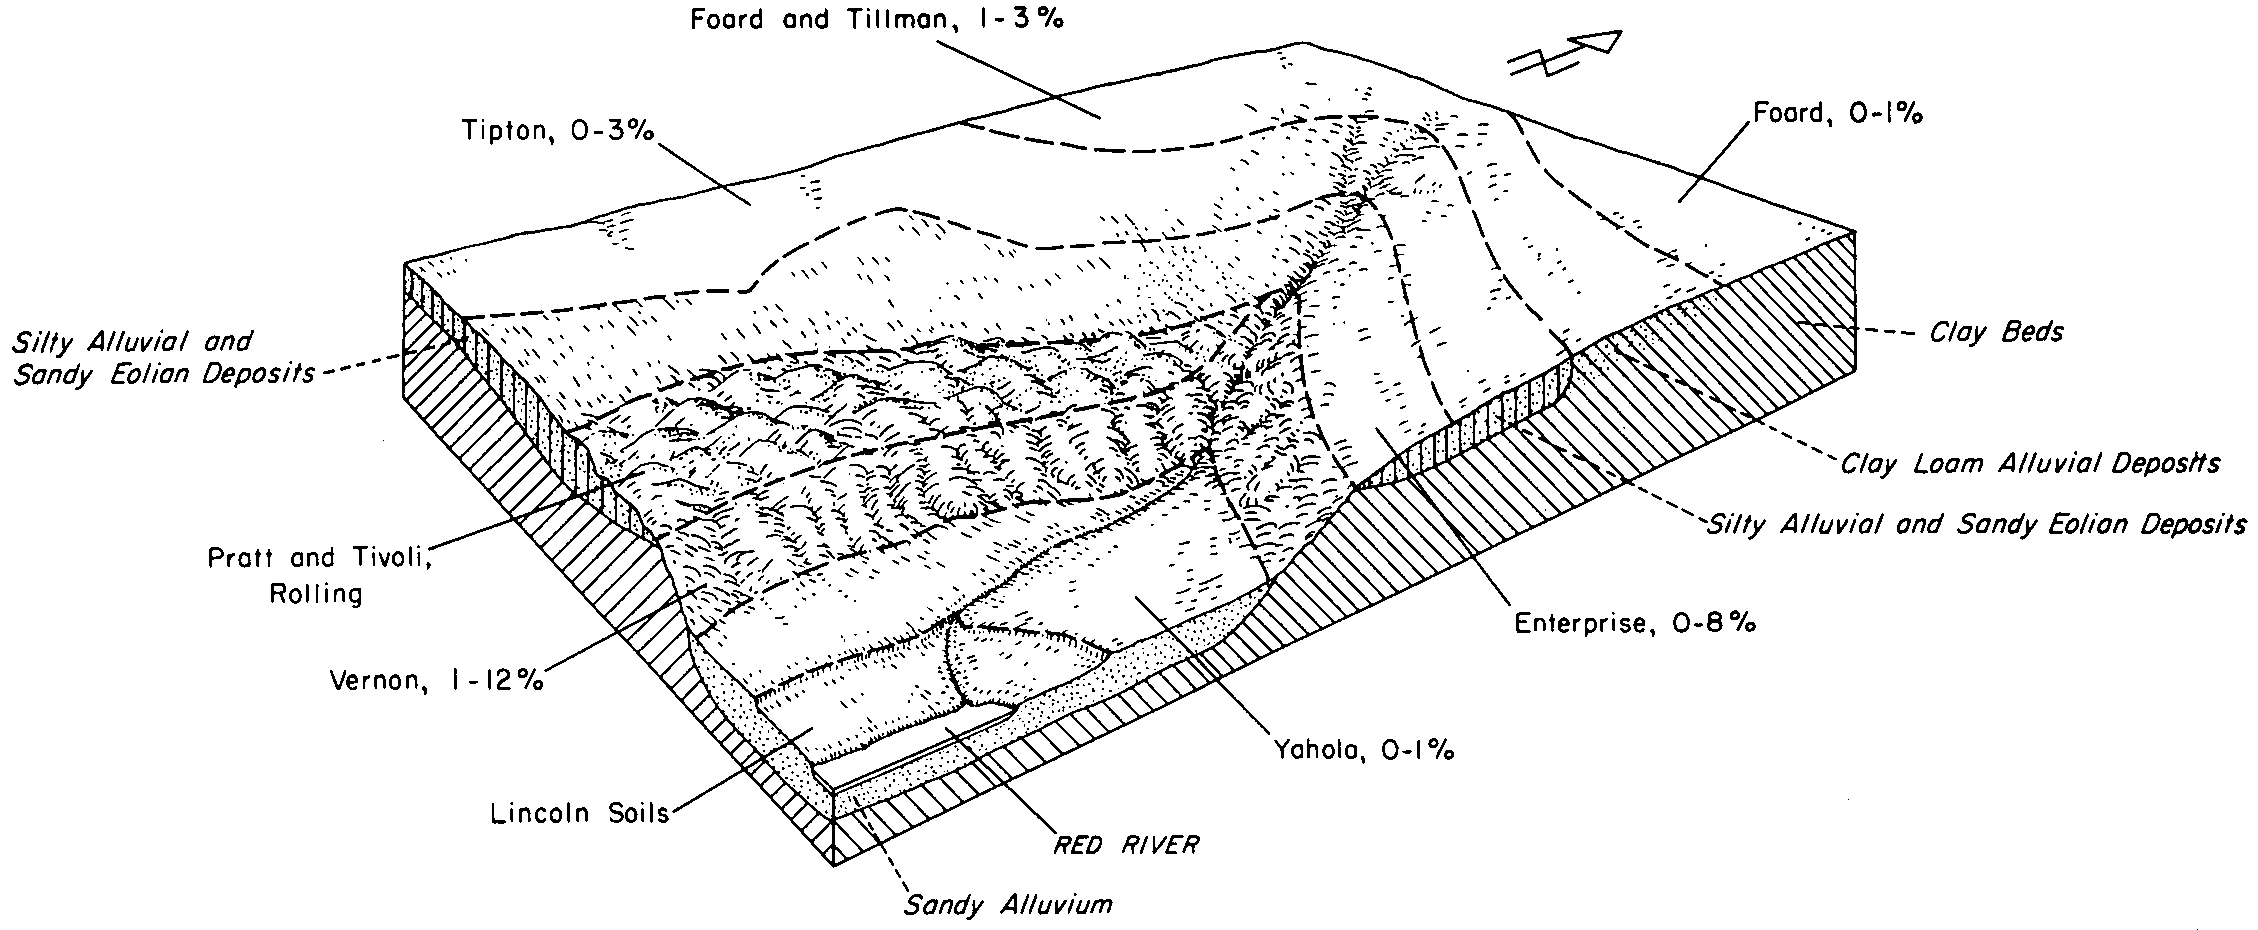
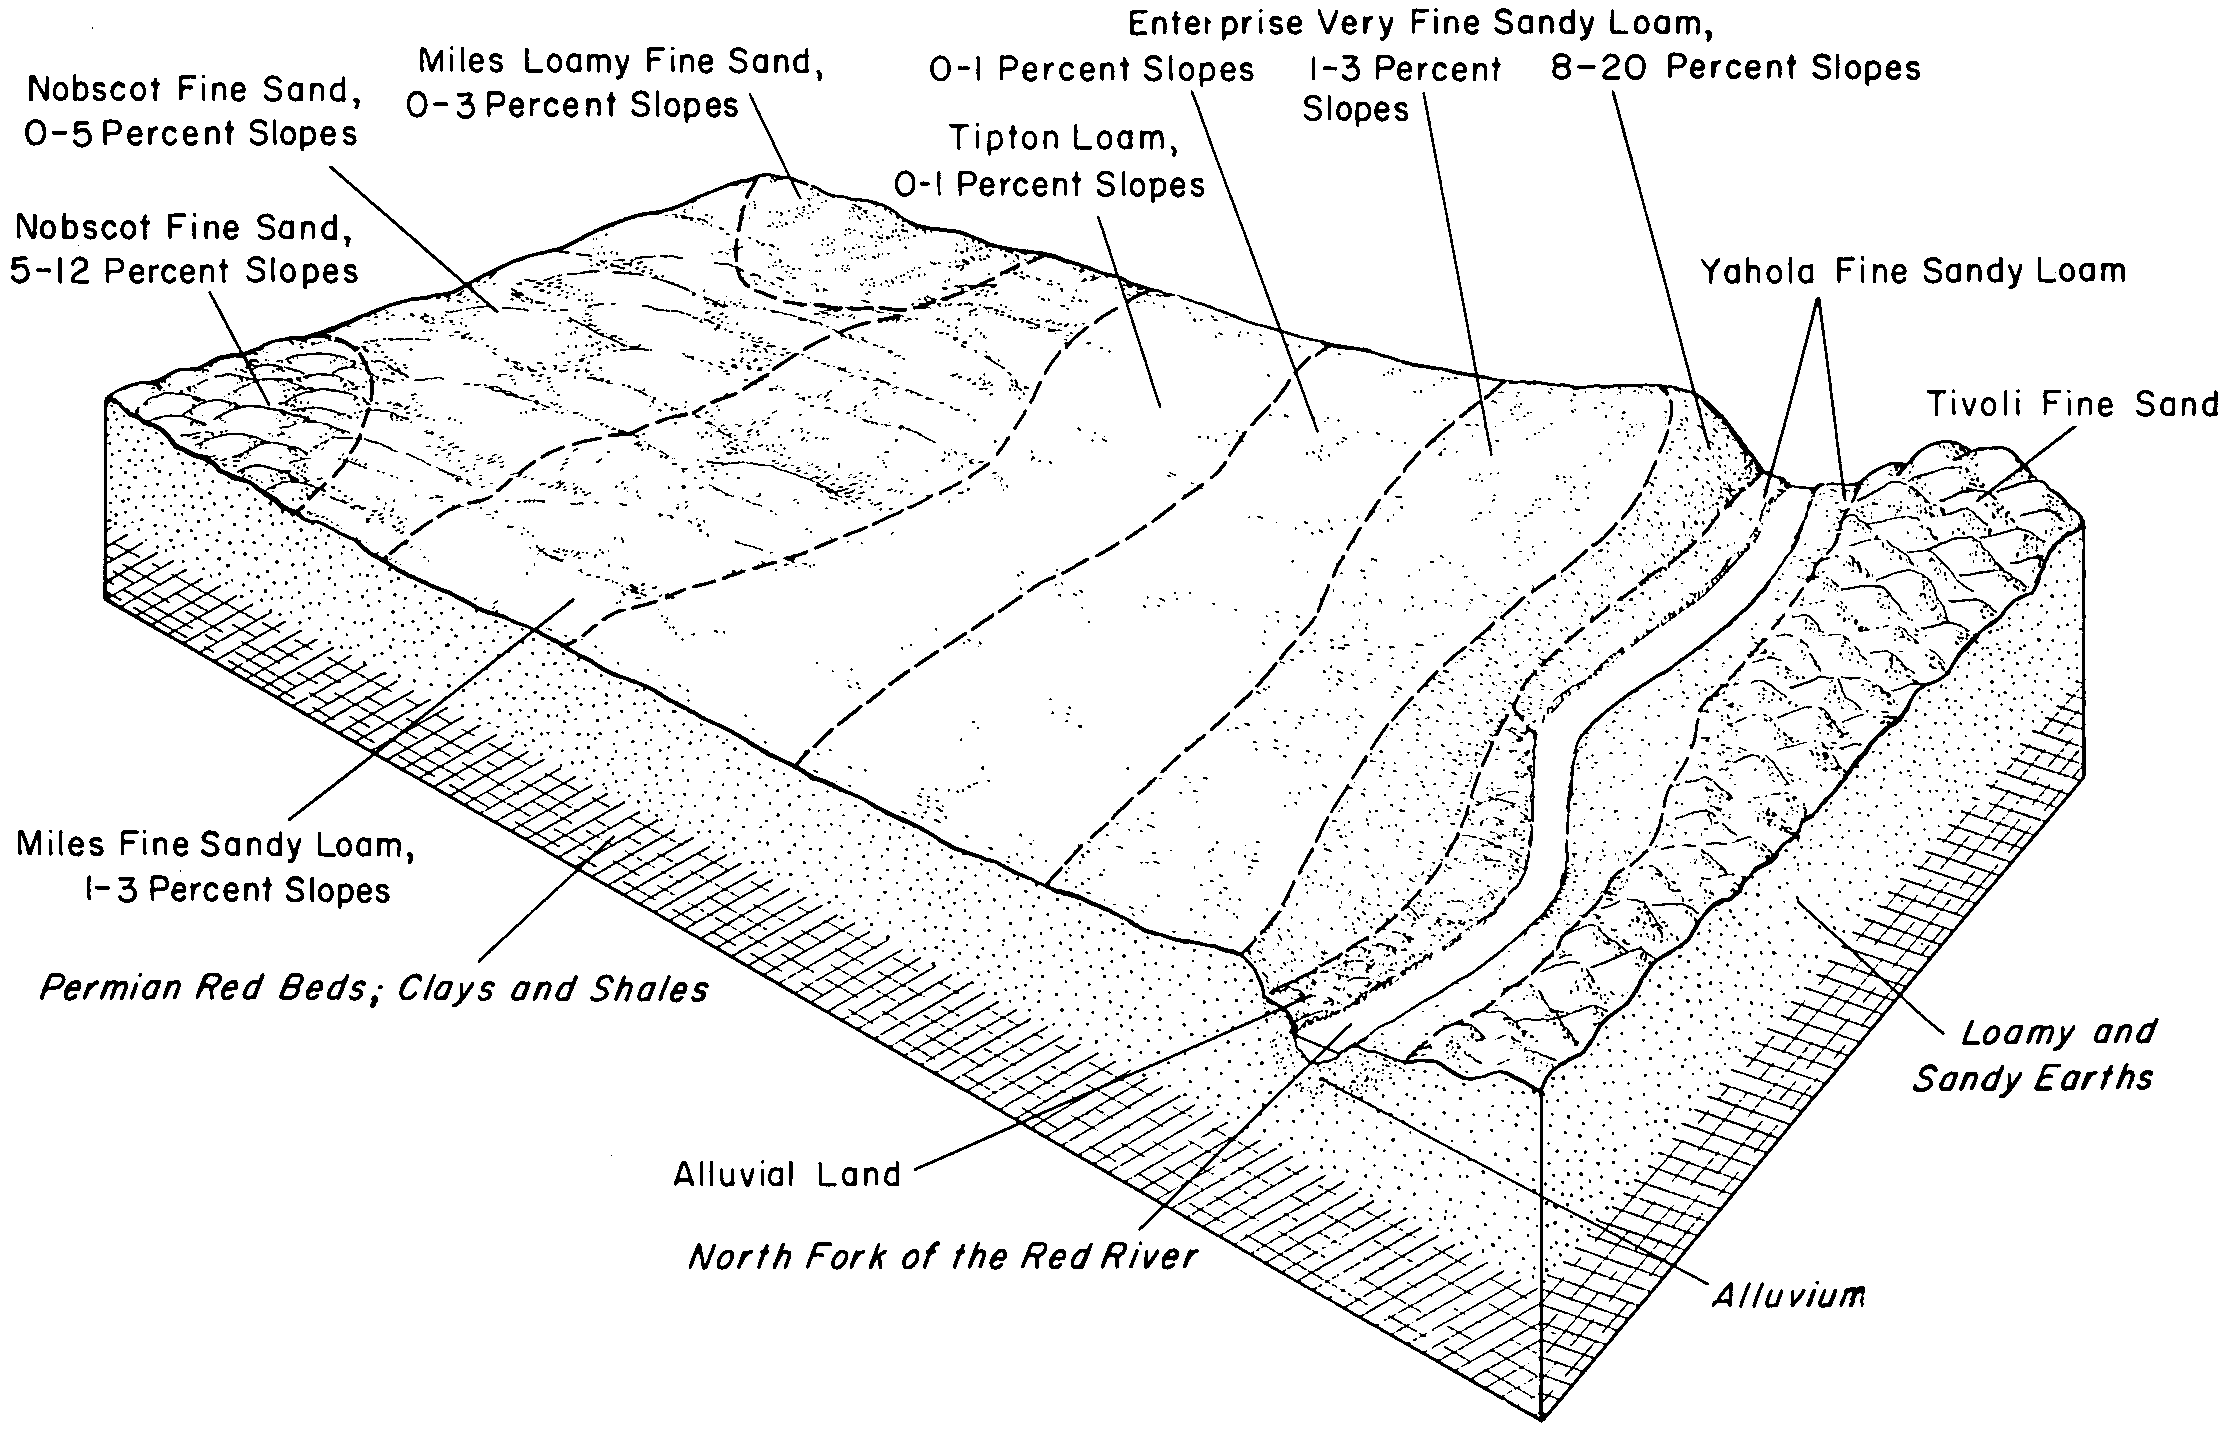
    Typical pattern of Miles, Enterprise, Tivoli, and associated soil (Soil Survey of Jackson County, Oklahoma; June 1961).

  35. OK-2012-02-17-12 | Major County - October 1968

    Soil associations in the central part of the county (Soil Survey of Major County, Oklahoma; October 1968).

  36. OK-2012-02-17-13 | Major County - October 1968

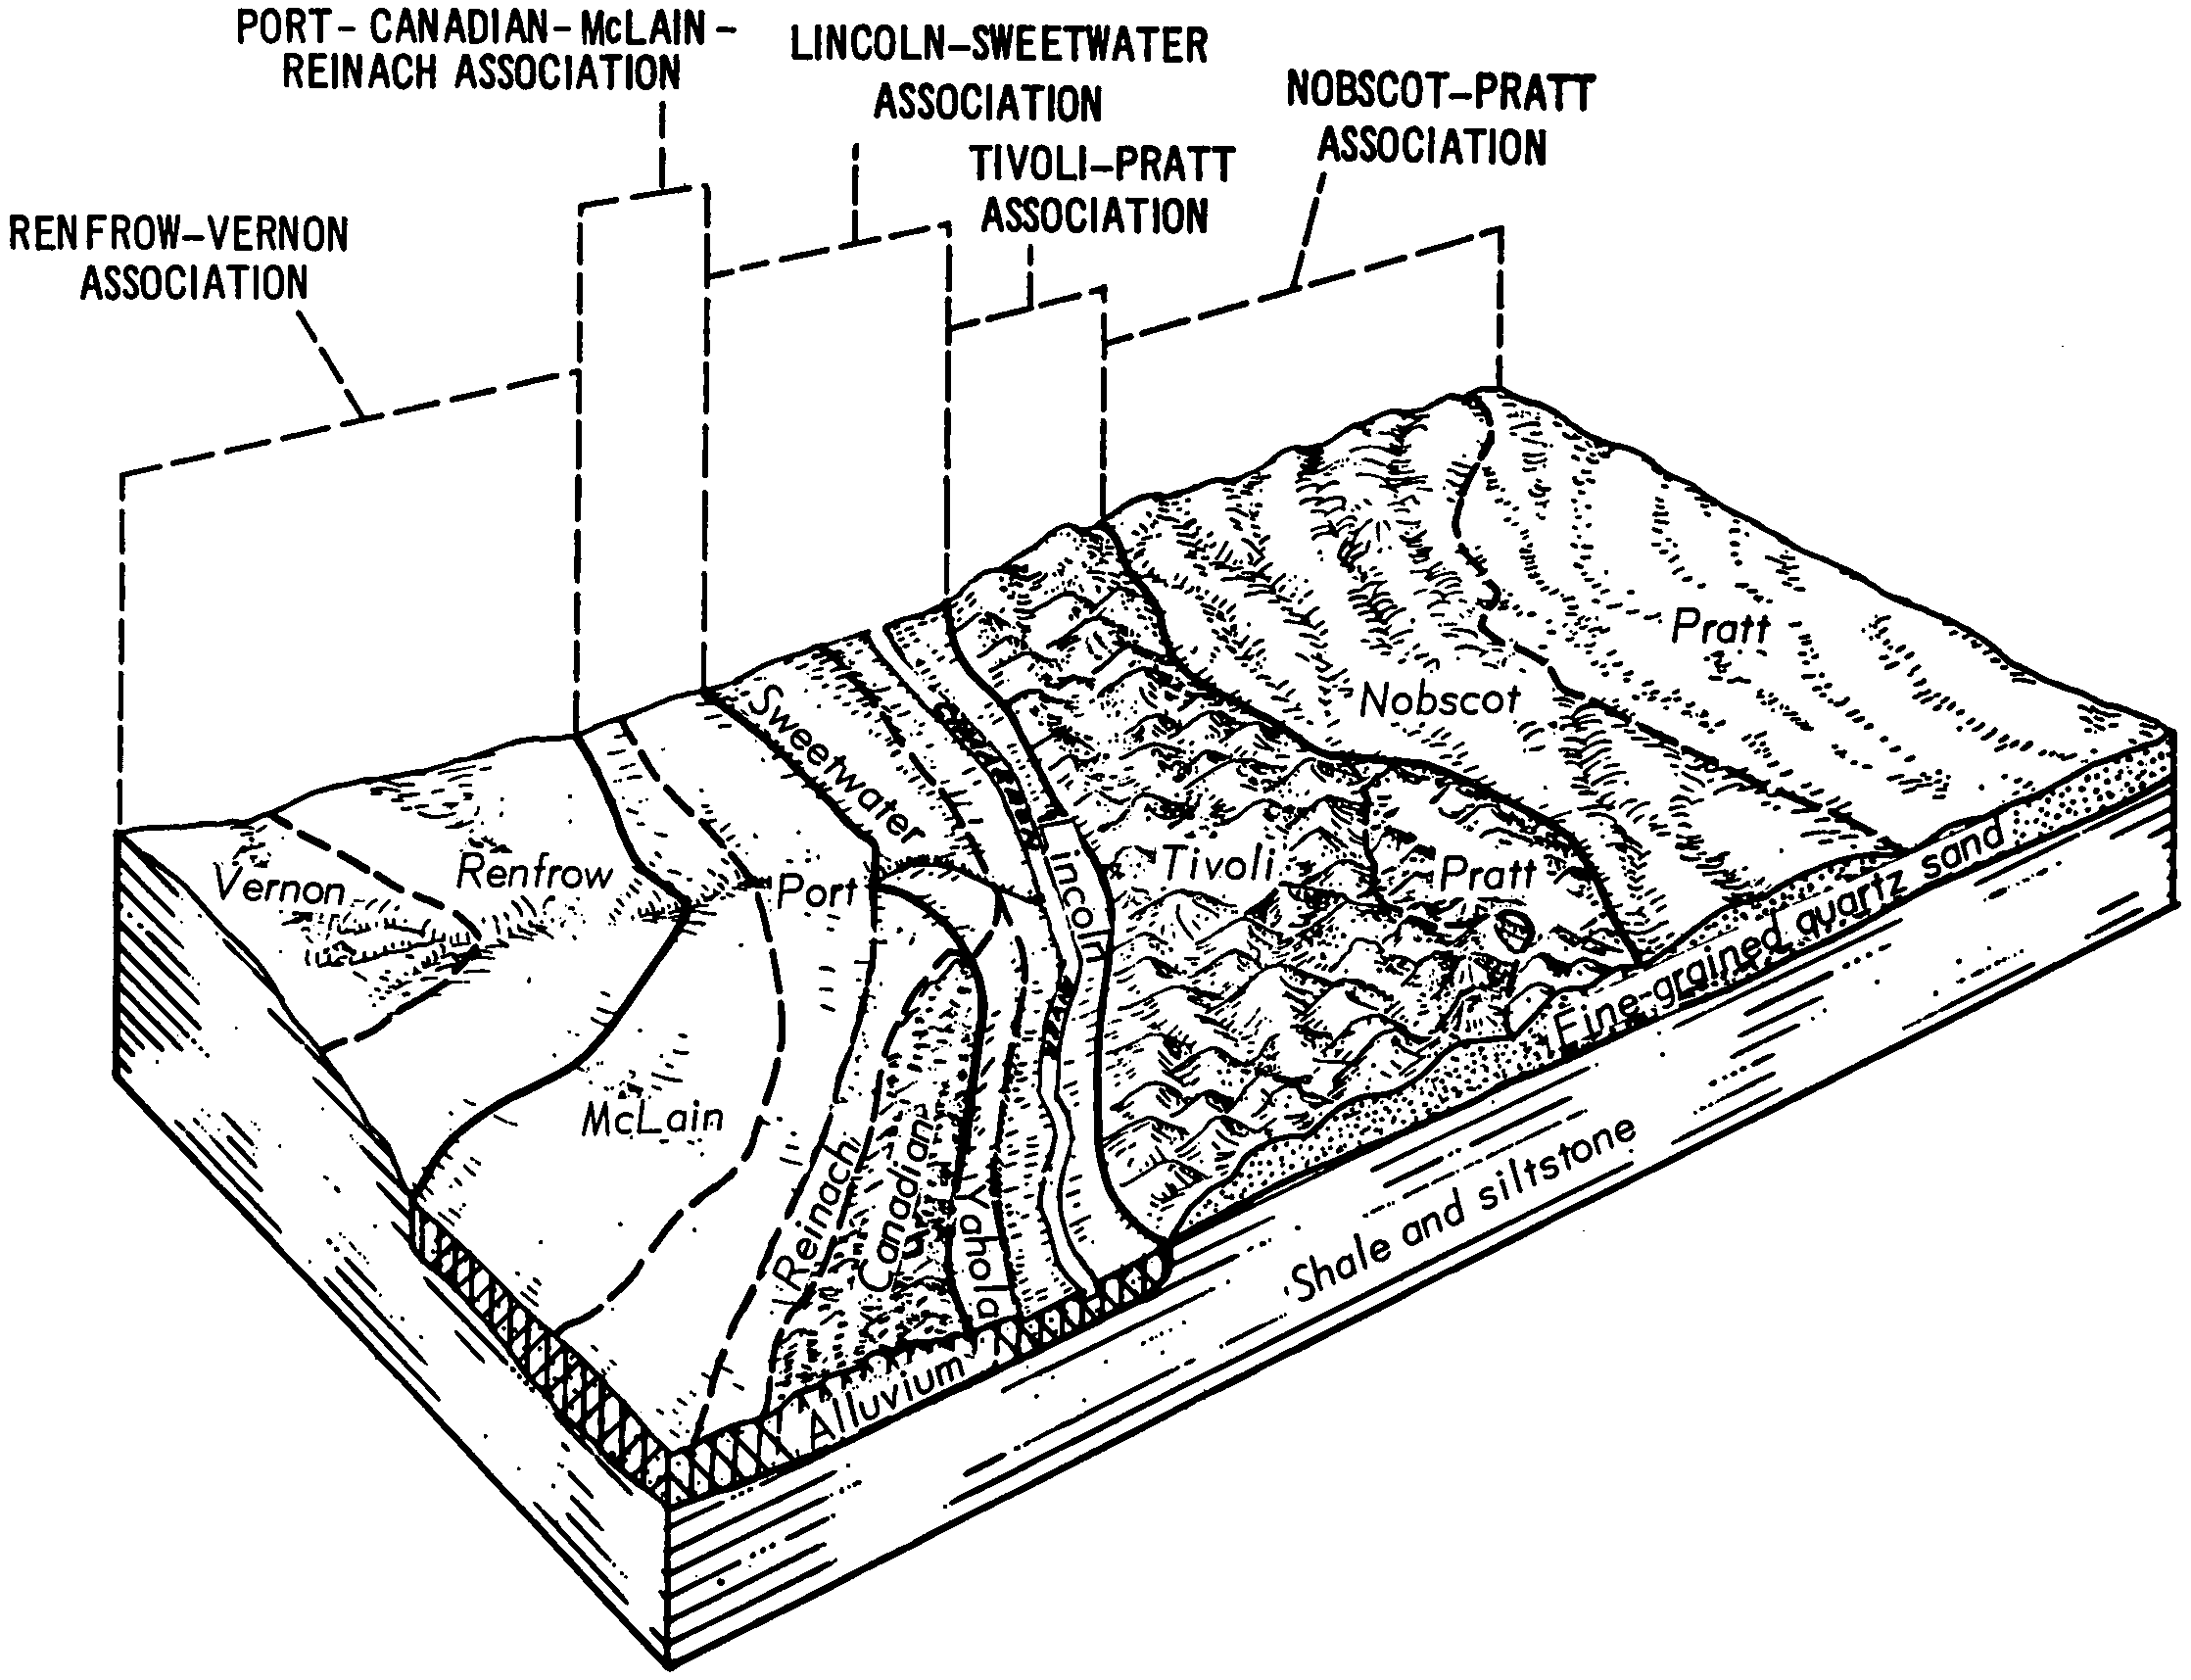
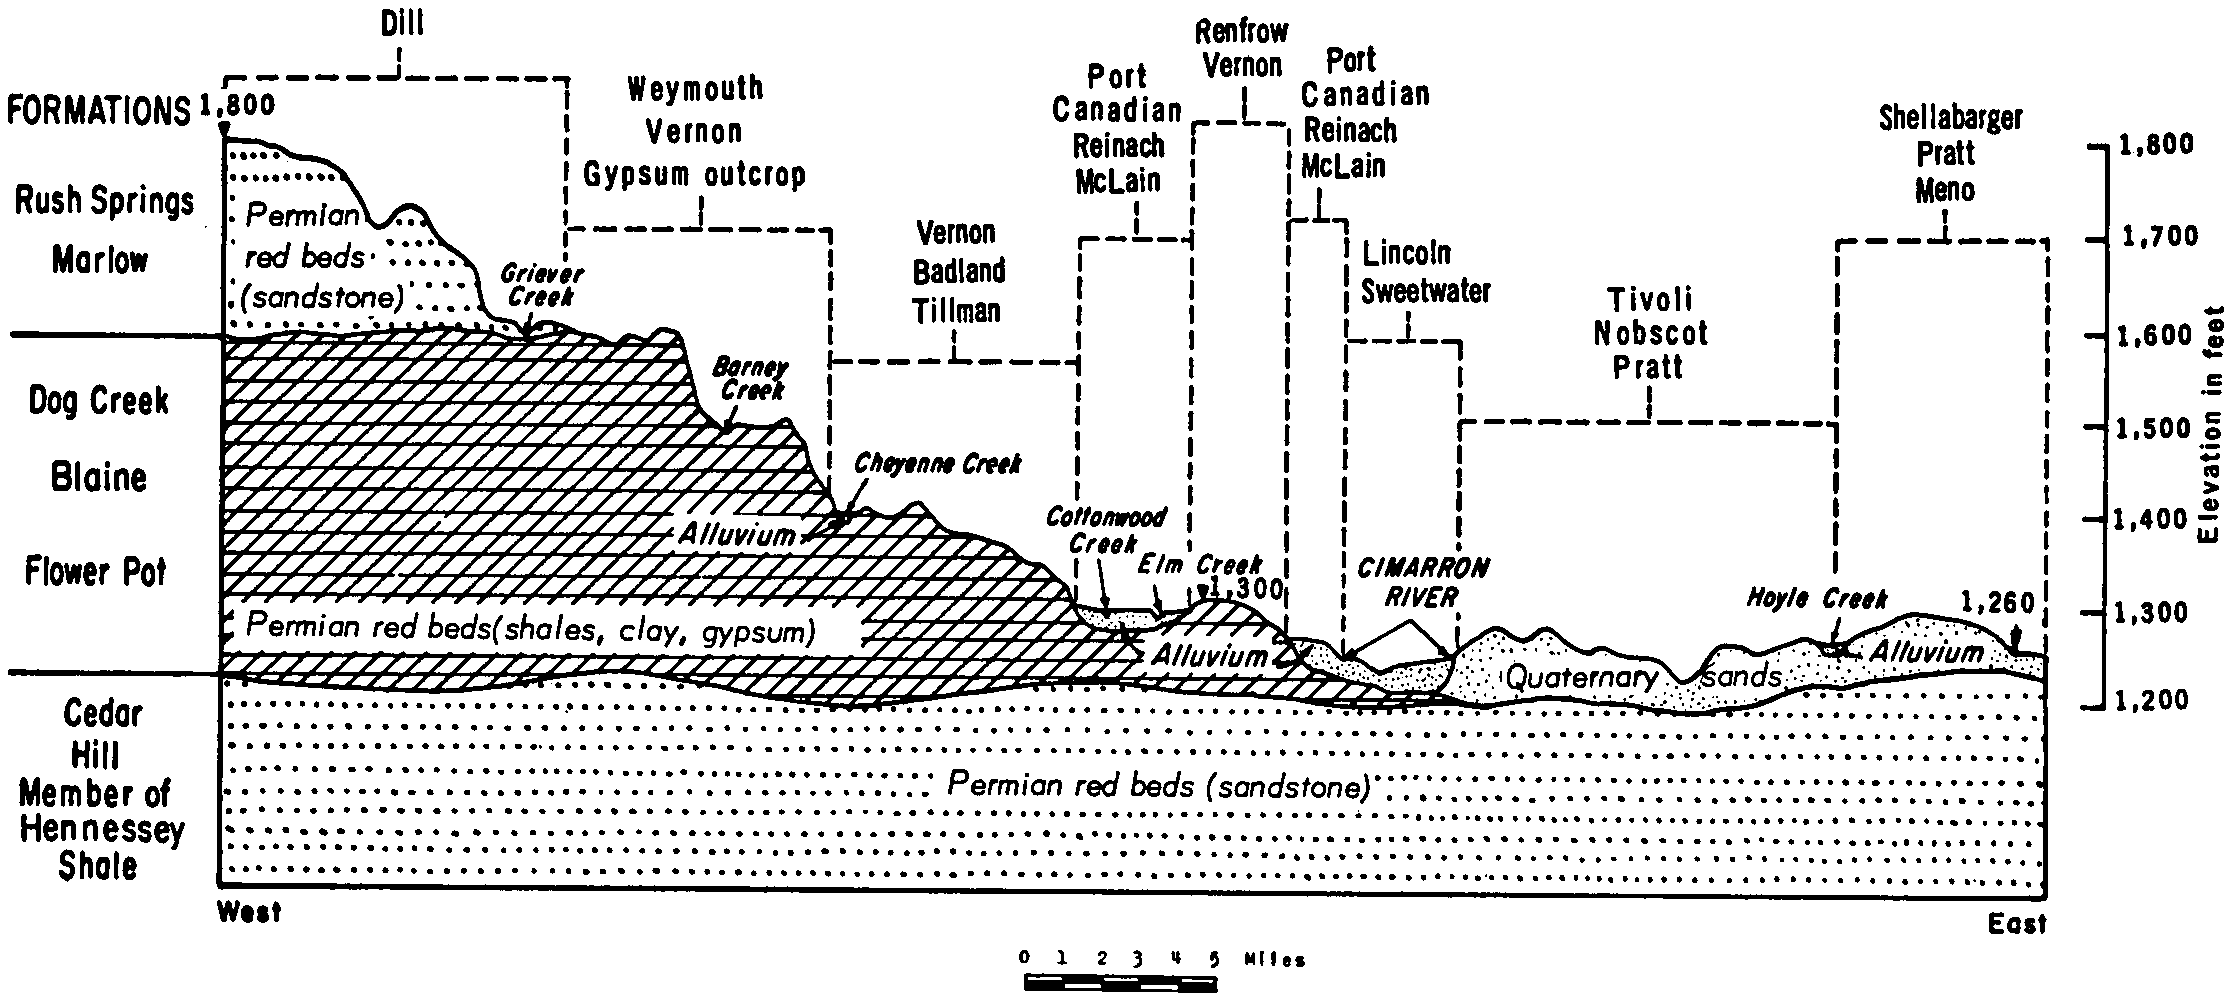
    Cross section along a line extending across the middle of the county from the western to the eastern boundary (Soil Survey of Major County, Oklahoma; October 1968).

  37. OK-2012-02-17-54 | Texas County - July 1961

    Typical pattern of the soils in association 4, Texas County, Okla (Soil Survey of Texas County, Oklahoma; July 1961).

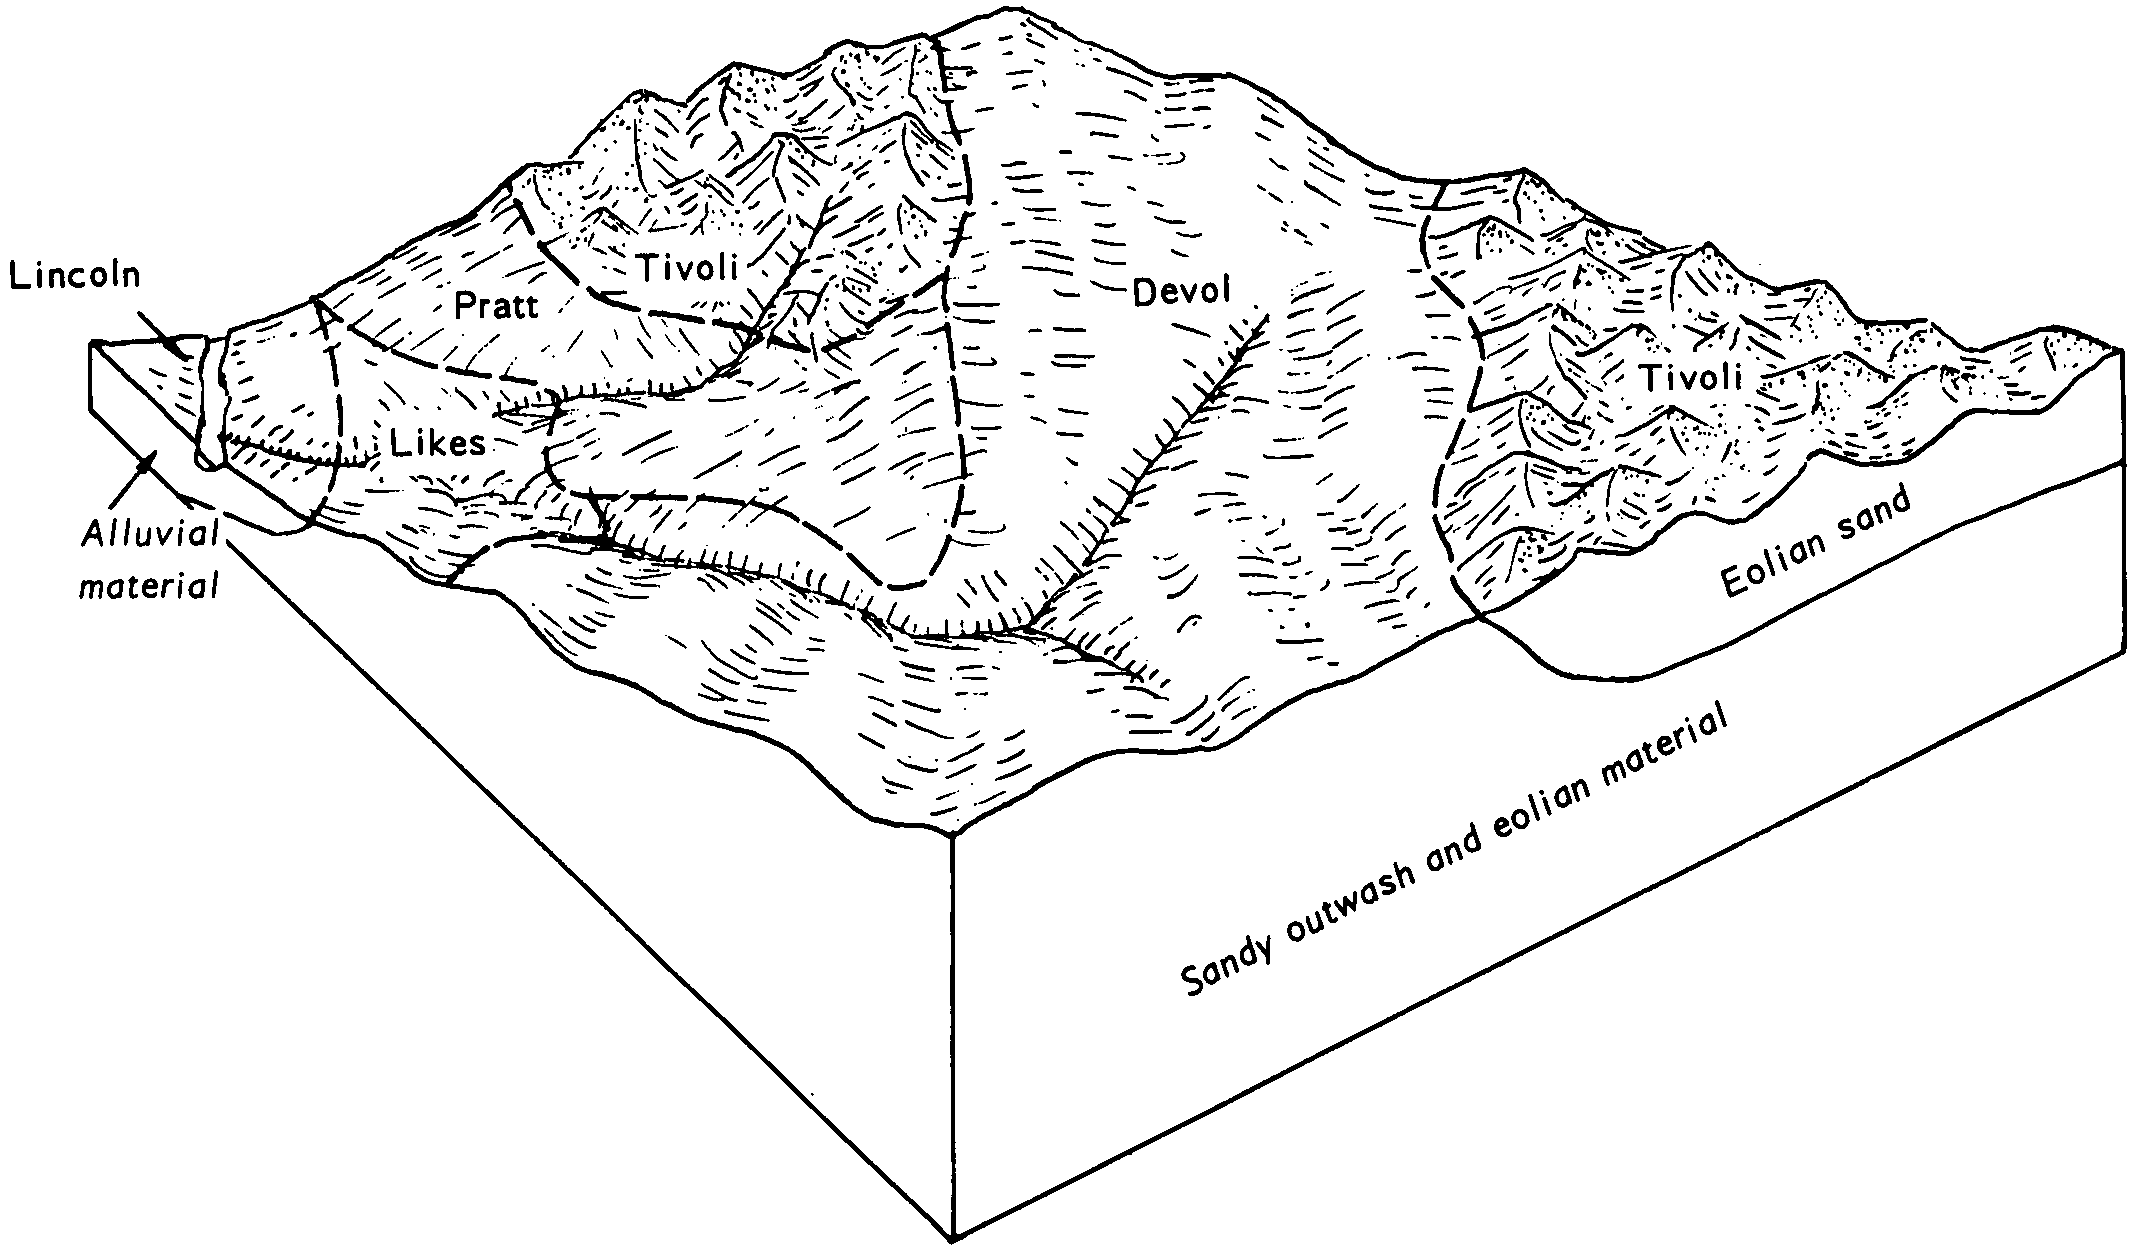
  38. OK-2012-02-17-59 | Woodward County - November 1963

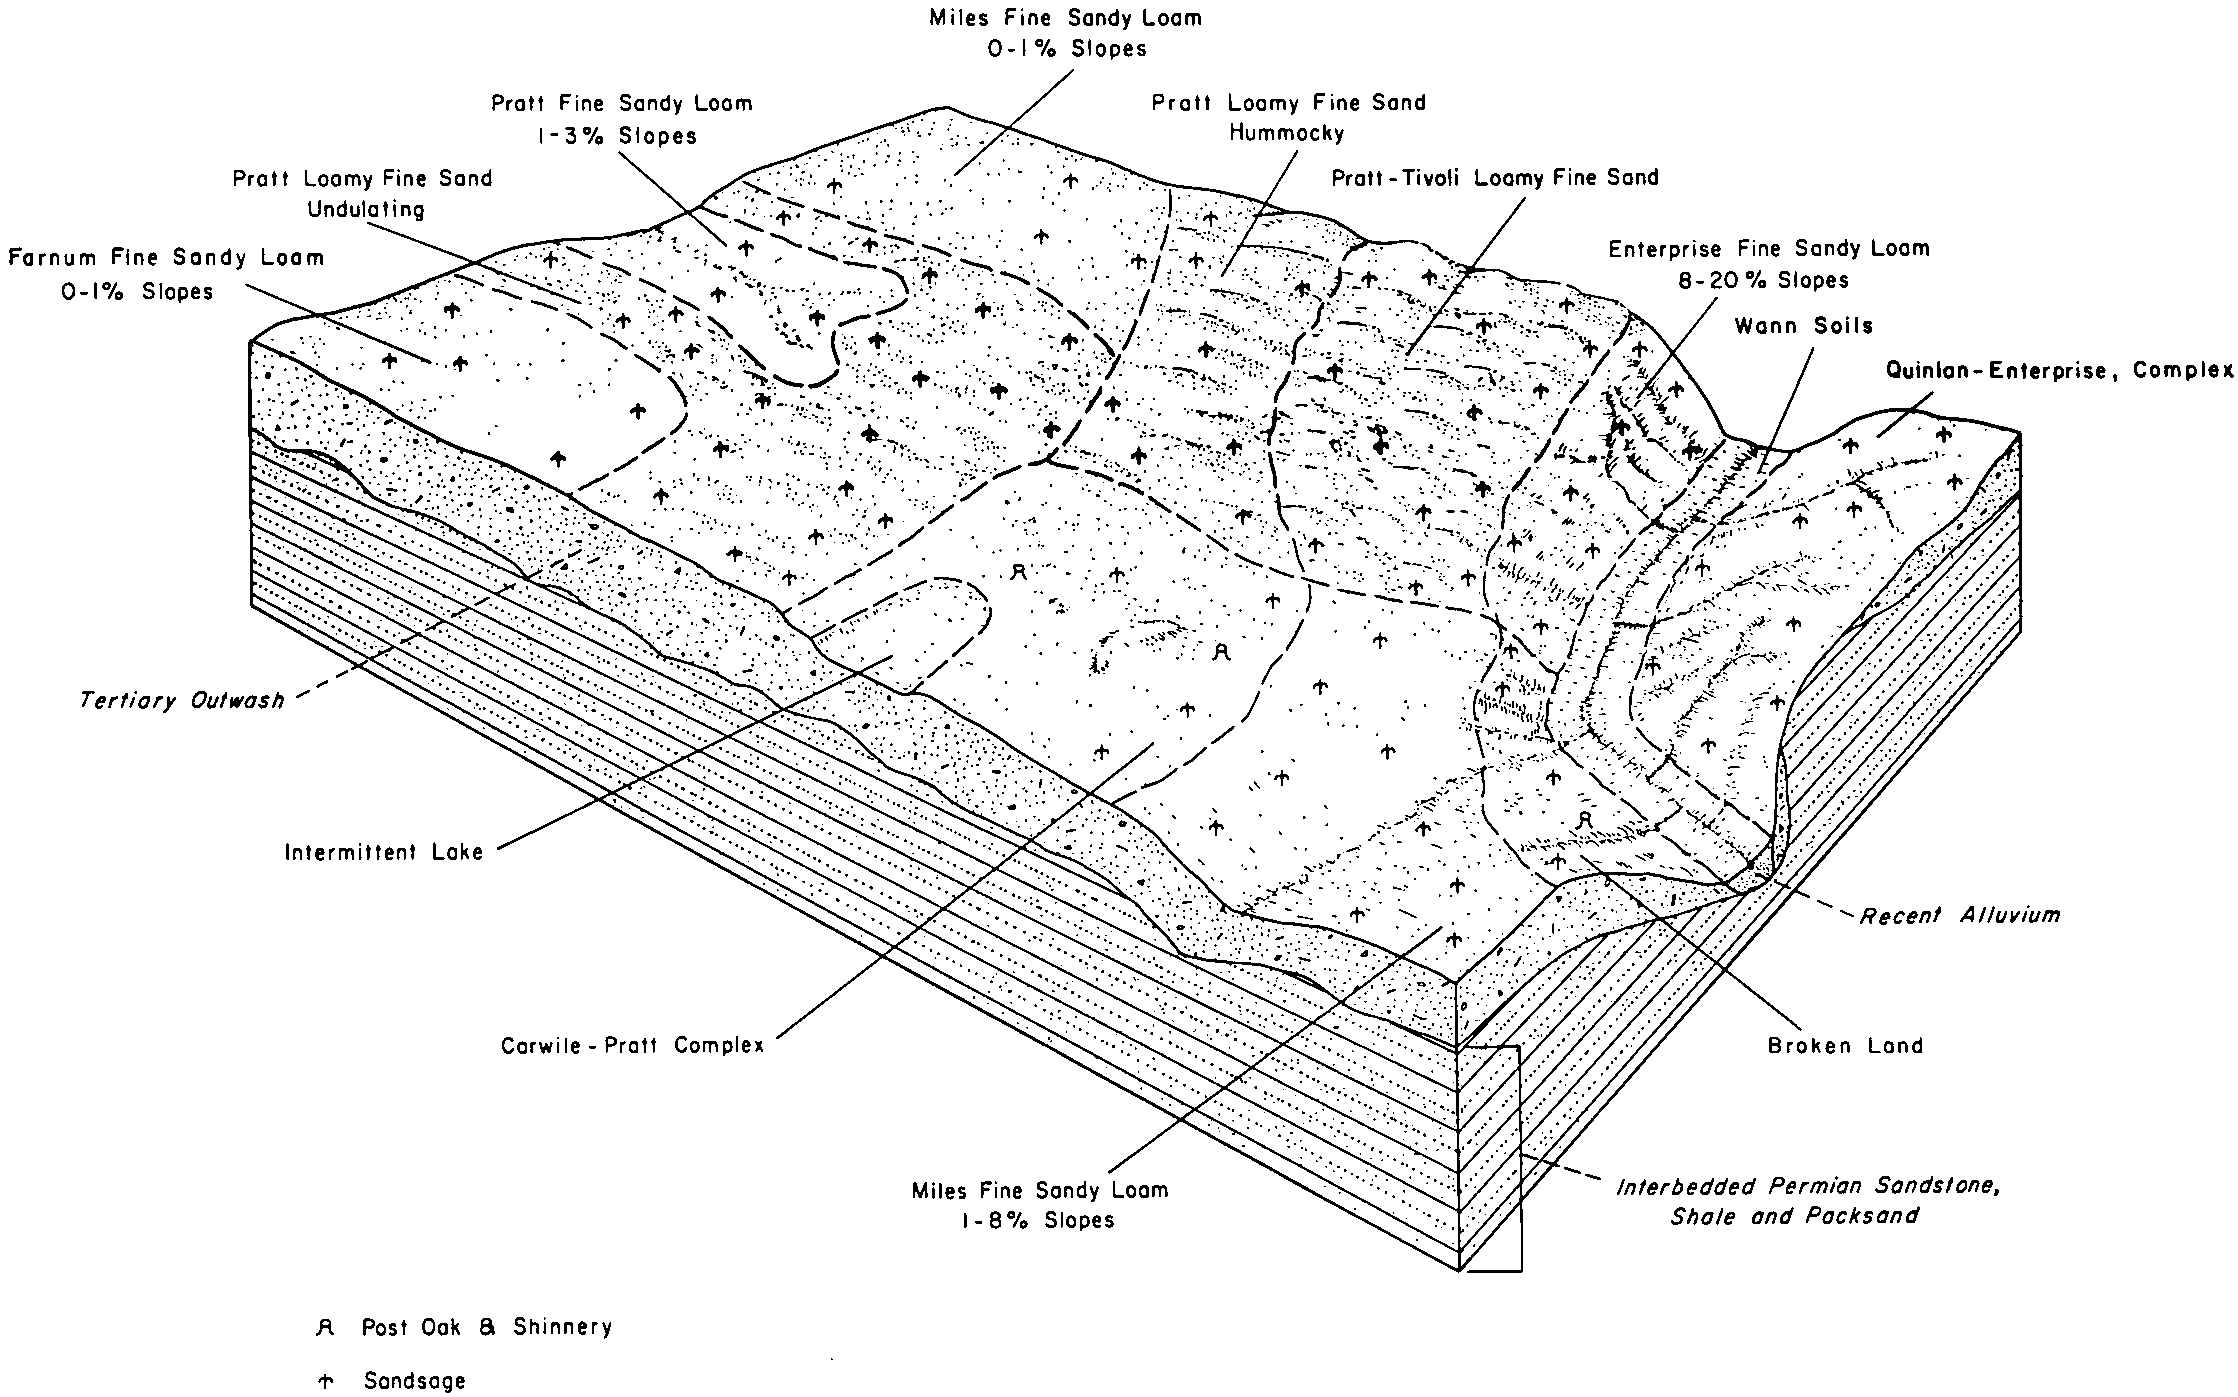
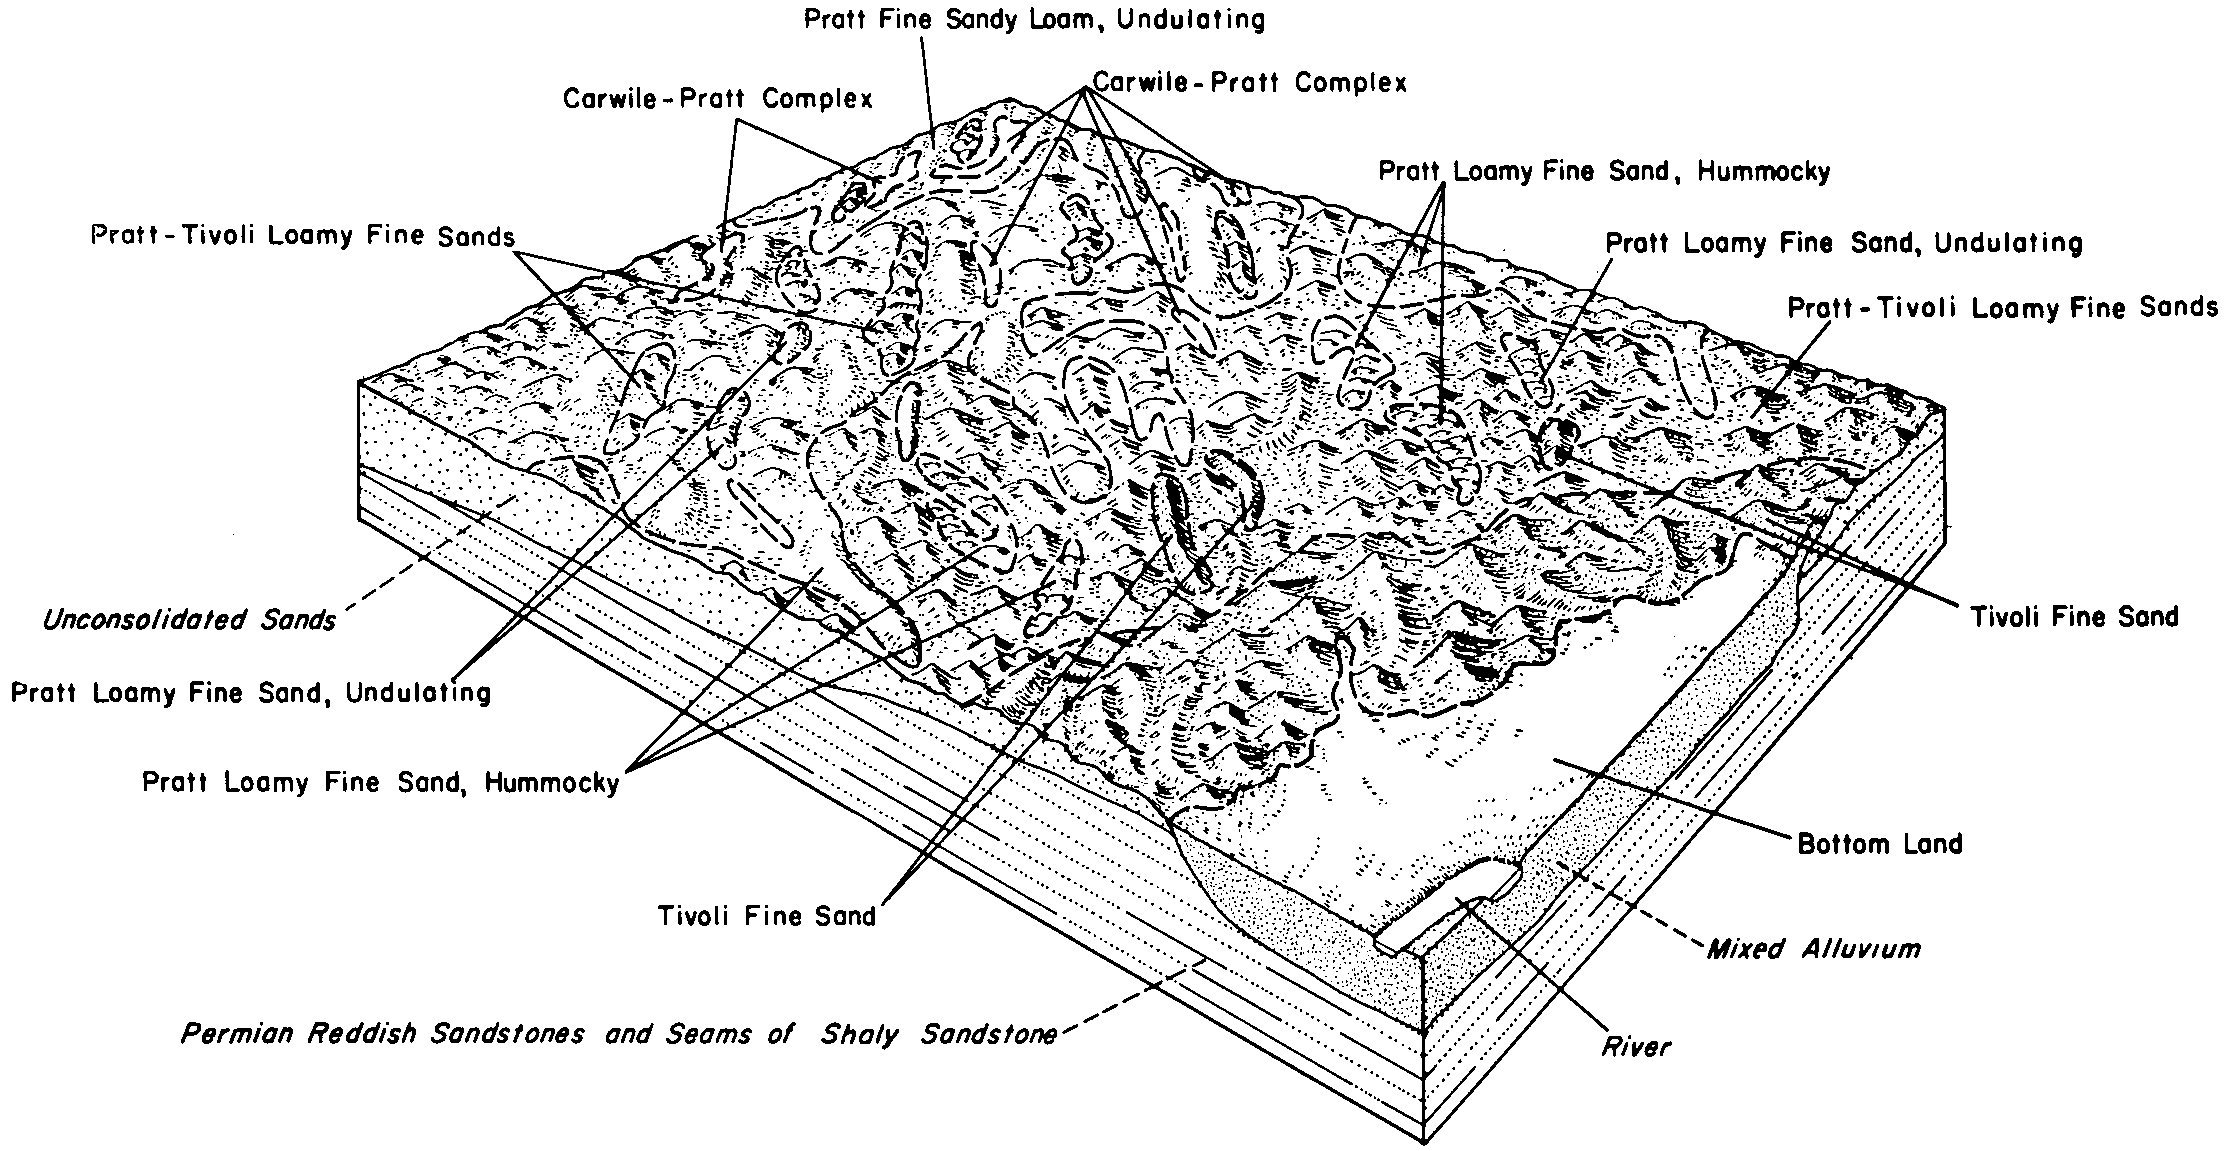
    Typical pattern of soils of the Pratt association (Soil Survey of Woodward County, Oklahoma; November 1963).

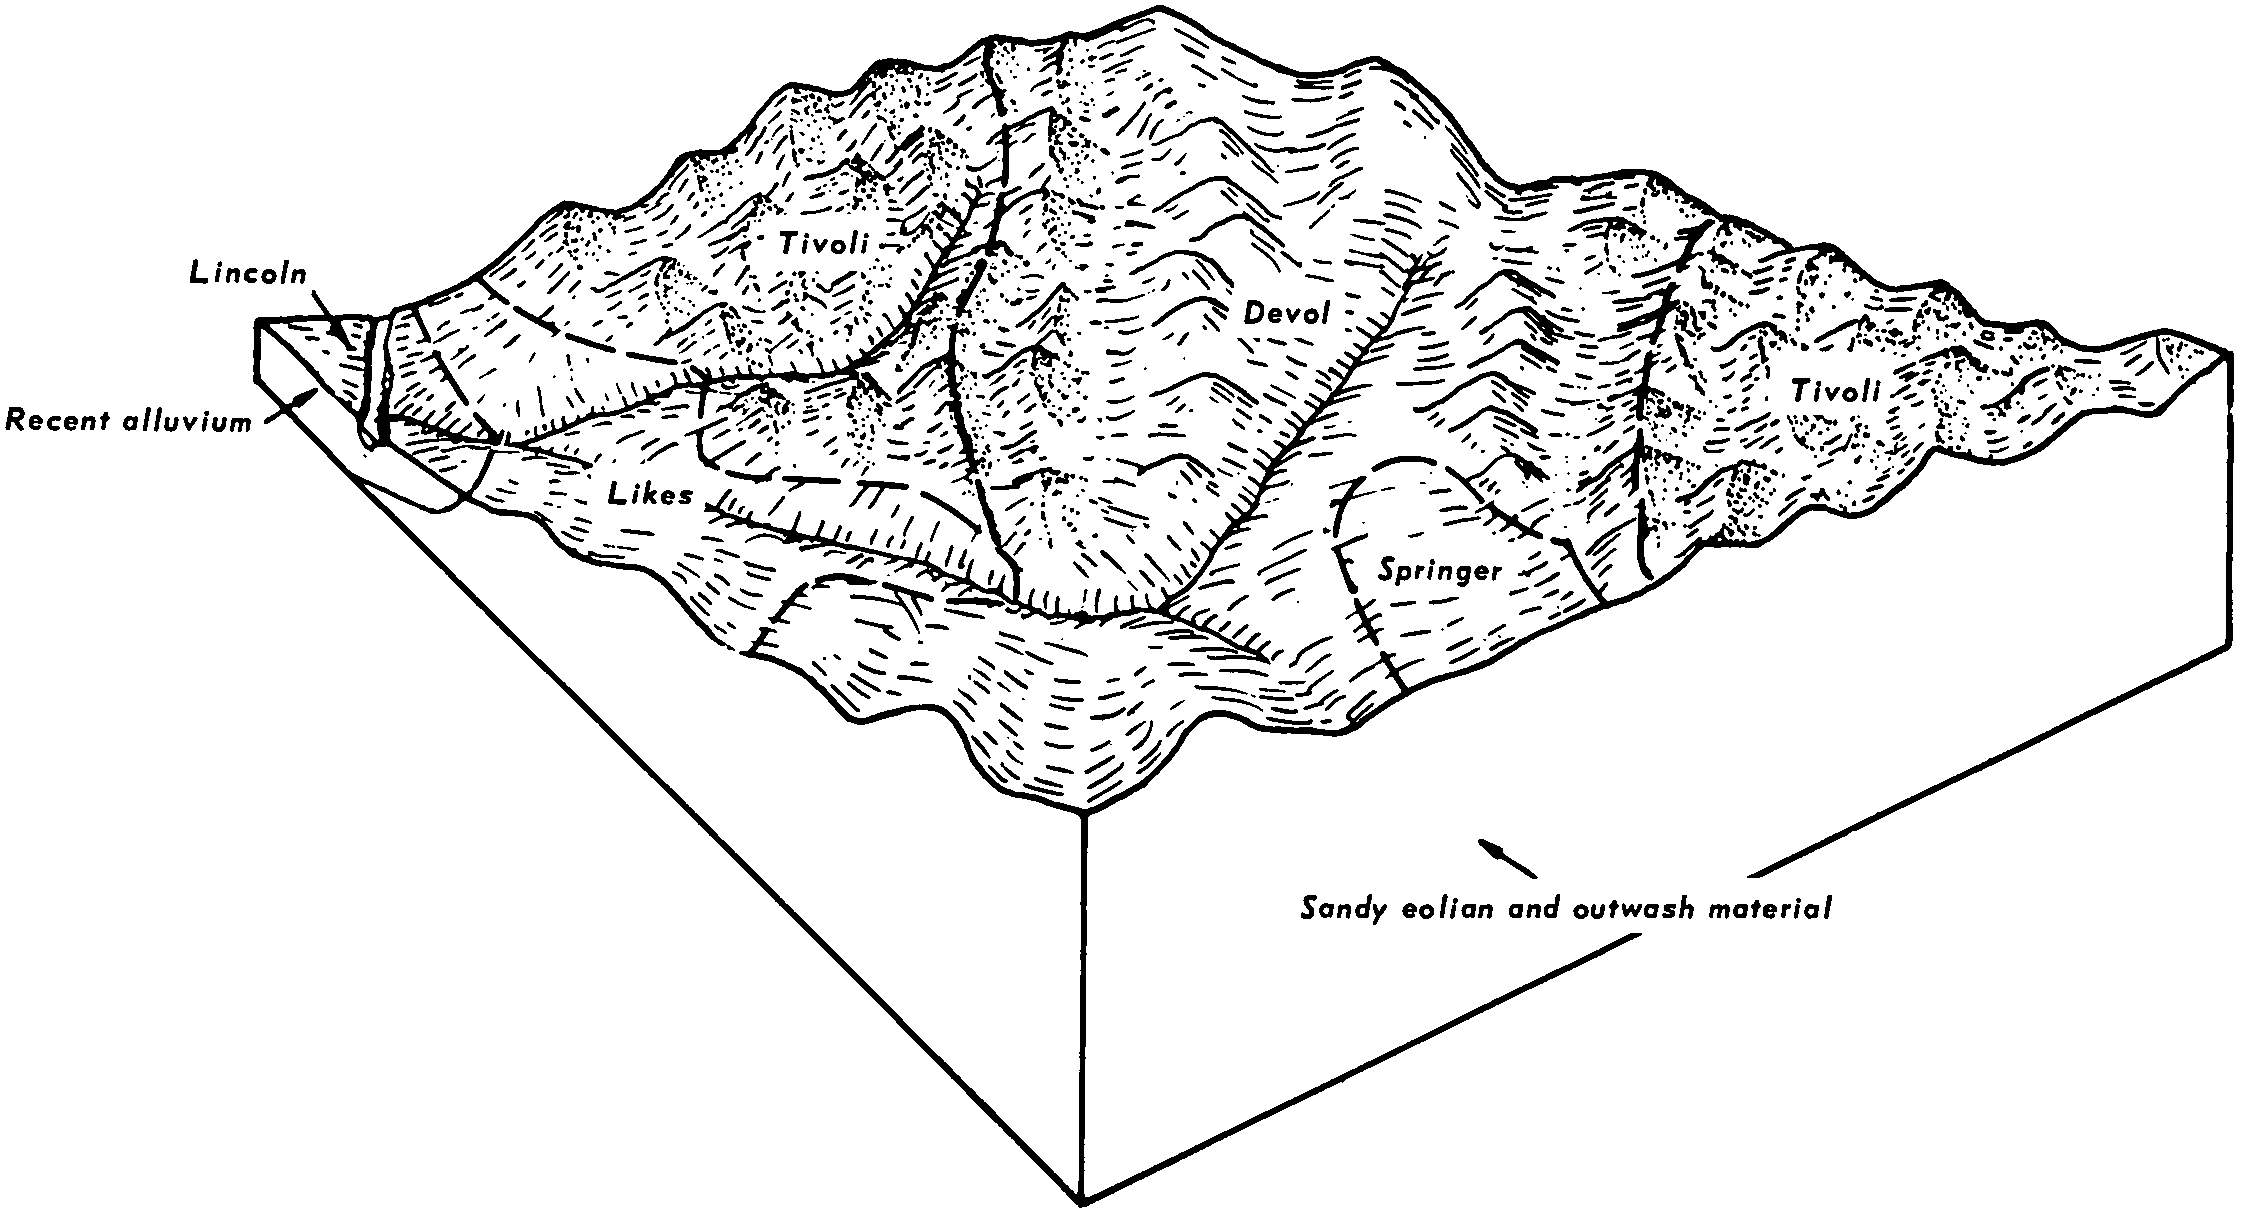
  39. OK-2012-02-17-61 | Woodward County - November 1963

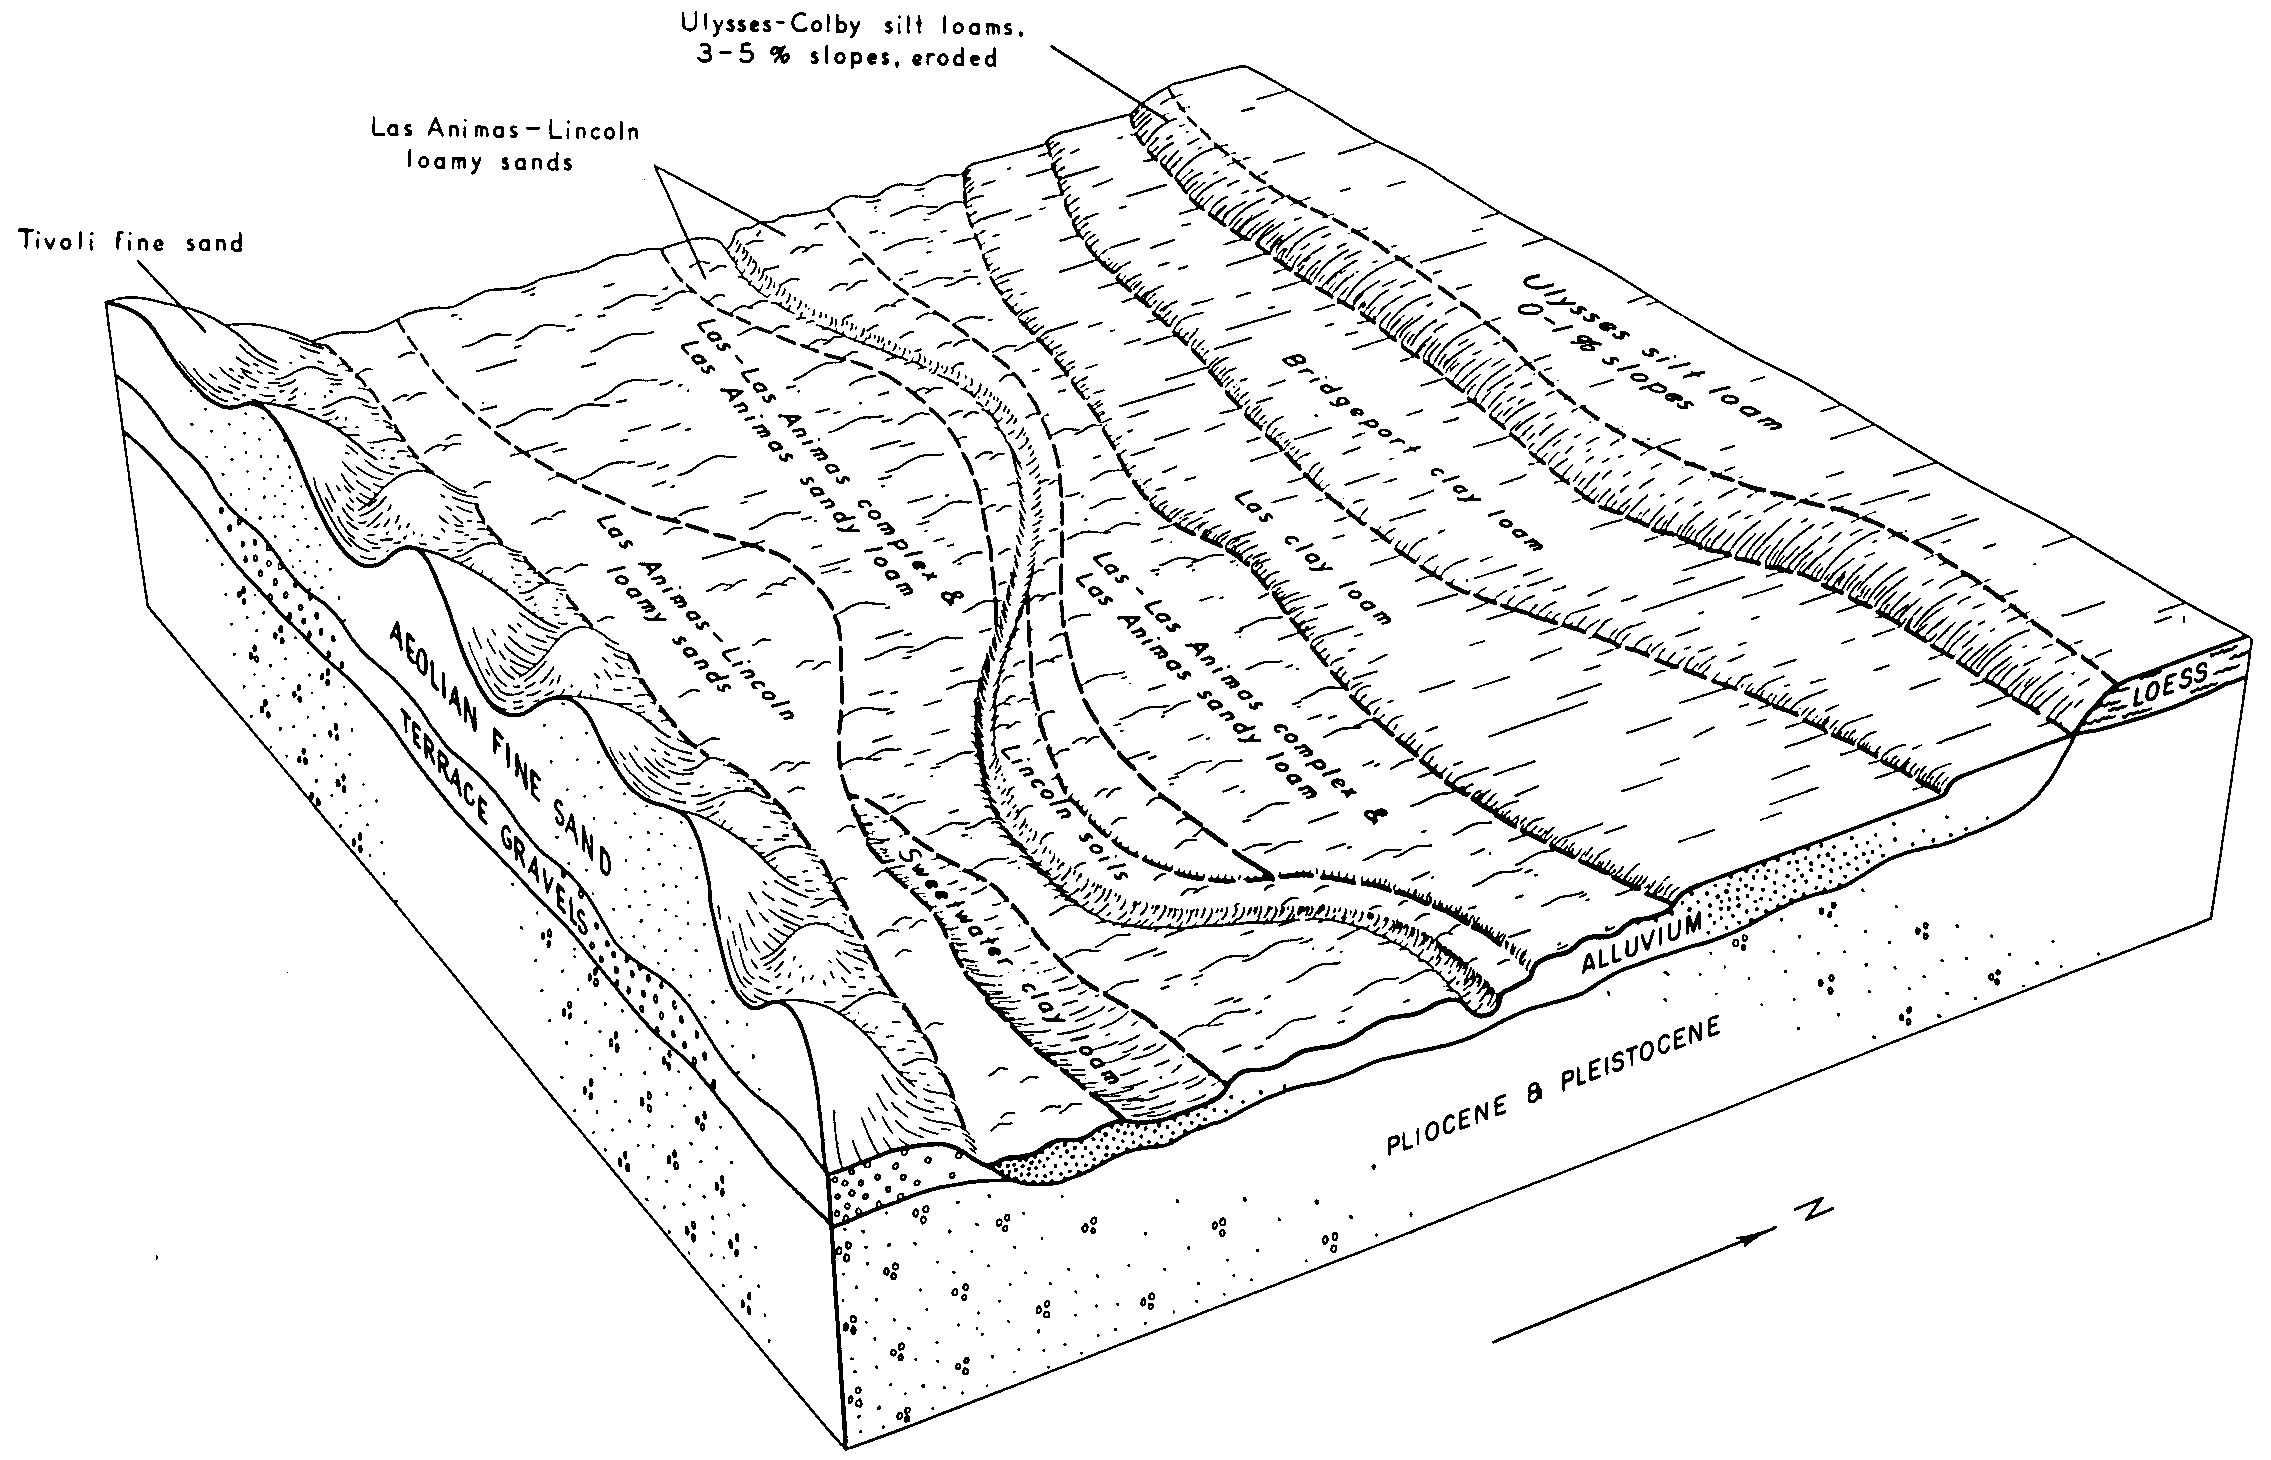
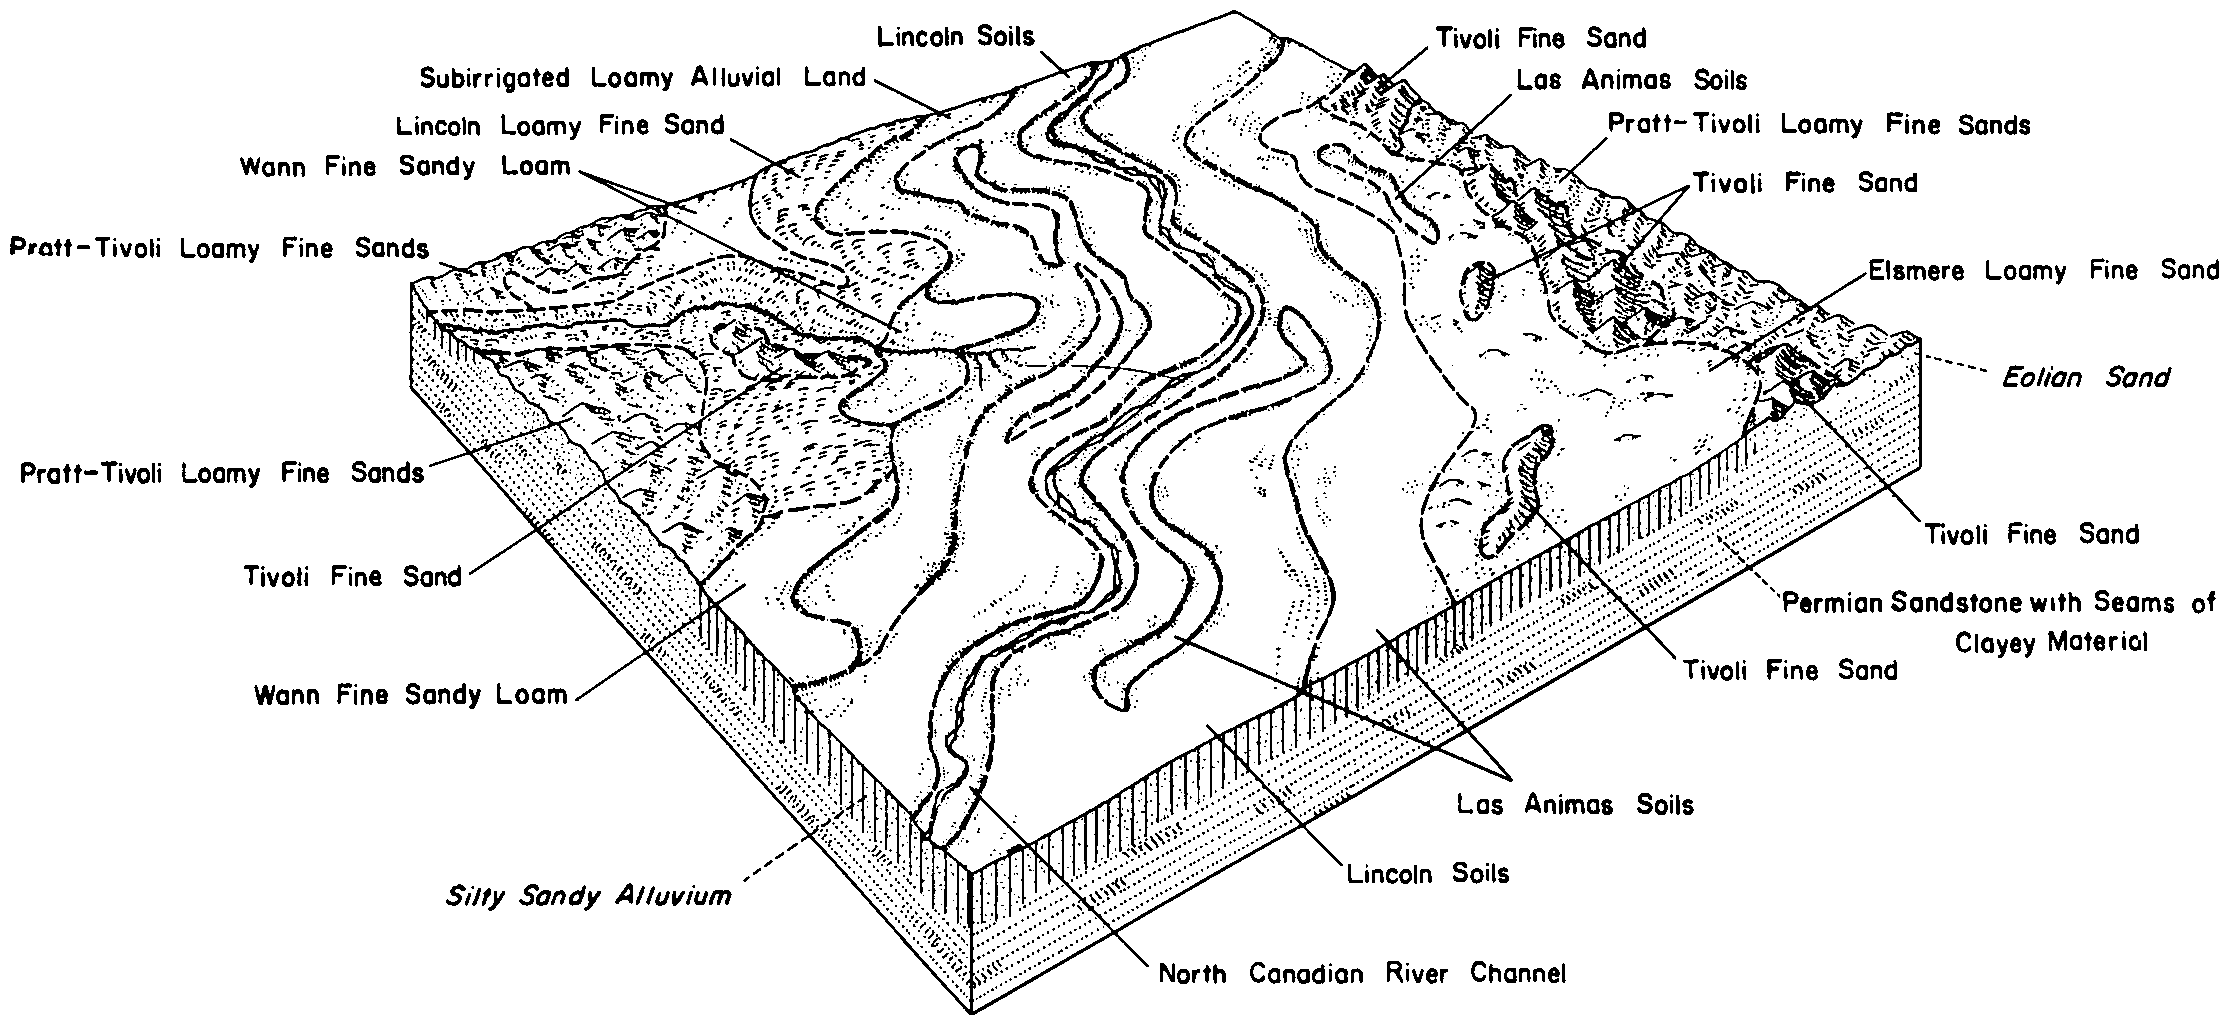
    Typical pattern of soils of the Lincoln-Las Animas association (Soil Survey of Woodward County, Oklahoma; November 1963).

  40. TX-2010-11-02-22 | Carson County -

    General relationship of the soils in Carson County (Soil Survey of Carson County, Texas).

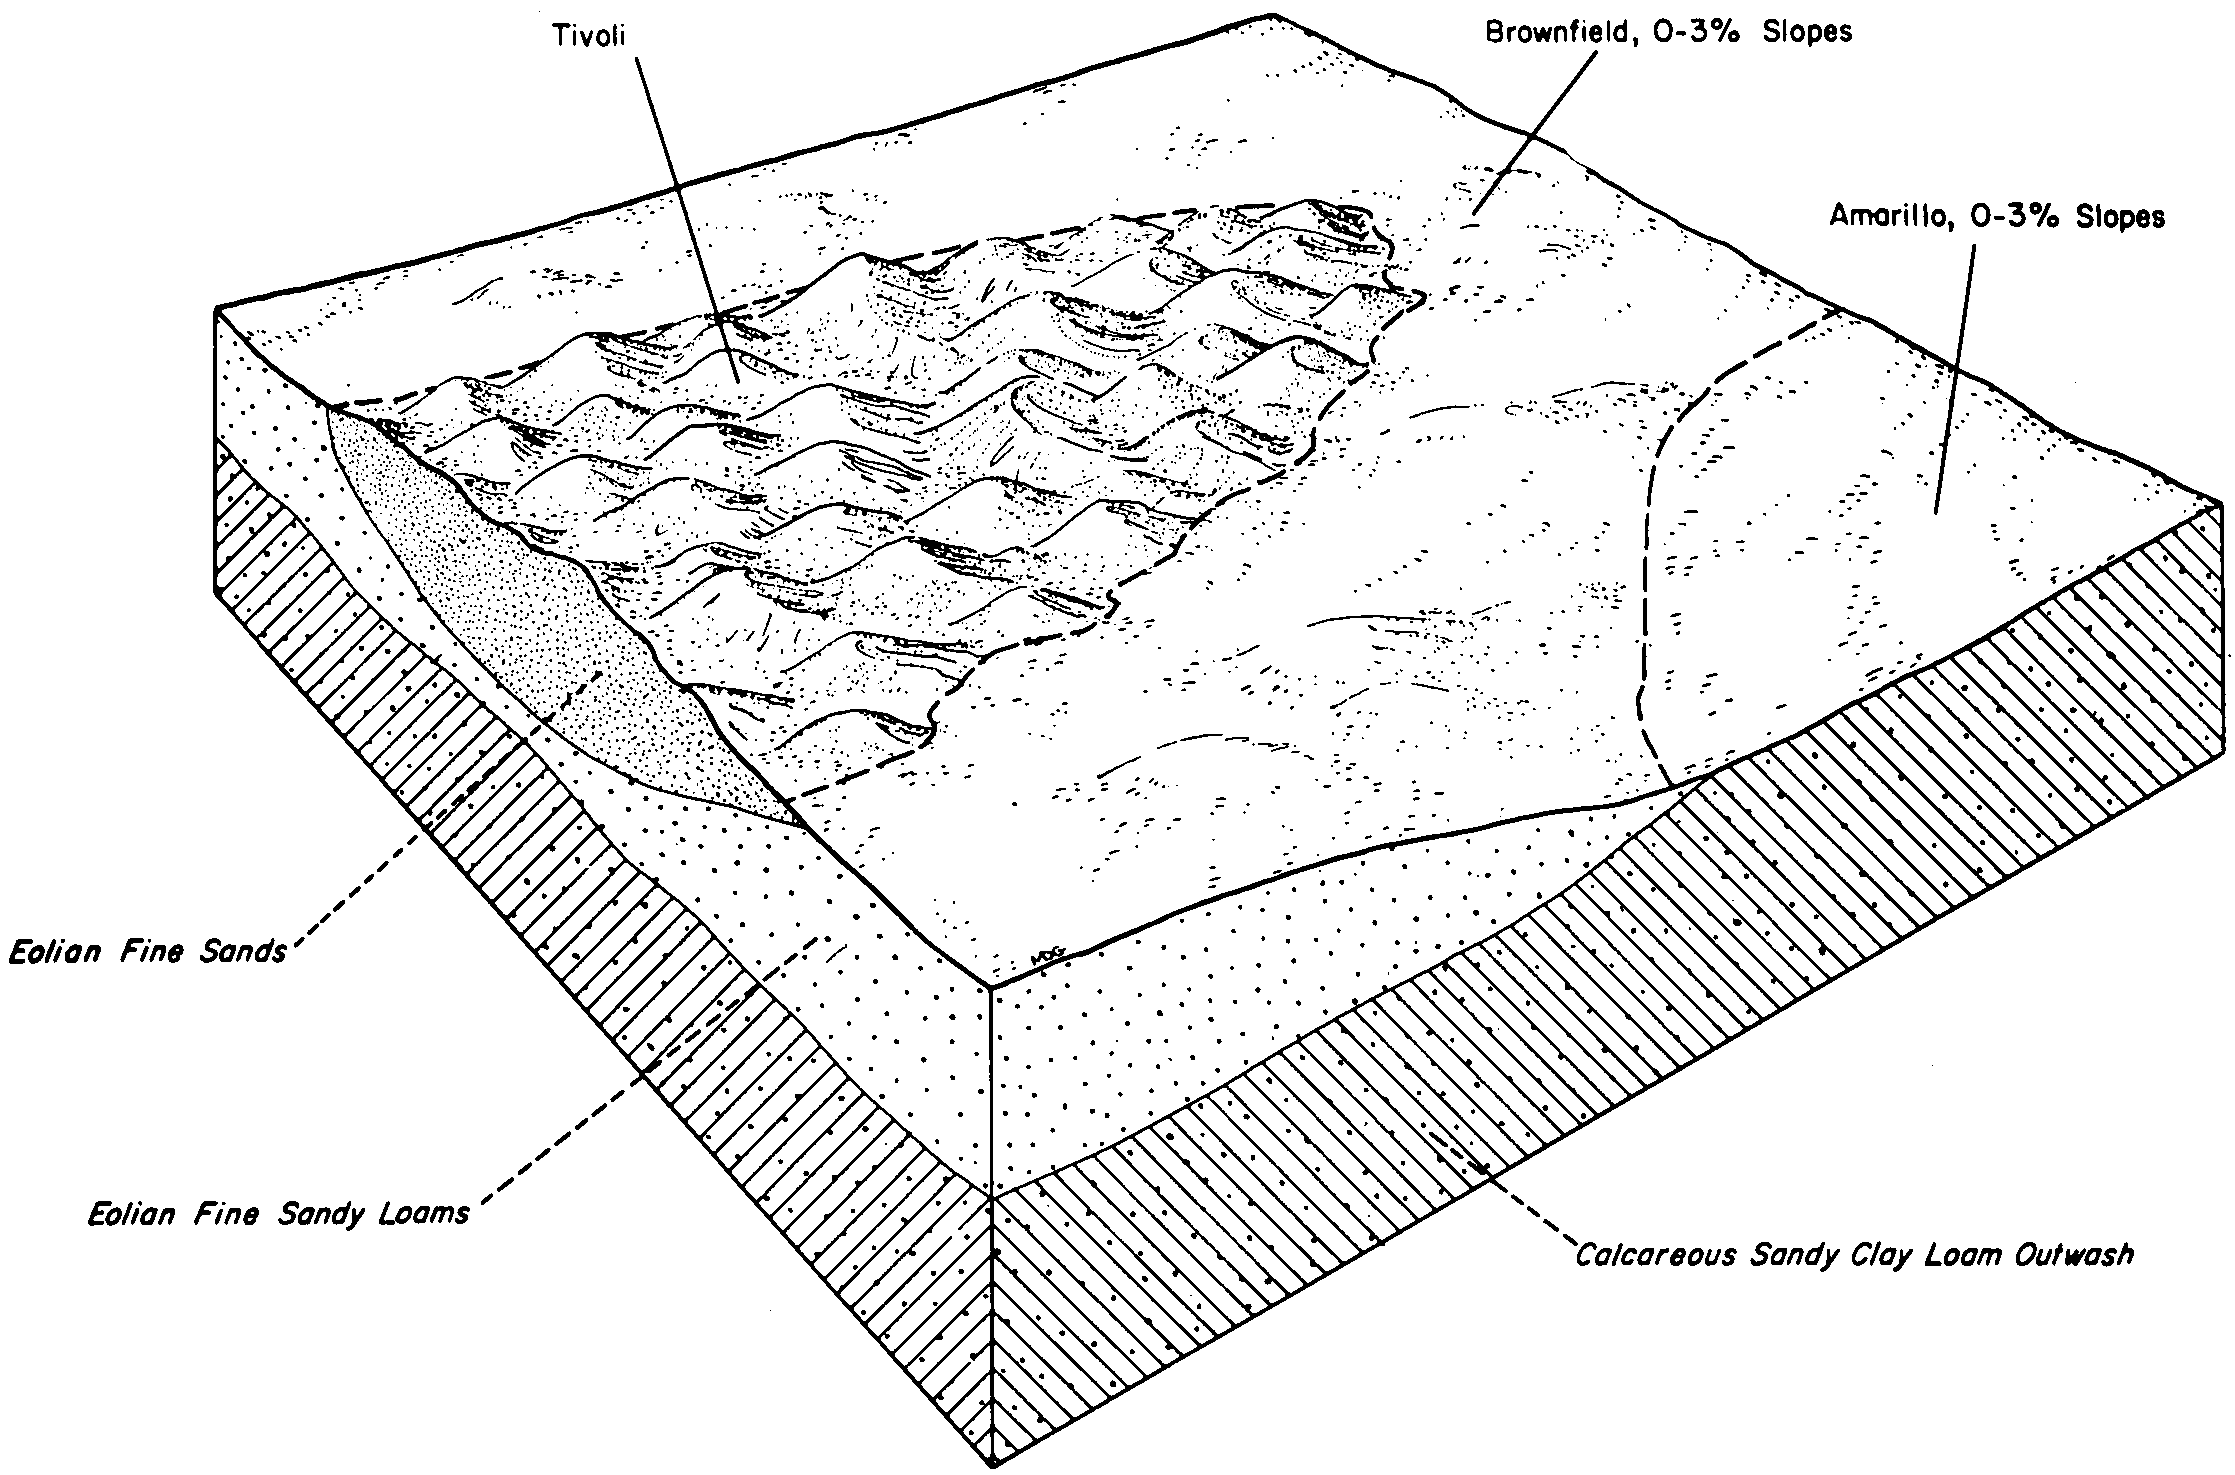
  41. TX-2012-03-20-02 | Bailey County - April 1963

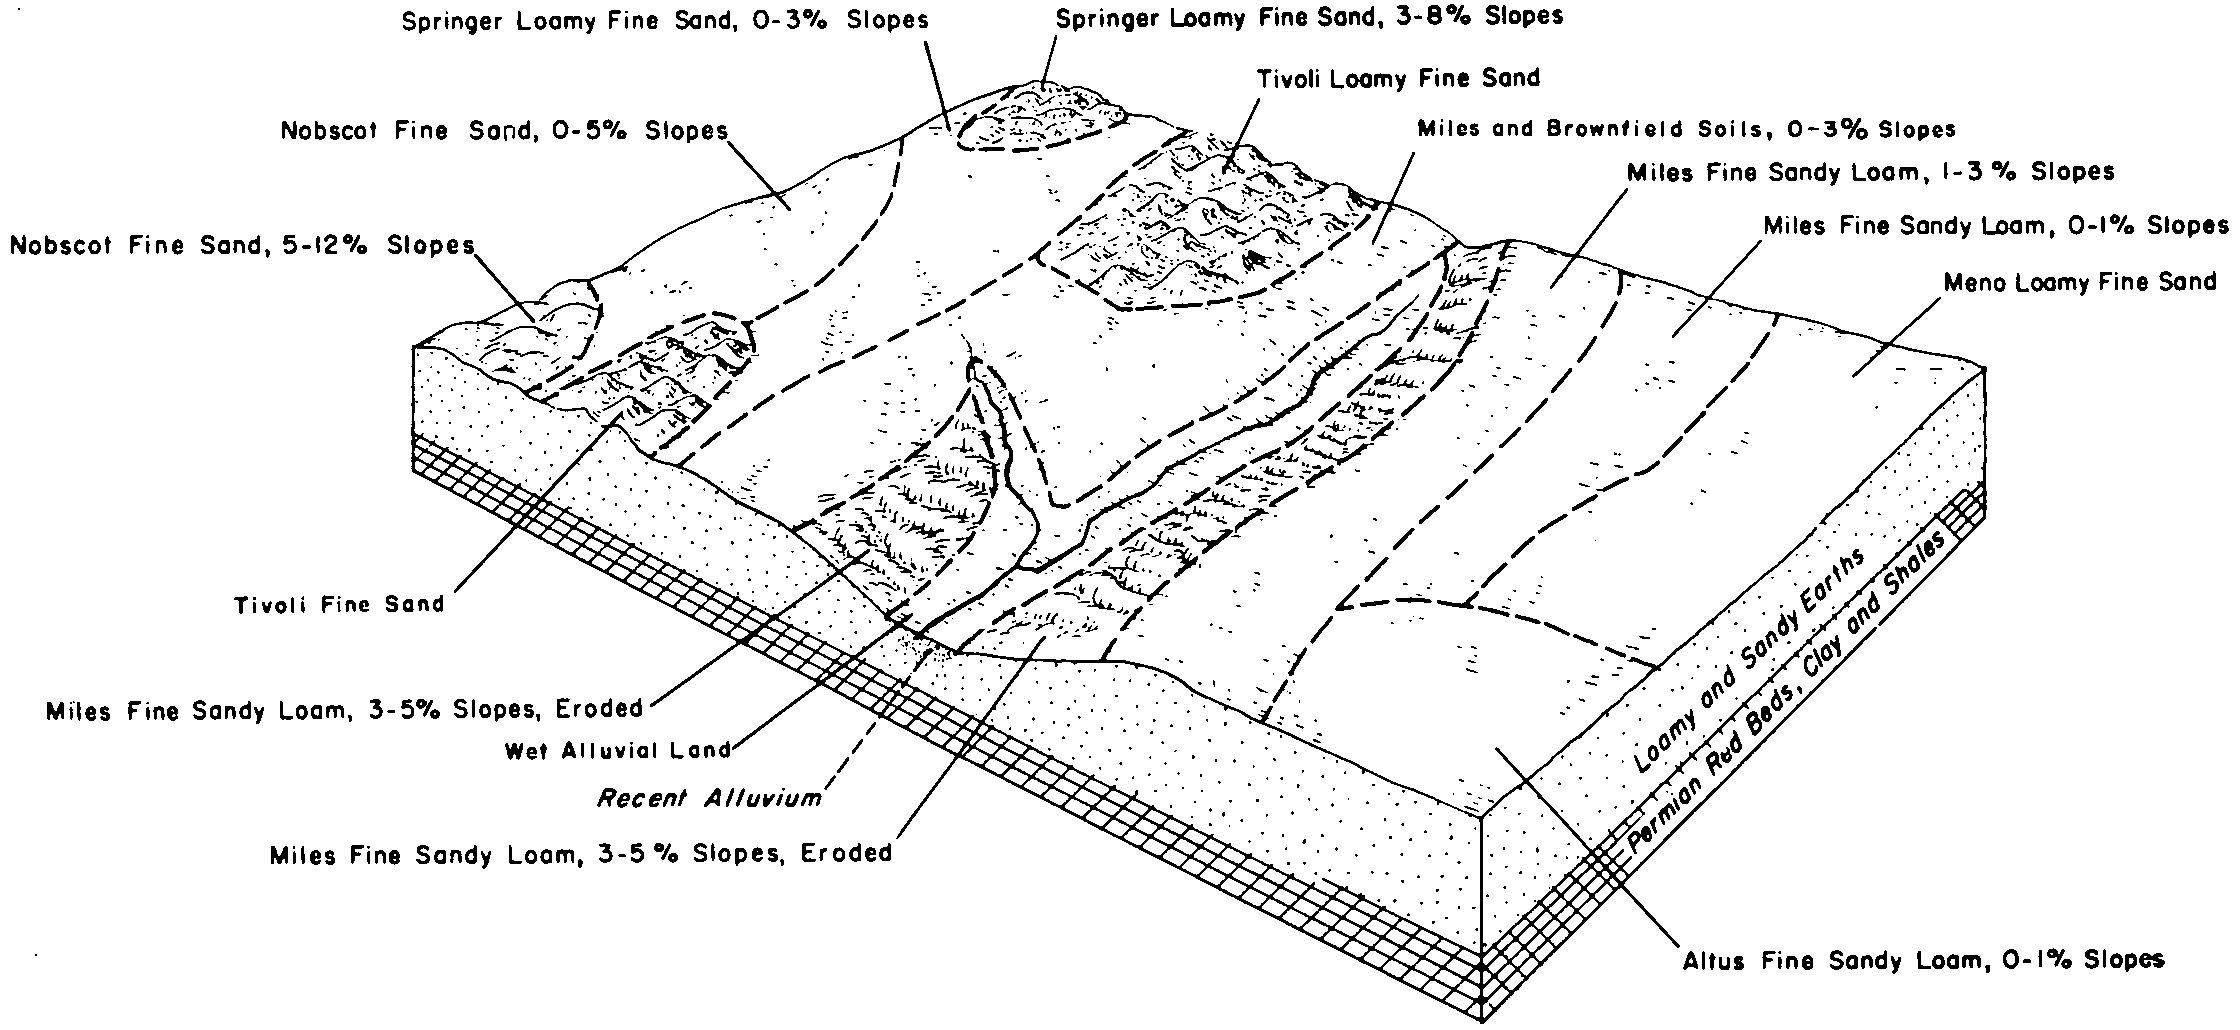
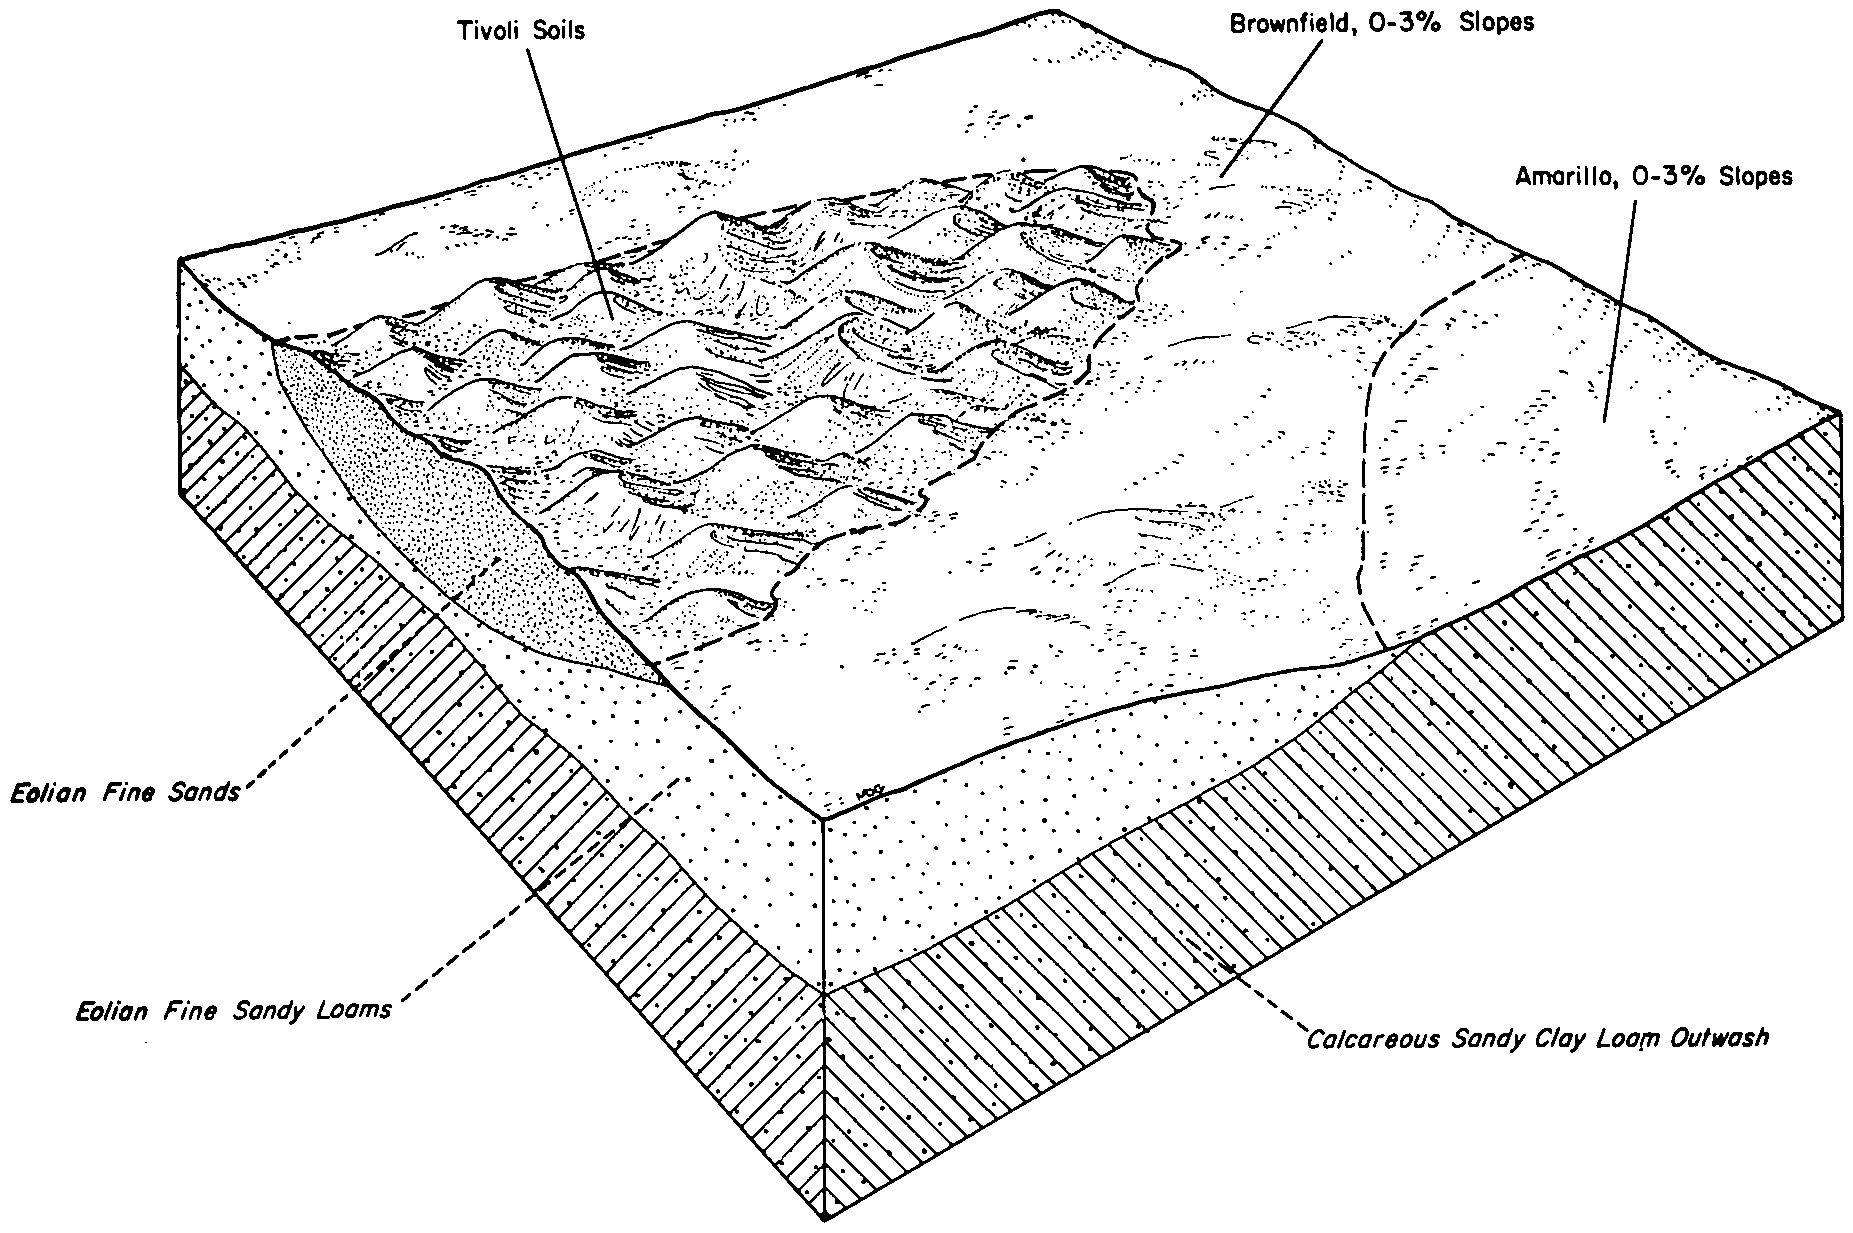
    Typical patterns of soils in the Tivoli-Brownfield association and the Amarillo loamy fine sand association (Soil Survey of Bailey County, TX; 1963).

  42. TX-2012-03-20-10 | Carson County - July 1962

    General relationship of the soils in Carson County (Soil Survey of Carson County, TX; 1962).

  43. TX-2012-03-20-15 | Carson County - July 1962

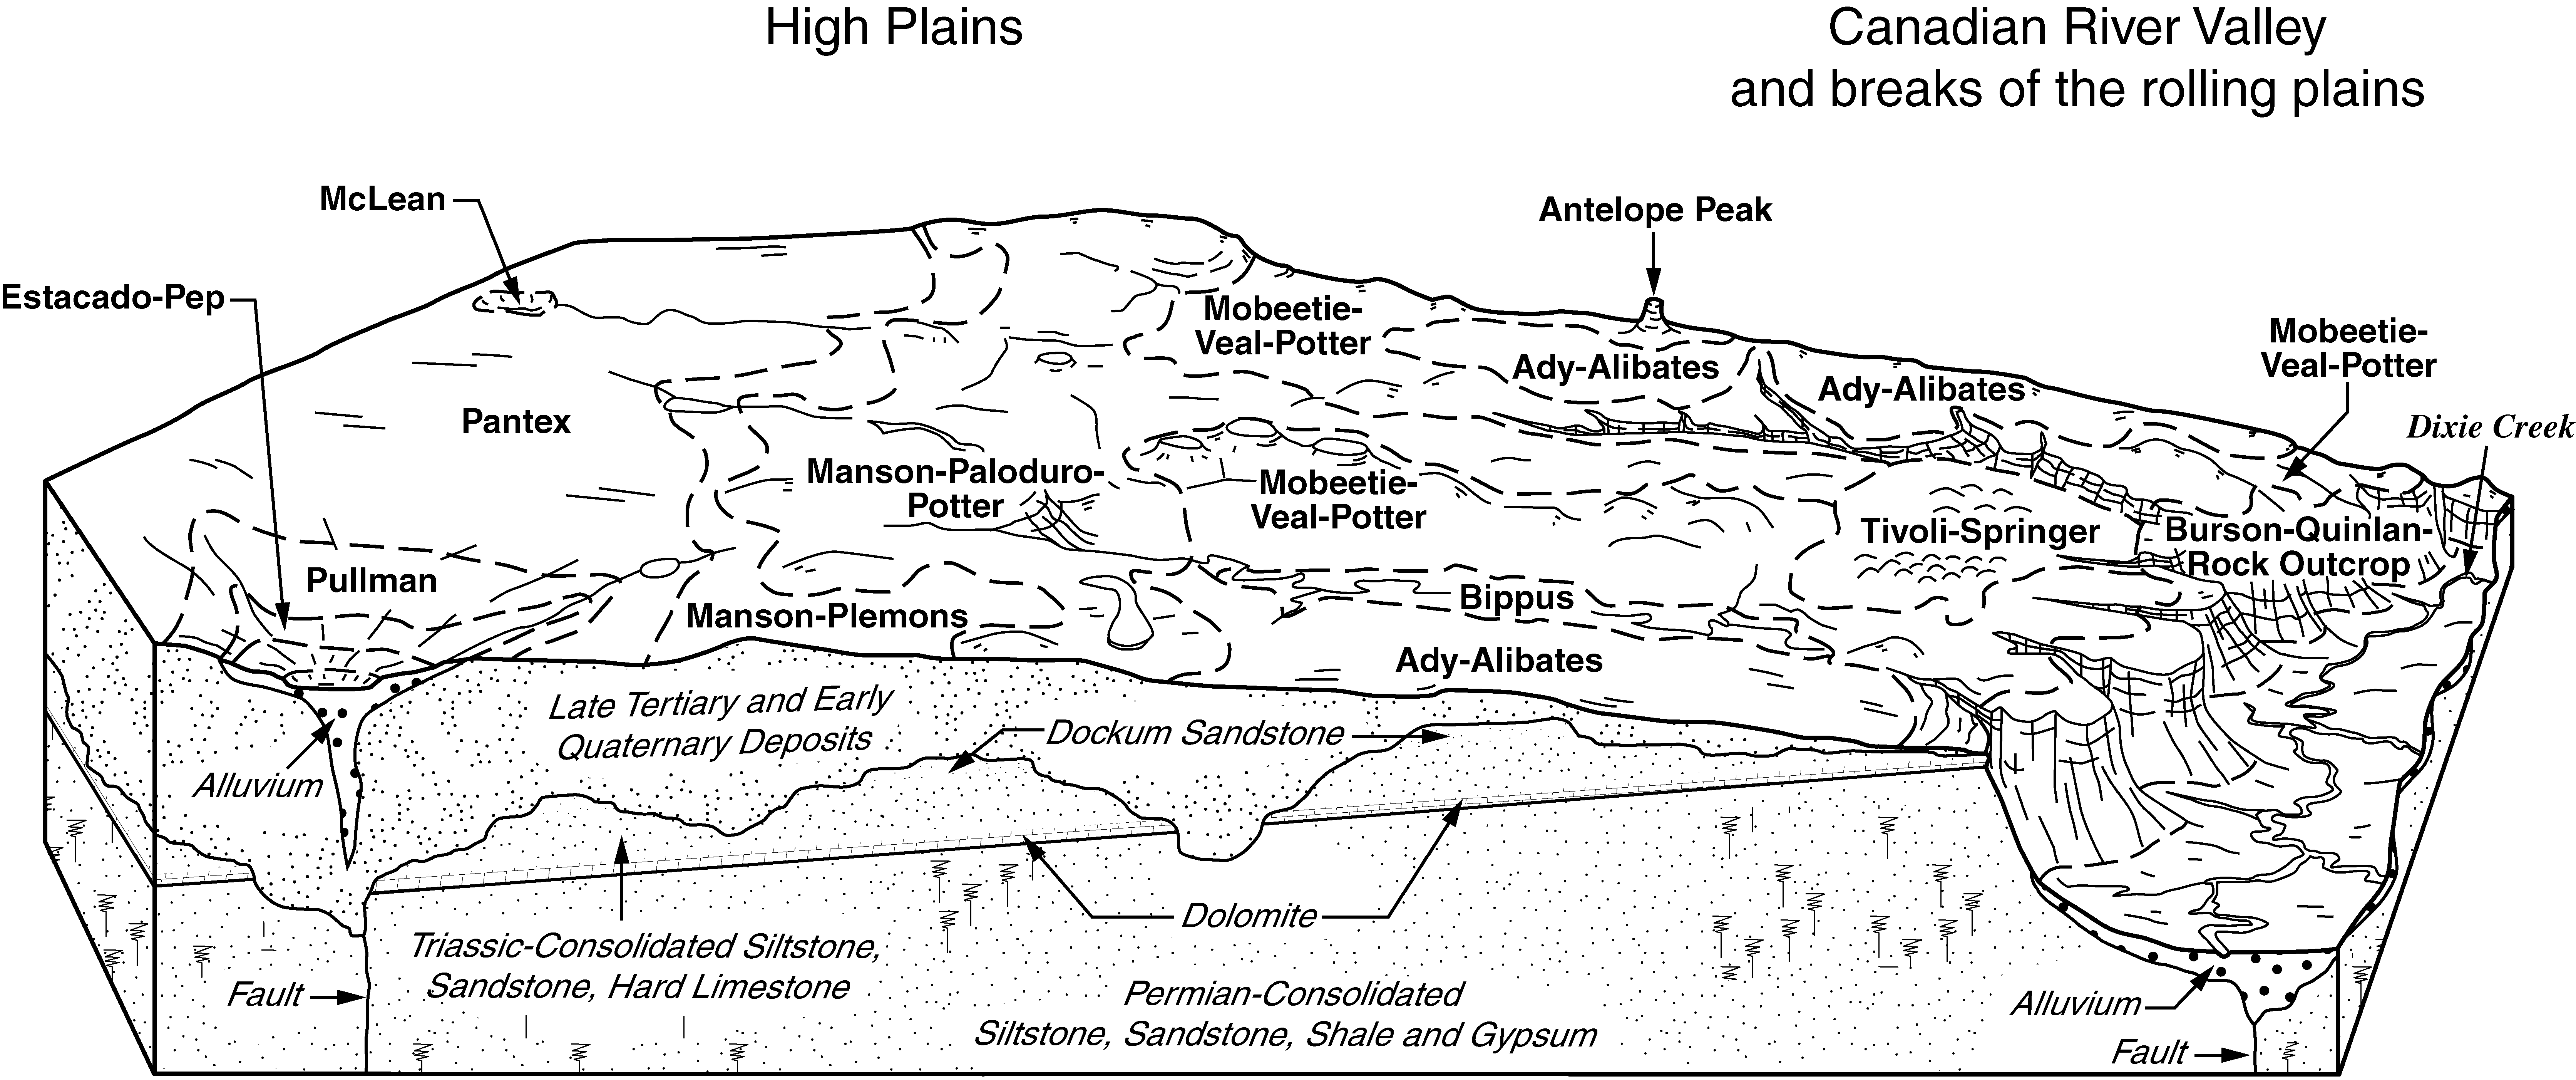
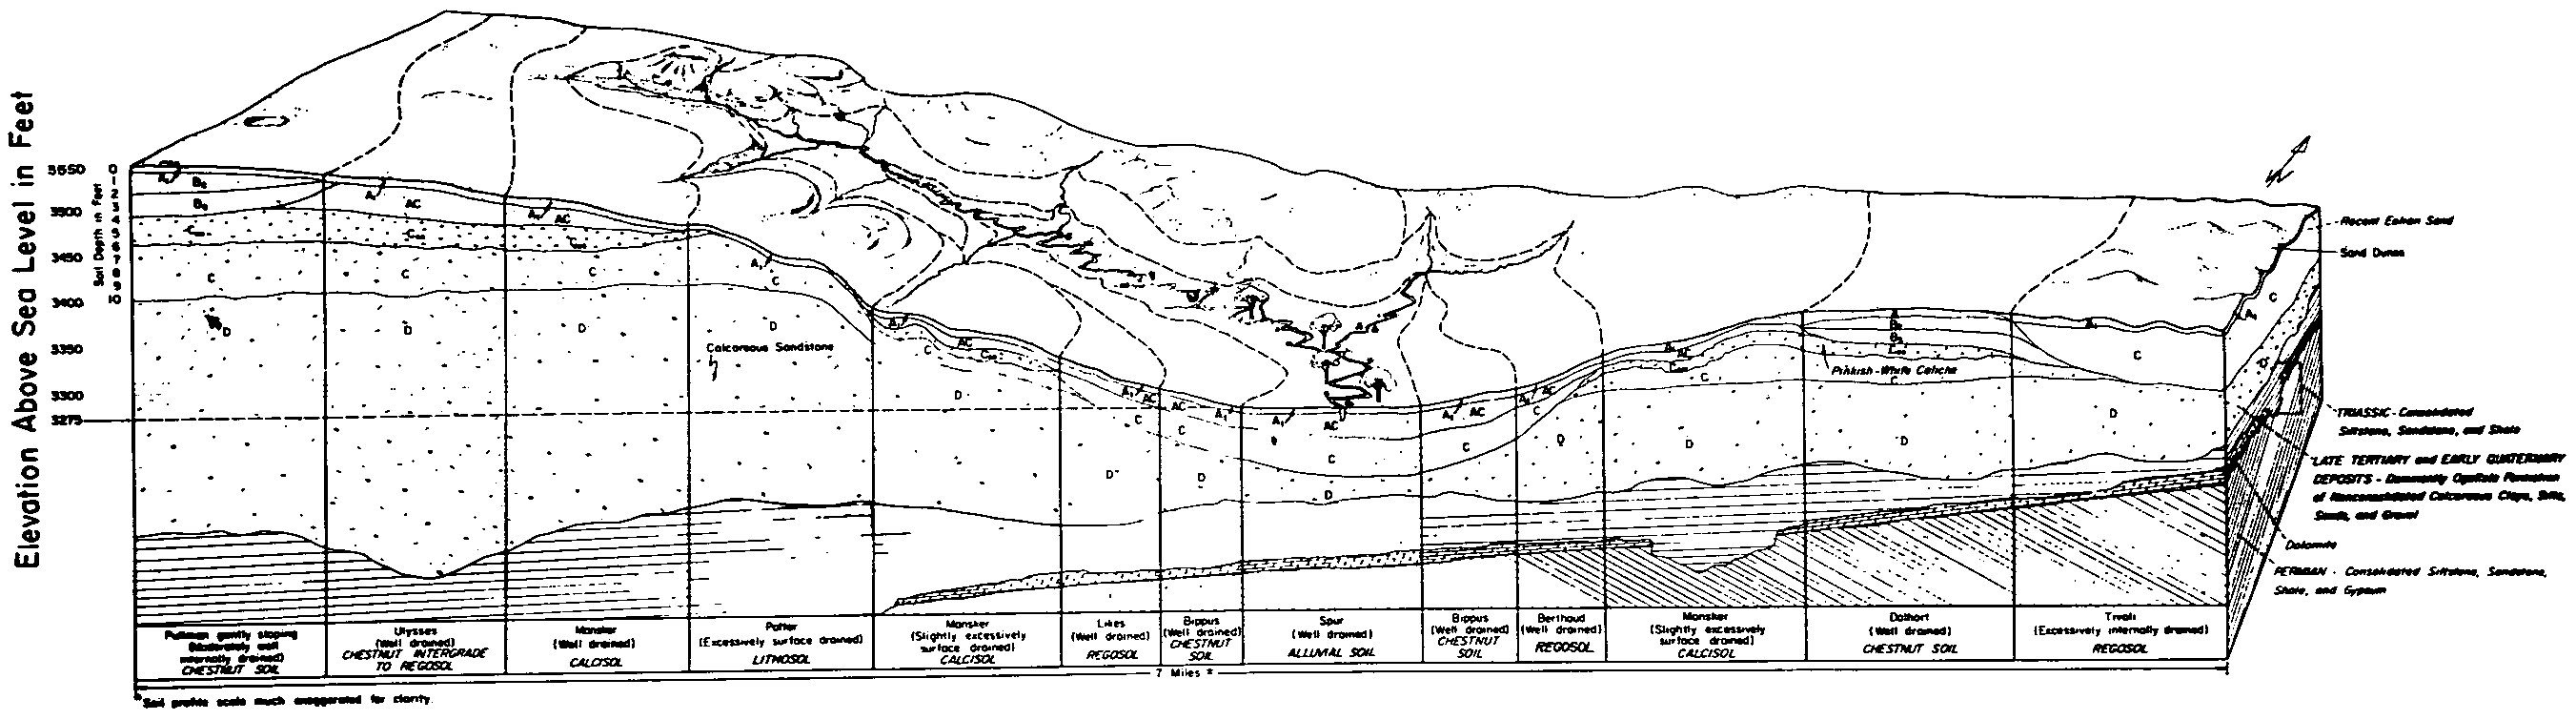
    Soil toposequence of the escarpment separating the High Plains from the Rolling Plains (Soil Survey of Carson County, TX; 1962).

  44. TX-2012-03-20-20 | Childress County - July 1963

    Soils developed in eolian materials (Soil Survey of Childress County, TX; 1963).

  45. TX-2012-03-20-35 | Dawson County - August 1960

    Soils on high plains developed from sandy parent material (Soil Survey of Dawson County, TX; 1960).

  46. TX-2012-03-21-21 | Lamb County - March 1962

    Some soils of general soil area 3 (Soil Survey of Lamb County, TX; 1962).

  47. TX-2012-03-21-36 | Lipscomb County - December 1975

    Pattern of soils and underlying material in association 3 (Soil Survey of Lipscomb County, TX; 1975).

  48. TX-2012-03-21-92 | Terry County - February 1962

    Soils developed from sandy parent material (Soil Survey of Terry County, TX; 1962).

  49. TX-2012-03-22-04 | Wheeler County - October 1975

    Relationship of soils in the Devol-Tivoli association to parent material and relief (Soil Survey of Wheeler County, TX; 1975).

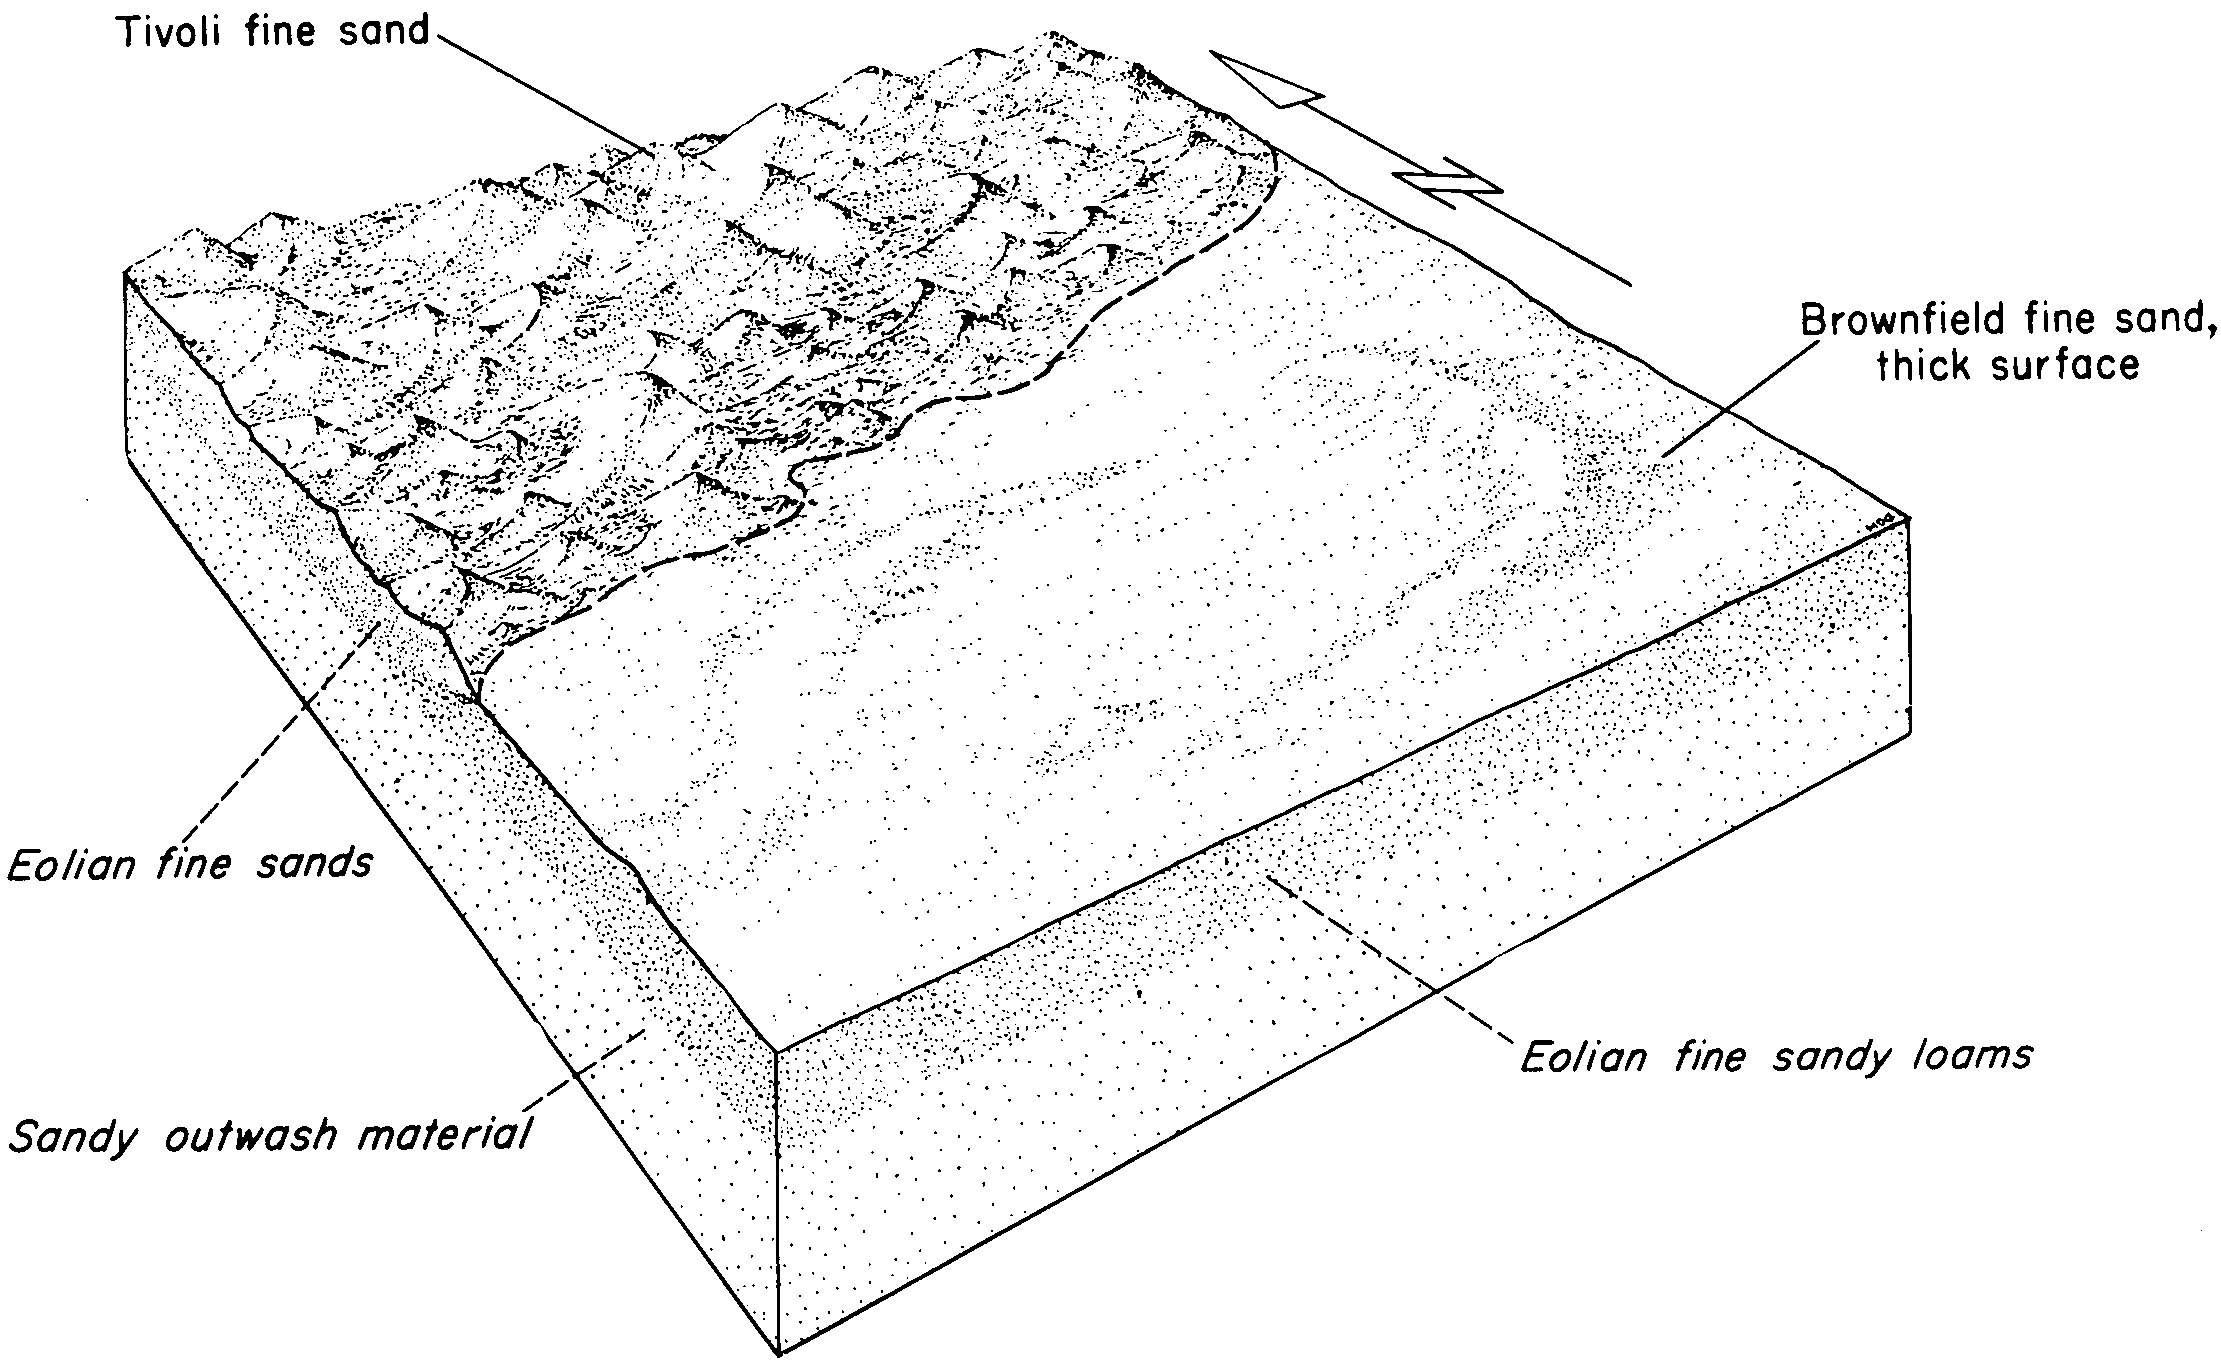
  50. TX-2012-03-22-08 | Wilbarger County - September 1962

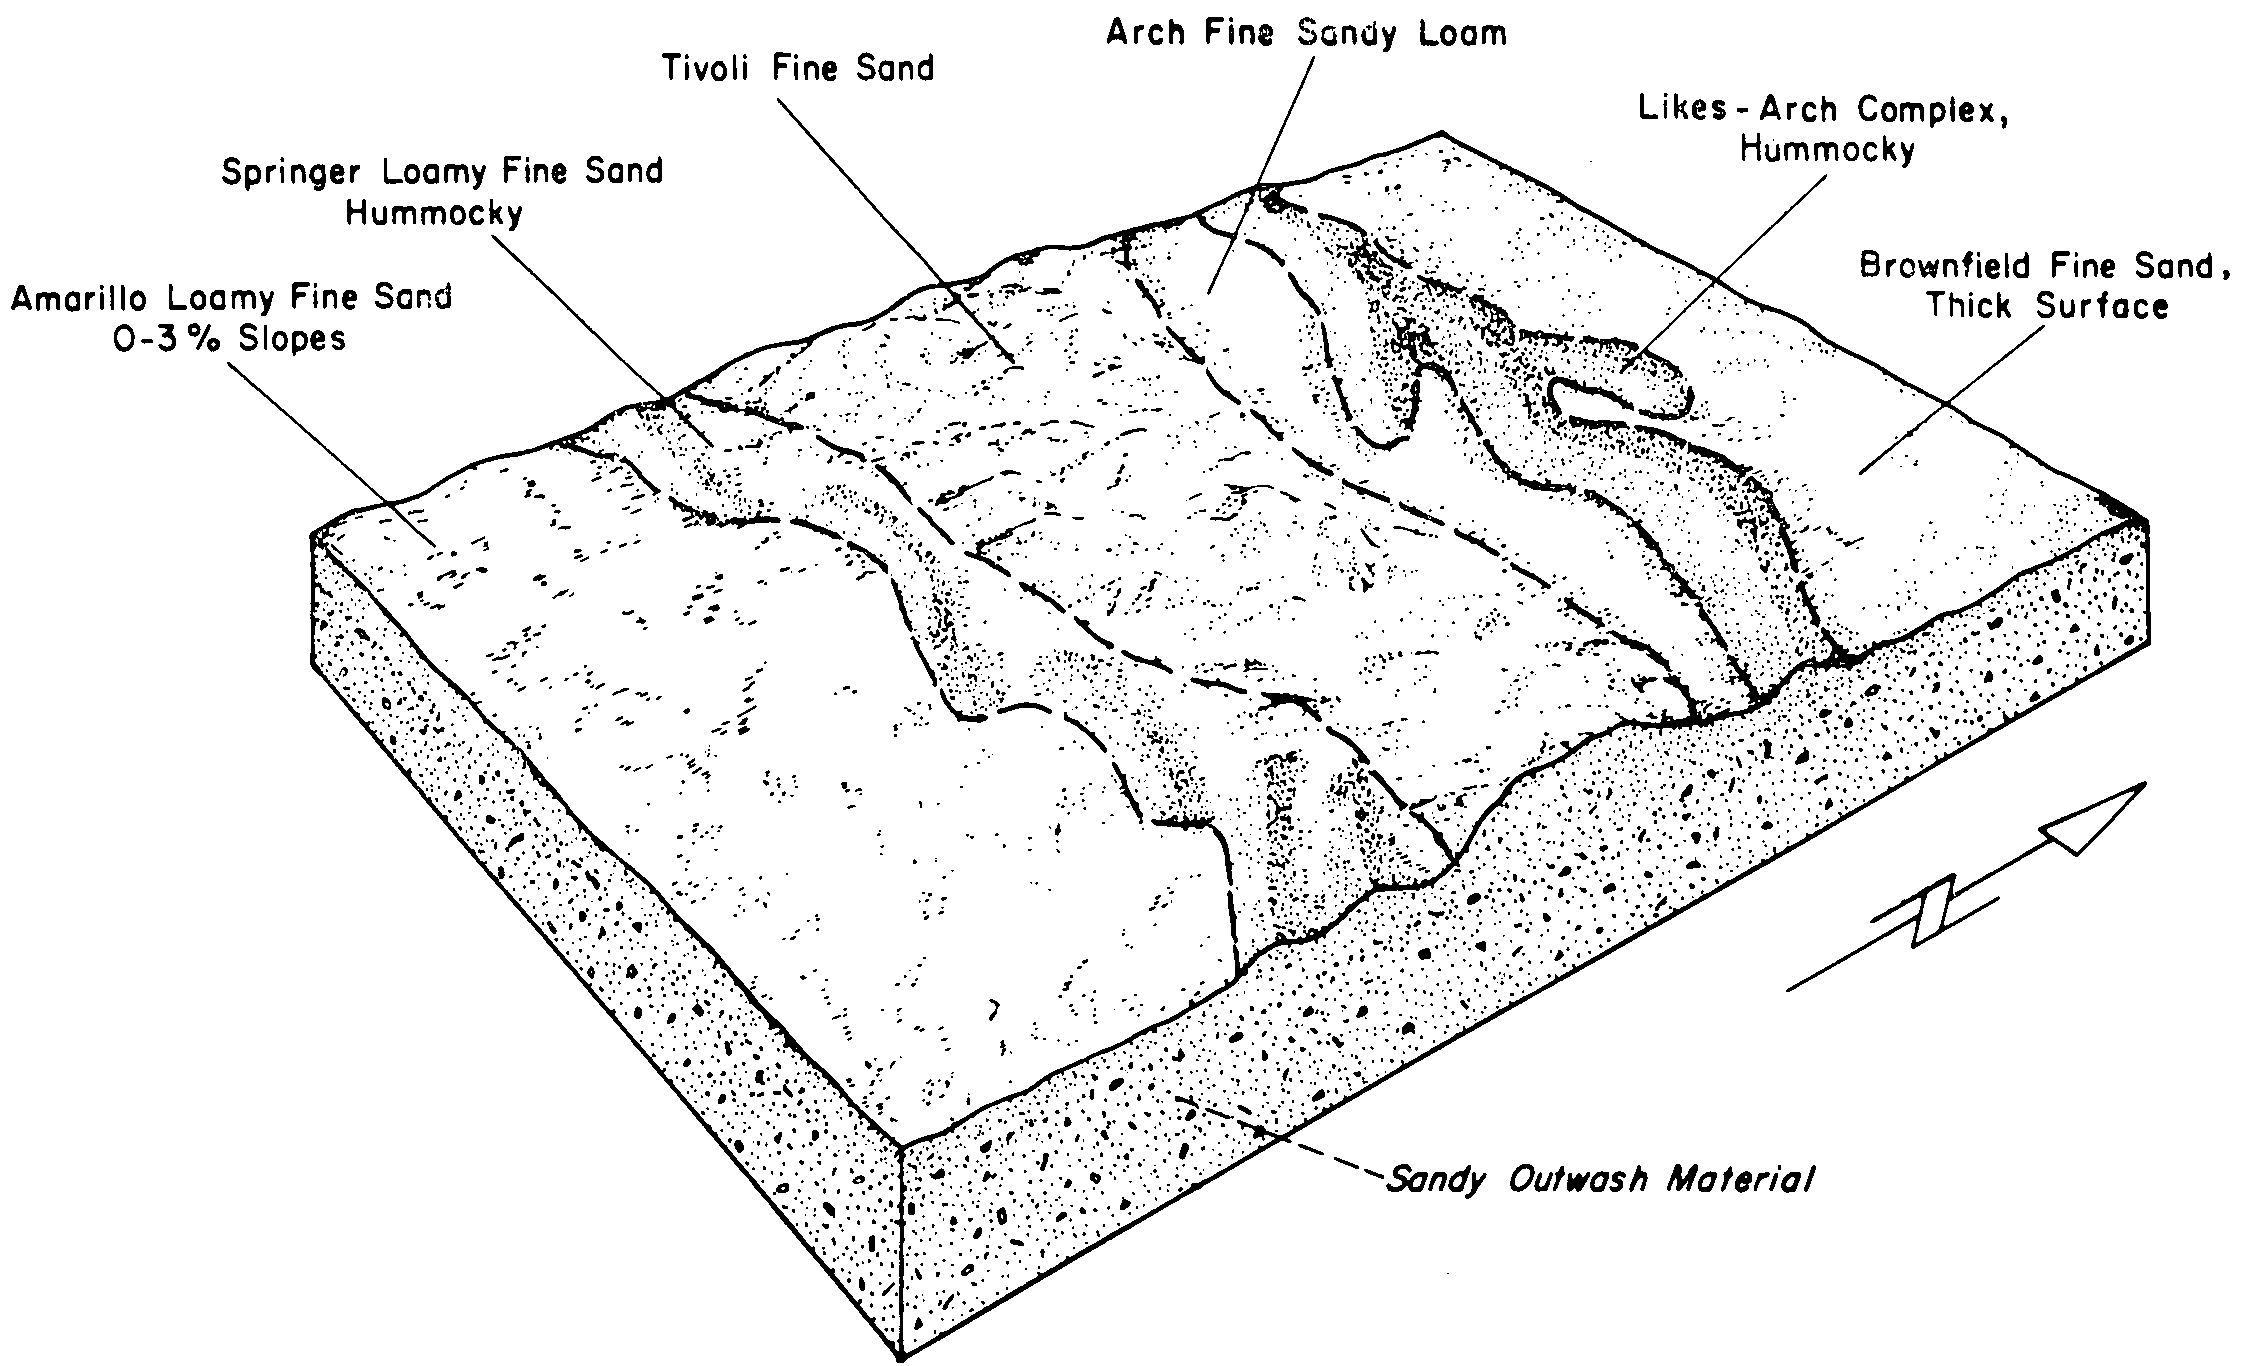
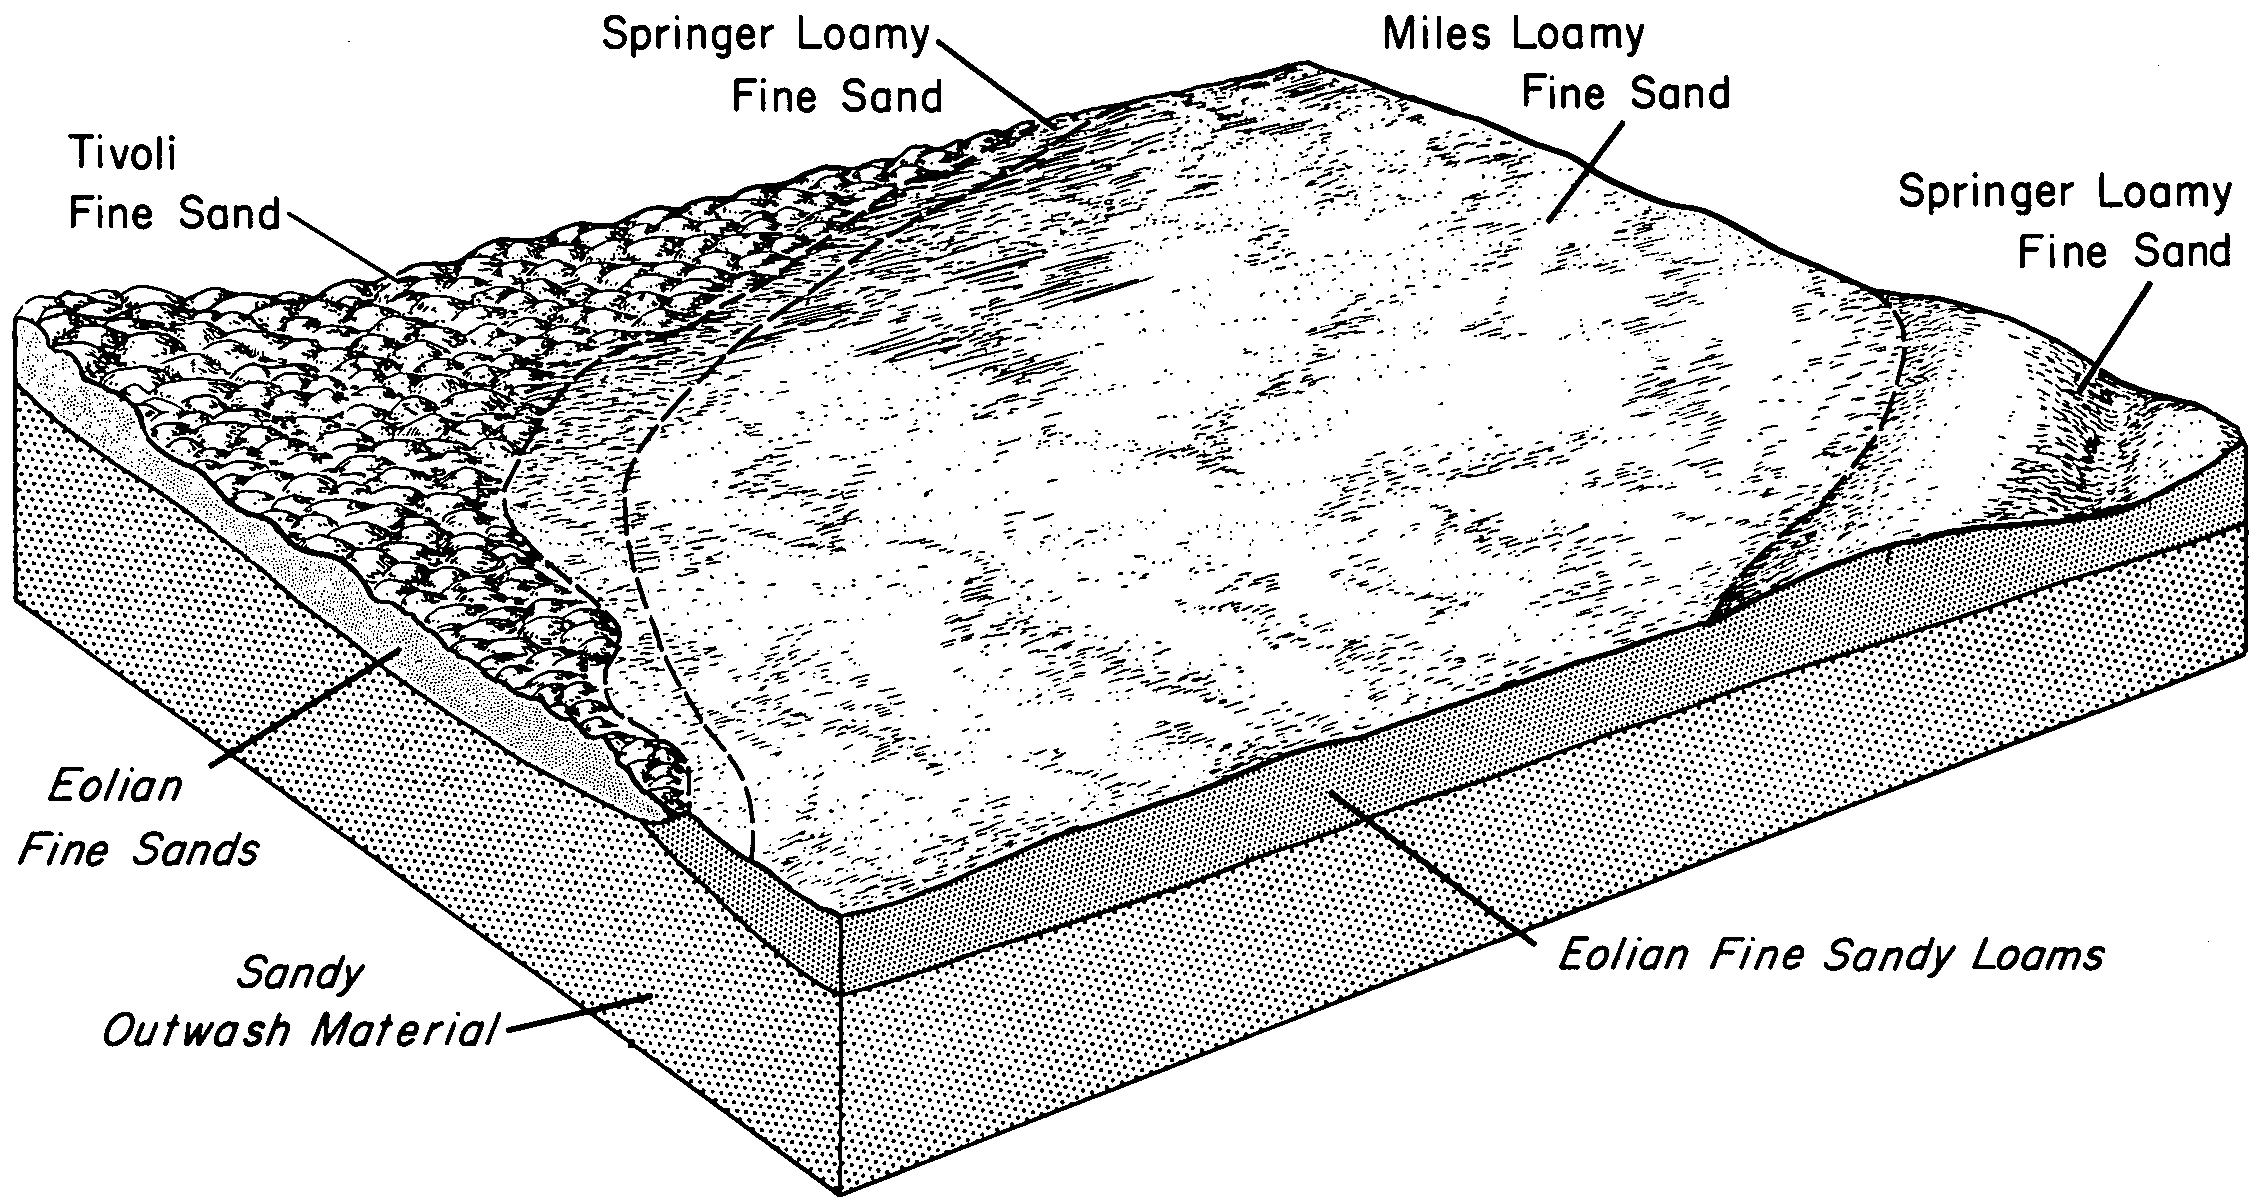
    Block diagram showing the geographical association of the soils in association 2. Here, the soils formed in a mantle of windblown sand, which lies over sandy outwash material (Soil Survey of Wilbarger County, TX; 1962).

Map Units

Map units containing TIVOLI as a major component. Limited to 250 records.

Map Unit Name Symbol Map Unit Area (ac) Map Unit Key National Map Unit Symbol Soil Survey Area Publication Date Map Scale
Tivoli sandTn14752942153516co00919661:20000
Tivoli-Dune land complexTo10978942133514co00919661:20000
Eda-Tivoli sands, 1 to 12 percent slopes5447463031560492yd7jks00719731:24000
Pratt-Tivoli loamy fine sands, 5 to 15 percent slopes5941358213825141hdm7ks00719731:24000
Tivoli fine sand, 5 to 30 percent slopes5972137113825252sg3bks00719731:24000
Goltry-Tivoli fine sands, 5 to 12 percent slopes62011832211332y2rzks00719731:24000
Pratt-Tivoli loamy fine sands, 5 to 15 percent slopes5941465614404962ww14ks00919791:24000
Eda-Tivoli sands, 1 to 12 percent slopes54472617531560502yd7jks02519801:24000
Tivoli fine sand, 5 to 30 percent slopes59721361613817462sg3bks02519801:24000
Pratt-Tivoli loamy fine sands, 5 to 15 percent slopes5941104313817381hct6ks02519801:24000
Eda-Tivoli sands, 1 to 12 percent slopes54471585231560512yd7jks03319871:24000
Pratt-Tivoli loamy fine sands, 5 to 15 percent slopes5941566313812841hcbkks03319871:24000
Tivoli fine sand, 5 to 30 percent slopes5972399313812942sg3bks03319871:24000
Lincoln-Tivoli complex, 0 to 10 percent slopes60634577138294230yqlks03519771:24000
Attica-Tivoli loamy fine sands, 3 to 15 percent slopes5866128713829212wtxkks03519771:24000
Tivoli fine sand, 10 to 30 percent slopes59729013829712ww15ks03519771:24000
Pratt-Tivoli loamy fine sands, 5 to 15 percent slopes59412835613803892ww14ks04719671:24000
Tivoli fine sand, 10 to 30 percent slopes59721253913803962ww15ks04719671:24000
Pratt-Tivoli loamy fine sands, 5 to 15 percent slopes59411959513804612ww14ks05719621:24000
Tivoli fine sand, 10 to 30 percent slopes5972755514731922ww15ks05719621:24000
Las Animas-Tivoli complex, 0 to 6 percent slopes, occasionally flooded1189119413804381hbg8ks05719621:24000
Tivoli fine sand, 4 to 20 percent slopes, eroded281020713804721hbhcks05719621:24000
Pratt-Tivoli loamy fine sands, 5 to 15 percent slopes59412435214689062ww14ks06919651:24000
Tivoli fine sand, 10 to 30 percent slopes5972122813827462ww15ks07719651:24000
Goltry-Tivoli fine sands, 5 to 12 percent slopes620186932211362y2rzks07719651:24000
Pratt-Tivoli loamy fine sands, 5 to 15 percent slopes59412413827251hdv1ks07719651:24000
Pratt-Tivoli loamy fine sands, 5 to 15 percent slopes5941338611554582ww14ks07919701:24000
Pratt-Tivoli loamy fine sands, 5 to 15 percent slopes5941446914448022ww14ks09519771:24000
Tivoli fine sand, 10 to 30 percent slopes5972124716515722ww15ks09519771:24000
Pratt-Tivoli loamy fine sands, 5 to 15 percent slopes59413482813805392ww14ks09719831:24000
Tivoli fine sand, 10 to 30 percent slopes5972914913805482ww15ks09719831:24000
Tivoli fine sand, 10 to 30 percent slopes5972214551471kv67ks11919731:24000
Pratt-Tivoli loamy fine sands, 5 to 15 percent slopes5941812813801442ww14ks14519761:24000
Tivoli fine sand, 10 to 30 percent slopes5972142513801492ww15ks14519761:24000
Pratt-Tivoli loamy fine sands, 5 to 15 percent slopes5941173314451612ww14ks15119651:24000
Pratt-Tivoli loamy fine sands, 5 to 15 percent slopes5941167414332982ww14ks15919711:24000
Pratt-Tivoli loamy fine sands, 5 to 15 percent slopes5941237414439852ww14ks17319761:24000
Pratt-Tivoli loamy fine sands, 5 to 15 percent slopes59412414614436692ww14ks18519751:24000
Tivoli fine sand, 10 to 30 percent slopes5972242714446252ww15ks19119741:24000
Lincoln-Tivoli complex, 0 to 10 percent slopes6063881144463230yqlks19119741:24000
Tivoli fine sandTF46886376381dmnbnm02119681:31680
Tivoli-Springer complexTG14899376382dmncnm02119681:31680
Tivoli fine sandTF38607376198dmgfnm67619691:31680
Goltry-Tivoli fine sands, 5 to 12 percent slopesGoTE1182730411132y2rzok00319711:24000
Aline-Tivoli complex, 5 to 12 percent slopesAlTE17123814092y2s0ok00319711:24000
Jester and Tivoli soils, 1 to 30 percent slopes576520381696dt5sok00919781:24000
Eda-Tivoli sands, 1 to 12 percent slopesEdsF33816812yd7jok00919781:24000
Tivoli fine sand, 5 to 30 percent slopesTrD4853817782sg3bok01119651:24000
Eda and Tivoli soils, 3 to 12 percent slopesPvC5046382245dtrhok03319611:24000
Eda-Tivoli complex, 5 to 12 percent slopesPtE31343823372sg3cok03919731:24000
Eda-Tivoli sands, 1 to 12 percent slopesPt75013823902yd7jok04319611:24000
Tivoli fine sand, 5 to 30 percent slopesTv54553824032sg3bok04319611:24000
Tivoli fine sand, 5 to 30 percent slopesTv36213824732sg3bok04519631:24000
Tivoli fine sand, 5 to 12 percent slopesTvlE20603383040dvl4ok05919981:24000
Tivoli fine sand, 12 to 45 percent slopesTvlG10410383043dvl7ok05919981:24000
Tivoli fine sand, 1 to 5 percent slopesTvlC1869383038dvl2ok05919981:24000
Tivoli fine sand, 5 to 30 percent slopesTrD58873838692sg3bok09319651:24000
Eda-Tivoli sands, 1 to 12 percent slopesPtD57993838512yd7jok09319651:24000
Tivoli fine sand, 5 to 30 percent slopesTivG367753852412sg3bok15119951:24000
Tivoli loamy fine sand, 5 to 12 percent slopesTviE18070385242dxw5ok15119951:24000
Dune land-Tivoli complex, 3 to 60 percent slopesDuTH4507385174dxszok15119951:24000
Eda-Tivoli sands, 1 to 12 percent slopesPt616123852942yd7jok15319611:24000
Tivoli fine sand, 5 to 30 percent slopesTv236503853042sg3bok15319611:24000
Tivoli fine sand, 5 to 30 percent slopesTfF38053633012sg3btx04519721:20000
Tivoli-Springer association, 1 to 8 percent slopesTSD1204393895f6w9tx06520001:24000
Tivoli fine sand51676363906d6nxtx07719771:24000
Tivoli fine sand, 5 to 30 percent slopesTv98293641292sg3btx08719651:20000
Devol and Tivoli soils, hummockyStD1608364619d7dxtx10119691:20000
Tivoli fine sand, dry, 5 to 30 percent slopesTv4653647452t3rktx10719641:20000
Tivoli fine sand, 5 to 30 percent slopesTf82663652092sg3btx12919751:24000
Tivoli fine sand, dry, 5 to 30 percent slopesTs44473658132t3rktx15119641:24000
Tivoli fine sand, dry, 5 to 30 percent slopesTv20113783592t3rktx16919651:24000
Heatly-Tivoli complex, 0 to 8 percent slopesTw4203783602vt8ftx16919651:24000
Tivoli fine sand, 5 to 30 percent slopesTf205433919562sg3btx17919651:20000
Tivoli fine sand, 5 to 30 percent slopesTv208373669692sg3btx19119651:20000
Tivoli fine sand, 5 to 30 percent slopesTv107263671692sg3btx19719651:20000
Tivoli-Nobscot complex, 5 to 15 percent slopesTvND69427134442r5rztx20719601:20000
Heatly-Tivoli complex, 0 to 8 percent slopesBtB35233684742vt8ftx26319681:31680
Tivoli fine sand, dry, 5 to 30 percent slopesTv31813685072t3rktx26319681:31680
Nobscot and Tivoli soils, undulatingNtB418368492dcfvtx26319681:31680
Tivoli fine sand, dry, 5 to 30 percent slopesTf120933707452t3rktx33519651:20000
Tivoli fine sand, dry, 5 to 30 percent slopesTf82653708972t3rktx34519721:24000
Devol and Tivoli soils, 1 to 8 percent slopesDtD1495370858dfx5tx34519721:24000
Tivoli fine sandTf79173124171dg6ftx35919781:24000
Tivoli-Springer association, undulatingTSD23203124236dgfktx37519741:24000
Tivoli fine sand, dry, 5 to 30 percent slopesTv29693720362t3rktx41519661:24000
Tivoli fine sand, 5 to 30 percent slopesTv292553733292sg3btx48319701:24000
Blown-out land-Tivoli complexBt906373282djfctx48319701:24000
Tivoli fine sandTv1035373391djjwtx48519721:20000
Tivoli fine sand, 5 to 30 percent slopesTv121043734502sg3btx48719601:20000

Map of Series Extent

Approximate geographic distribution of the TIVOLI soil series. To learn more about how this distribution was mapped, or to compare this soil series extent to others, use the Series Extent Explorer (SEE) application. Source: generalization of SSURGO geometry .