| Mitten and Tevis families, steep mountain slopes, very stony | 64QC | 61398 | 2809124 | 2tr6m | mt603 | 1989 | 1:24000 |
Mitten and Tevis families, moderately steep mountain slopes | 30QC | 55943 | 2809066 | 2tr4r | mt603 | 1989 | 1:24000 |
Mitten family, extremely stony-Rock outcrop-Tevis family, extremely stony complex, stream breaklands | 60QC | 42006 | 2809106 | 2tr60 | mt603 | 1989 | 1:24000 |
Mitten-Tevis families, complex, moderately steep mountain slopes | 30QG | 35092 | 2809069 | 2tr4v | mt603 | 1989 | 1:24000 |
Mitten-Tevis families complex, steep mountain slopes, very stony | 64QG | 19210 | 2809127 | 2tr6q | mt603 | 1989 | 1:24000 |
Mitten family, extremely stony-Rock outcrop-Tevis family, extremely stony complex, dissected stream breaklands | 61QC | 18816 | 2809109 | 2tr64 | mt603 | 1989 | 1:24000 |
Tevis-Mitten families, complex, moderately steep mountain slopes | 30MG | 7820 | 2809061 | 2tr4l | mt603 | 1989 | 1:24000 |
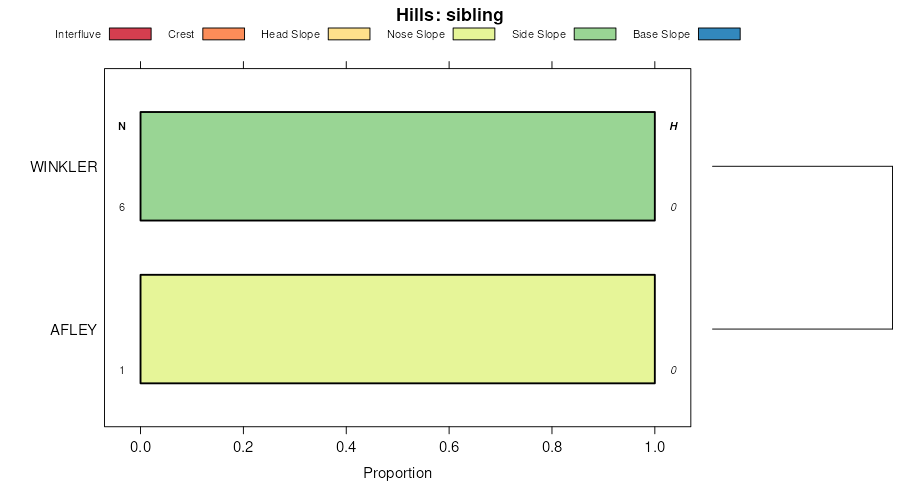
Afley-Tevis families, complex, broadly convex ridges | 32QD | 5376 | 2809075 | 2tr52 | mt603 | 1989 | 1:24000 |
Mitten-Tevis complex, 30 to 60 percent slopes | 71 | 1068 | 2995508 | 4wd9 | mt603 | 1989 | 1:24000 |
Tevis family-Rock outcrop complex, stream breaklands | 60KA | 930 | 2809097 | 2tr5r | mt603 | 1989 | 1:24000 |
Mitten-Tevis complex, 35 to 60 percent slopes | 132F | 656 | 2995555 | 574d | mt603 | 1989 | 1:24000 |
Tevis family, moderately steep mountain slopes, moderately well weathered granitic substratum | 30KA | 547 | 2809052 | 2tr49 | mt603 | 1989 | 1:24000 |
Tevis family, moderately steep mountain slopes, well weathered granitic substratum | 30GA | 324 | 2809050 | 2tr46 | mt603 | 1989 | 1:24000 |
Tevis gravelly loam, 30 to 60 percent slopes | 102 | 200 | 2995474 | 4w90 | mt603 | 1989 | 1:24000 |
Tevis gravelly loam, 15 to 35 percent slopes | 30E | 183 | 2995579 | 579b | mt603 | 1989 | 1:24000 |
Tevis gravelly loam, 35 to 60 percent slopes | 30F | 172 | 2995580 | 579c | mt603 | 1989 | 1:24000 |
Tevis gravelly loam, dry, 35 to 60 percent slopes | 31F | 149 | 2995583 | 579h | mt603 | 1989 | 1:24000 |
Tevis gravelly loam, 35 to 60 percent slopes | 486F | 118 | 2995538 | 4wp8 | mt603 | 1989 | 1:24000 |
Tevis family, steep mountain slopes | 64KA | 109 | 2809112 | 2tr67 | mt603 | 1989 | 1:24000 |
Tevis gravelly loam, dry, 15 to 35 percent slopes | 31E | 101 | 2995582 | 579g | mt603 | 1989 | 1:24000 |
Tevis-Rubble land complex, 40 to 70 percent slopes | 30G | 56 | 2995581 | 579d | mt603 | 1989 | 1:24000 |
Tevis-Rock outcrop complex, 30 to 60 percent slopes | 441F | 47 | 2995617 | 57dv | mt603 | 1989 | 1:24000 |
Tevis gravelly loam, 15 to 35 percent slopes | 486E | 5 | 2995537 | 4wp7 | mt603 | 1989 | 1:24000 |
Tevis gravelly loam, dry, 15 to 35 percent slopes | 31E | 1319 | 580937 | mhhx | mt618 | 2008 | 1:24000 |
Tevis gravelly loam, 35 to 60 percent slopes | 30F | 195 | 157049 | 58f3 | mt618 | 2008 | 1:24000 |
Tevis gravelly loam, 15 to 35 percent slopes | 30E | 146 | 157048 | 58f2 | mt618 | 2008 | 1:24000 |
Mitten family, extremely stony-Rock outcrop-Tevis family, extremely stony complex, stream breaklands | 60QC | 0 | 2995296 | 2tr60 | mt621 | 1997 | 1:24000 |
Mitten and Tevis families, steep mountain slopes, very stony | 64QC | 0 | 2995301 | 2tr6m | mt621 | 1997 | 1:24000 |
Mitten-Tevis families, complex, moderately steep mountain slopes | 30QG | 0 | 2995300 | 2tr4v | mt621 | 1997 | 1:24000 |
Mitten and Tevis families, moderately steep mountain slopes | 30QC | 0 | 2995298 | 2tr4r | mt621 | 1997 | 1:24000 |
Tevis very gravelly loam, 30 to 60 percent slopes | 162 | 4181 | 145065 | 4vyj | mt629 | 1991 | 1:20000 |
Courville-Troybull-Tevis complex, 35 to 75 percent slopes | 2355F | 9785 | 3164844 | 2yywb | mt634 | 1988 | 1:24000 |
Tevis-Courville complex, 15 to 60 percent slopes | 2302F | 1745 | 3164839 | 2yyw5 | mt634 | 1988 | 1:24000 |
Badmedicine-Felixcreek-Tevis complex, 20 to 60 percent slopes | 2109F | 1716 | 3164846 | 2yyvz | mt634 | 1988 | 1:24000 |
Mitten-Tevis families complex, steep mountain slopes, very stony | 64QG | 22 | 3164861 | 2tr6q | mt634 | 1988 | 1:24000 |
Afley-Tevis families, complex, broadly convex ridges | 32QD | 0 | 2995314 | 2tr52 | mt635 | 2006 | 1:24000 |
Mitten-Tevis complex, 30 to 60 percent slopes | 71 | 35375 | 145492 | 4wd9 | mt638 | 1985 | 1:24000 |
Tevis gravelly loam, 30 to 60 percent slopes | 102 | 29985 | 145390 | 4w90 | mt638 | 1985 | 1:24000 |
Tevis-Mitten complex, 8 to 30 percent slopes | 103 | 4652 | 145391 | 4w91 | mt638 | 1985 | 1:24000 |
Tevis-Mitten-Rock outcrop complex, 45 to 70 percent slopes | 104 | 3735 | 145392 | 4w92 | mt638 | 1985 | 1:24000 |
Mitten-Tevis families, complex, moderately steep mountain slopes | 30QG | 845 | 2995335 | 2tr4v | mt638 | 1985 | 1:24000 |
Mitten family, extremely stony-Rock outcrop-Tevis family, extremely stony complex, stream breaklands | 60QC | 382 | 2995357 | 2tr60 | mt638 | 1985 | 1:24000 |
Mitten-Tevis families complex, steep mountain slopes, very stony | 64QG | 361 | 2995368 | 2tr6q | mt638 | 1985 | 1:24000 |
Mitten and Tevis families, steep mountain slopes, very stony | 64QC | 317 | 2995365 | 2tr6m | mt638 | 1985 | 1:24000 |
Mitten and Tevis families, moderately steep mountain slopes | 30QC | 93 | 2995332 | 2tr4r | mt638 | 1985 | 1:24000 |
Afley-Tevis families, complex, broadly convex ridges | 32QD | 52 | 2995338 | 2tr52 | mt638 | 1985 | 1:24000 |
Mitten family, extremely stony-Rock outcrop-Tevis family, extremely stony complex, dissected stream breaklands | 61QC | 7 | 2995359 | 2tr64 | mt638 | 1985 | 1:24000 |
Tevis gravelly loam, 35 to 60 percent slopes | 486F | 3070 | 145770 | 4wp8 | mt644 | 1995 | 1:24000 |
Tevis gravelly loam, 15 to 35 percent slopes | 486E | 2476 | 145769 | 4wp7 | mt644 | 1995 | 1:24000 |
Tevis gravelly loam, 4 to 15 percent slopes | 486D | 742 | 145768 | 4wp6 | mt644 | 1995 | 1:24000 |
Mitten-Tevis families complex, steep mountain slopes, very stony | 64QG | 125 | 2995387 | 2tr6q | mt644 | 1995 | 1:24000 |
Mitten-Tevis families, complex, moderately steep mountain slopes | 30QG | 27 | 2995379 | 2tr4v | mt644 | 1995 | 1:24000 |
Tevis gravelly loam, 35 to 60 percent slopes | 30F | 12377 | 155972 | 579c | mt651 | 1997 | 1:24000 |
Mitten-Tevis complex, 35 to 60 percent slopes | 132F | 10547 | 155818 | 574d | mt651 | 1997 | 1:24000 |
Tevis gravelly loam, 15 to 35 percent slopes | 30E | 9485 | 155971 | 579b | mt651 | 1997 | 1:24000 |
Tevis gravelly loam, dry, 35 to 60 percent slopes | 31F | 3474 | 155976 | 579h | mt651 | 1997 | 1:24000 |
Tevis-Rubble land complex, 40 to 70 percent slopes | 30G | 2897 | 155973 | 579d | mt651 | 1997 | 1:24000 |
Tevis gravelly loam, dry, 15 to 35 percent slopes | 31E | 2420 | 155975 | 579g | mt651 | 1997 | 1:24000 |
Tevis-Rock outcrop complex, 30 to 60 percent slopes | 441F | 1056 | 156080 | 57dv | mt651 | 1997 | 1:24000 |
Mitten and Tevis families, moderately steep mountain slopes | 30QC | 745 | 2995415 | 2tr4r | mt651 | 1997 | 1:24000 |
Mitten family, extremely stony-Rock outcrop-Tevis family, extremely stony complex, dissected stream breaklands | 61QC | 294 | 2995437 | 2tr64 | mt651 | 1997 | 1:24000 |
Mitten and Tevis families, steep mountain slopes, very stony | 64QC | 253 | 2995443 | 2tr6m | mt651 | 1997 | 1:24000 |
Mitten-Tevis families, complex, moderately steep mountain slopes | 30QG | 123 | 2995418 | 2tr4v | mt651 | 1997 | 1:24000 |
Mitten family, extremely stony-Rock outcrop-Tevis family, extremely stony complex, stream breaklands | 60QC | 118 | 2995435 | 2tr60 | mt651 | 1997 | 1:24000 |
Tevis-Mitten families, complex, moderately steep mountain slopes | 30MG | 99 | 2995412 | 2tr4l | mt651 | 1997 | 1:24000 |
Tevis-Courville complex, 15 to 60 percent slopes | 2302F | 75 | 3164849 | 2yyw5 | mt651 | 1997 | 1:24000 |
Courville-Troybull-Tevis complex, 35 to 75 percent slopes | 2355F | 9 | 3164852 | 2yywb | mt651 | 1997 | 1:24000 |


