| Storm-Sambrito family complex, 20 to 45 percent slopes | 66 | 10524 | 509374 | k31f | co647 | | 1:24000 |
Boatsteam-Storm family, very bouldery-Pineguest family complex, 30 to 55 percent slopes | 76 | 7207 | 509398 | k326 | co647 | | 1:24000 |
Arrowpeak-Storm family association, 35 to 75 percent slopes, very stony | 26 | 2102 | 509322 | k2zr | co647 | | 1:24000 |
Targhee-Storm families complex, 5 to 40 percent slopes | 302B | 10400 | 507541 | k149 | co650 | | 1:24000 |
Storm, very stony-Targhee families, complex, 35 to 70 percent slopes | 303C | 8940 | 507542 | k14b | co650 | | 1:24000 |
Storm family very cobbly sandy clay loam, 10 to 65 percent slopes | 140 | 12039 | 505046 | jyjt | co663 | 2000 | 1:24000 |
Vanwirt-Storm complex, 5 to 40 percent slopes | 144 | 6221 | 505050 | jyjy | co663 | 2000 | 1:24000 |
Storm extremely flaggy loam, 0 to 15 percent slopes | 832 | 8970 | 507275 | k0vq | co672 | 2003 | 1:24000 |
Storm extremely flaggy loam, 15 to 30 percent slopes | 816 | 6974 | 507268 | k0vh | co672 | 2003 | 1:24000 |
Lulude-Storm complex, 5 to 40 percent slopes | 127 | 6030 | 505179 | jyp3 | co674 | 1998 | 1:24000 |
Storm extremely flaggy loam, 0 to 15 percent slopes | 161 | 39 | 505219 | jyqd | co674 | 1998 | 1:24000 |
Lonniebee, very stony-Storm-Como, extremely stony families, complex, 15 to 60 percent slopes | 6280F | 578 | 3169250 | 2v2sj | mt600 | 1969 | 1:24000 |
Storm, very stony-Lonniebee, stony-Garlet families, complex, 15 to 60 percent slopes | 6370F | 95 | 3169265 | 2v2sh | mt600 | 1969 | 1:24000 |
Kamack-Dranburn families-Rock outcrop, complex, 25 to 70 percent slopes | 6347G | 74 | 3169263 | 2w752 | mt600 | 1969 | 1:24000 |
Storm family-Urban land complex, 1 to 8 percent slopes | 6999 | 6 | 3005131 | 2tyn1 | mt619 | 1988 | 1:24000 |
Storm, very stony-Lonniebee, stony-Garlet families, complex, 15 to 60 percent slopes | 6370F | 730 | 3094112 | 2v2sh | mt630 | 1991 | 1:24000 |
Lonniebee, very stony-Storm-Como, extremely stony families, complex, 15 to 60 percent slopes | 6280F | 5815 | 2838440 | 2v2sj | mt632 | | 1:24000 |
Helmville, very stony-Storm-Wander families, complex, 15 to 60 percent slopes | 6256F | 5337 | 2838446 | 2v2ss | mt632 | | 1:24000 |
Storm, stony-Mikesell, very stony-Sigbird, extremely stony, 8 to 35 percent slopes | 6335E | 5301 | 2968230 | 2wxbf | mt632 | | 1:24000 |
Storm, very stony-Lonniebee, stony-Garlet families, complex, 15 to 60 percent slopes | 6370F | 4371 | 2838439 | 2v2sh | mt632 | | 1:24000 |
Storm, rubbly-Cowood, rubbly families-Rock outcrop complex, 35 to 70 percent slopes | 6340G | 2124 | 2911039 | 2w758 | mt632 | | 1:24000 |
Kamack-Dranburn families-Rock outcrop, complex, 25 to 70 percent slopes | 6347G | 1614 | 2911033 | 2w752 | mt632 | | 1:24000 |
Cuberant-Cowood-Storm complex, 15 to 70 percent slopes, very stony | 6240G | 967 | 2911049 | 2w75g | mt632 | | 1:24000 |
Storm, extremely stony-Pricepeet, stony-Hierro families, complex, 2 to 15 percent slopes | 6257D | 722 | 2838445 | 2v2sr | mt632 | | 1:24000 |
Storm family-Urban land complex, 1 to 8 percent slopes | 6999 | 175 | 2826856 | 2tyn1 | mt632 | | 1:24000 |
Storm, very stony-Lonniebee, stony-Garlet families, complex, 15 to 60 percent slopes | 6370F | 251 | 3384093 | 2v2sh | mt633 | | 1:24000 |
Helmville, very stony-Storm-Wander families, complex, 15 to 60 percent slopes | 6256F | 80 | 3384191 | 2v2ss | mt633 | | 1:24000 |
Dromedary-Storm families, complex, 10 to 40 percent slopes, rubbly | 61 | 1372 | 812394 | w8c8 | ut651 | | 1:24000 |
Storm-Basaltlake-Butchlake families, complex, 25 to 70 percent slopes | 118 | 136 | 3302906 | 5977 | wy629 | | 1:24000 |
Grafen-Storm complex, 35 to 70 percent slopes | 6602 | 960 | 2487402 | 2phbs | wy635 | | 1:24000 |
Storm-Basaltlake-Butchlake families, complex, 25 to 70 percent slopes | 118 | 147762 | 157828 | 5977 | wy656 | 2008 | 1:24000 |
Telay-Storm-Needleton families, complex, 25 to 75 percent slopes | 116 | 86389 | 157827 | 5976 | wy656 | 2008 | 1:24000 |
Storm-Sigbird-Cuberant families, complex, 25 to 60 percent slopes | 176 | 38599 | 157842 | 597p | wy656 | 2008 | 1:24000 |
Storm-Cuberant-Needleton families, complex, 15 to 60 percent slopes | 177 | 25197 | 157843 | 597q | wy656 | 2008 | 1:24000 |
Storm-Basaltlake families-Rock outcrop complex, 15 to 25 percent slopes | 119 | 22186 | 157917 | 59b3 | wy656 | 2008 | 1:24000 |
Basaltlake-Cuberant-Storm families, complex, 15 to 40 percent slopes | 114 | 19260 | 157825 | 5974 | wy656 | 2008 | 1:24000 |
Needleton-Worock-Cowood families, complex, 25 to 60 percent slopes | 143 | 10561 | 157829 | 5978 | wy656 | 2008 | 1:24000 |
Needleton-Worock-Storm families, complex, 15 to 40 percent slopes | 180 | 10545 | 157845 | 597s | wy656 | 2008 | 1:24000 |
Butchlake-Storm-Cowood families, complex, 20 to 35 percent slopes | 144 | 10404 | 157830 | 5979 | wy656 | 2008 | 1:24000 |
Charpeak-Storm families, complex, 5 to 40 percent slopes | 147 | 8639 | 157832 | 597c | wy656 | 2008 | 1:24000 |
Worock-Storm families, complex, 15 to 30 percent slopes | 165 | 7698 | 157859 | 5987 | wy656 | 2008 | 1:24000 |
Storm-Cowood-Needleton families, complex, 10 to 60 percent slopes | 148 | 3682 | 157833 | 597d | wy656 | 2008 | 1:24000 |
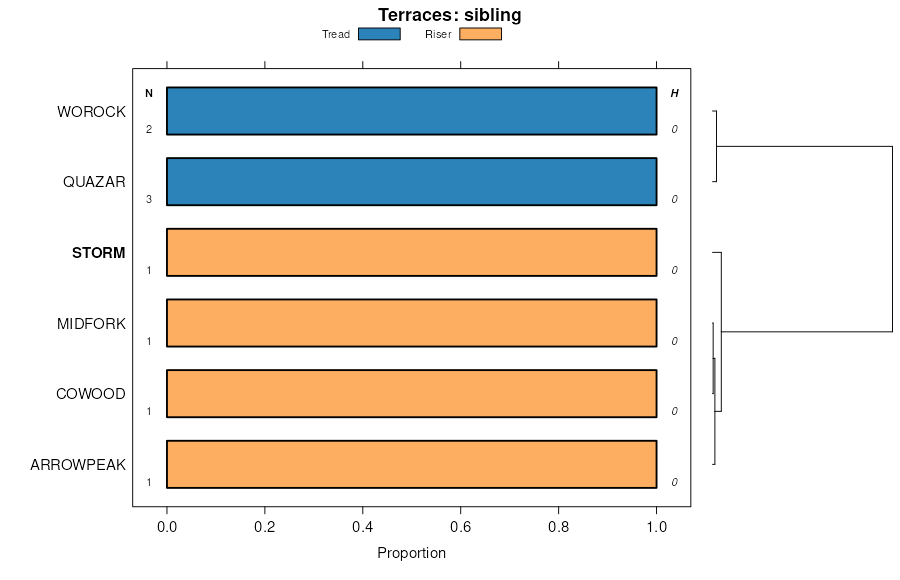
Midfork-Storm families-Rock outcrop, complex | 2159 | 1287 | 157940 | 2xts2 | wy656 | 2008 | 1:24000 |
Midfork-Storm-Quazar families, complex | 2195 | 100 | 157941 | 59bw | wy656 | 2008 | 1:24000 |
Southeast Mountains Till Plains, Subalpine Fir Complex | 7341 | 4865 | 151906 | 5326 | wy662 | 1998 | 1:24000 |
Storm family-Rubble land-Tamarron family, complex, 40 to 90 percent slopes | 316 | 21303 | 152000 | 5357 | wy663 | 2012 | 1:24000 |
Storm family-Kingmine family-Rubble land complex, 40 to 90 percent slopes | 356 | 4003 | 152018 | 535t | wy663 | 2012 | 1:24000 |
Grafen-Storm complex, 35 to 70 percent slopes | 6602 | 227 | 2633702 | 2phbs | wy663 | 2012 | 1:24000 |
Midfork-Storm families-Rock outcrop, complex | 2159 | 90621 | 3056510 | 2xts2 | wy665 | 1996 | 1:62500 |
Midfork-Storm-Quazar families, complex | 2195 | 55742 | 3056520 | 2xts4 | wy665 | 1996 | 1:62500 |