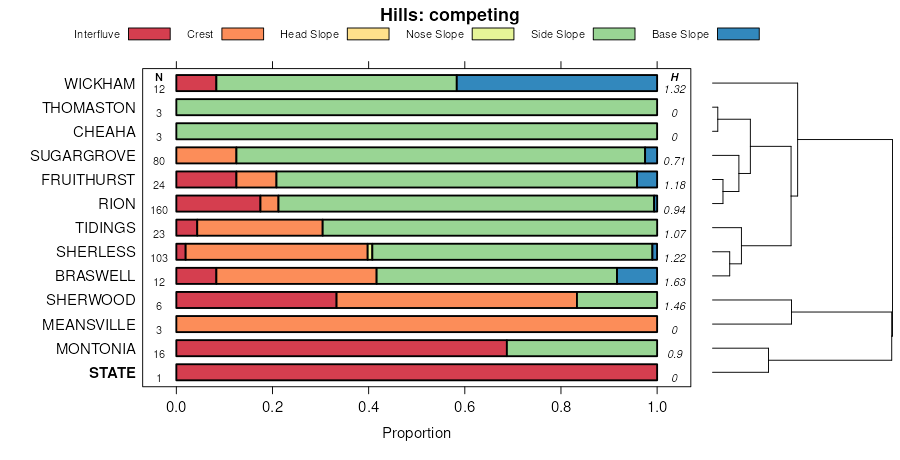
| Riverview-State-Sylacauga complex | Rs | 27631 | 122807 | 43sj | al029 | 1974 | 1:24000 |
State fine sandy loam | St | 1573 | 122808 | 43sk | al029 | 1974 | 1:24000 |
Sullivan-State complex, 0 to 2 percent slopes | 39 | 19600 | 329938 | c2b5 | al073 | 1980 | 1:24000 |
State fine sandy loam, 0 to 6 percent slopes | Sta | 260 | 126289 | 47dv | ga097 | 1960 | 1:15840 |
State loam, 2 to 6 percent slopes | StB | 186 | 3050375 | 2xn65 | nc001 | 2017 | 1:12000 |
State fine sandy loam, 0 to 2 percent slopes, rarely flooded | StA | 506 | 114559 | 3v6g | nc007 | 1999 | 1:24000 |
State sandy loam, 0 to 3 percent slopes | StA | 2705 | 111607 | 3r47 | nc013 | 1986 | 1:24000 |
State fine sandy loam, 0 to 2 percent slopes | StA | 750 | 111794 | 3rb8 | nc029 | 1988 | 1:24000 |
State fine sandy loam, 2 to 6 percent slopes | StB | 192 | 111795 | 3rb9 | nc029 | 1988 | 1:24000 |
State loamy fine sand, 0 to 2 percent slopes | StA | 1964 | 115622 | 3w9r | nc031 | 1984 | 1:24000 |
State sandy loam, 2 to 6 percent slopes | StB | 833 | 1485679 | 1lvz4 | nc037 | 2005 | 1:24000 |
State loamy fine sand, 2 to 6 percent slopes | StB | 1882 | 811403 | w7b9 | nc041 | 1982 | 1:24000 |
State loamy fine sand, 0 to 2 percent slopes | StA | 1854 | 811402 | w7b8 | nc041 | 1982 | 1:24000 |
State-Urban land complex, 0 to 2 percent slopes | SuA | 295 | 811404 | w7bb | nc041 | 1982 | 1:24000 |
State loamy sand, 0 to 2 percent slopes | StA | 3492 | 115780 | 3wgv | nc049 | 1984 | 1:24000 |
State fine sandy loam, 0 to 2 percent slopes | StA | 2815 | 112129 | 3rp2 | nc053 | 1980 | 1:20000 |
State fine sandy loam, 2 to 6 percent slopes | StB | 477 | 112130 | 3rp3 | nc053 | 1980 | 1:20000 |
State loamy sand, 0 to 4 percent slopes | StB | 6488 | 1015690 | 132x6 | nc065 | 1976 | 1:20000 |
State loam, 0 to 3 percent slopes, rarely flooded | StA | 410 | 112609 | 3s5k | nc069 | 1997 | 1:24000 |
State fine sandy loam, 2 to 6 percent slopes | StB | 658 | 115950 | 3wnb | nc073 | 1990 | 1:24000 |
State fine sandy loam, 0 to 2 percent slopes | StA | 415 | 115949 | 3wn9 | nc073 | 1990 | 1:24000 |
State fine sandy loam, 0 to 2 percent slopes | StA | 17671 | 113060 | 3sn3 | nc083 | 1995 | 1:24000 |
State fine sandy loam, 2 to 6 percent slopes | StB | 6963 | 113061 | 3sn4 | nc083 | 1995 | 1:24000 |
State fine sandy loam, 0 to 3 percent slopes, rarely flooded | StA | 2635 | 113133 | 3sqg | nc085 | 1984 | 1:24000 |
State sandy loam, 0 to 3 percent slopes, occasionally flooded | StA | 4136 | 113556 | 3t53 | nc101 | 1986 | 1:24000 |
State fine sandy loam, 0 to 3 percent slopes, rarely flooded | StA | 1024 | 2442021 | 2mz3w | nc105 | 1982 | 1:24000 |
State silt loam, 2 to 6 percent slopes, very rarely flooded | StB | 1443 | 2233607 | 2dz7v | nc123 | 2007 | 1:24000 |
State sandy loam, 0 to 3 percent slopes, rarely flooded | StA | 966 | 114063 | 3tpg | nc131 | 1988 | 1:24000 |
State loamy fine sand, 2 to 6 percent slopes | StB | 932 | 811440 | w7ch | nc143 | 1982 | 1:24000 |
State loamy fine sand, 0 to 2 percent slopes | StA | 900 | 811439 | w7cg | nc143 | 1982 | 1:24000 |
State-Urban land complex, 0 to 2 percent slopes | SuA | 214 | 811441 | w7cj | nc143 | 1982 | 1:24000 |
Masada sandy loam, 0 to 4 percent slopes (State) | MaB | 1147 | 114332 | 3tz4 | nc147 | 1969 | 1:15840 |
State silt loam, 2 to 6 percent slopes | StB | 194 | 117464 | 3y75 | nc151 | 1998 | 1:24000 |
State loamy fine sand, 0 to 4 percent slopes | StB | 651 | 115260 | 3vy2 | nc177 | 1985 | 1:24000 |
State fine sandy loam, 0 to 3 percent slopes, rarely flooded | StA | 213 | 2455025 | 2ndnc | nc185 | 2009 | 1:24000 |
State loamy sand, 0 to 3 percent slopes, rarely flooded | StA | 5955 | 116447 | 3x5c | nc195 | 1980 | 1:24000 |
State fine sandy loam | Sa | 142 | 132147 | 4fht | sc021 | 1960 | 1:20000 |
State-Eunola complex, 0 to 2 percent slopes, rarely flooded | StA | 652 | 1606654 | 1qxvk | sc061 | 2005 | 1:24000 |
State fine sandy loam | Sf | 115 | 130997 | 4d9q | sc602 | 1960 | 1:20000 |
State loam | 52 | 407 | 525302 | kmm7 | tn063 | 2007 | 1:24000 |
State fine sandy loam, 2 to 6 percent slopes, rarely flooded | 18B | 223 | 118112 | 3yx2 | va007 | 1994 | 1:24000 |
State loam, 0 to 2 percent slopes, rarely flooded | 21A | 275 | 118288 | 3z2r | va011 | 1993 | 1:15840 |
State fine sandy loam, 0 to 2 percent slopes, very rarely flooded | 23A | 2790 | 121059 | 41z4 | va033 | 1996 | 1:24000 |
State fine sandy loam, 2 to 6 percent slopes, very rarely flooded | 23B | 2150 | 121060 | 41z5 | va033 | 1996 | 1:24000 |
State fine sandy loam, 6 to 10 percent slopes, very rarely flooded | 23C | 336 | 121063 | 41z8 | va033 | 1996 | 1:24000 |
State silt loam, 2 to 6 percent slopes | StB | 283 | 118780 | 3zlm | va037 | 1970 | 1:15840 |
State fine sandy loam, 2 to 7 percent slopes, rarely flooded | 39B | 286 | 1587451 | 1q8w3 | va049 | 2005 | 1:24000 |
State fine sandy loam, 0 to 2 percent slopes | 22A | 2968 | 121492 | 42f3 | va057 | 1985 | 1:20000 |
State fine sandy loam, 2 to 6 percent slopes | 22B | 1014 | 121493 | 42f4 | va057 | 1985 | 1:20000 |
State fine sandy loam, local alluvium | Sn | 11 | 2454045 | 2ncmr | va061 | 2006 | 1:12000 |
State loamy sand, 0 to 3 percent slopes | 34A | 1576 | 695371 | rblb | va081 | 1986 | 1:15840 |
State fine sandy loam, clayey substratum, 2 to 6 percent slopes | StB | 2437 | 119283 | 403v | va087 | 1973 | 1:15840 |
State fine sandy loam, clayey substratum, 0 to 2 percent slopes | StA | 413 | 119282 | 403t | va087 | 1973 | 1:15840 |
State fine sandy loam, clayey substratum, 6 to 10 percent slopes, eroded | StC2 | 246 | 119284 | 403w | va087 | 1973 | 1:15840 |
State gravelly fine sandy loam, clayey substratum, 2 to 6 percent slopes | SvB | 149 | 119285 | 403x | va087 | 1973 | 1:15840 |
State fine sandy loam, 2 to 6 percent slopes | 16B | 3292 | 118547 | 3zc3 | va097 | 1995 | 1:24000 |
State fine sandy loam, 0 to 2 percent slopes | 16A | 2106 | 118546 | 3zc2 | va097 | 1995 | 1:24000 |
State loamy fine sand, 0 to 2 percent slopes | 27A | 4515 | 694736 | r9xv | va101 | 1995 | 1:15840 |
State loamy fine sand, 2 to 6 percent slopes | 27B | 1189 | 694737 | r9xw | va101 | 1995 | 1:15840 |
State very fine sandy loam, 0 to 2 percent slopes, rarely flooded | 35A | 903 | 119691 | 40k0 | va127 | 1985 | 1:15840 |
State fine sandy loam, local alluvium | Sn | 26 | 2453580 | 2nc4r | va153 | 1985 | 1:15840 |
State fine sandy loam, 0 to 2 percent slopes | 18A | 940 | 120363 | 417p | va159 | 1980 | 1:20000 |
State fine sandy loam, 2 to 6 percent slopes | 18B | 786 | 120364 | 417q | va159 | 1980 | 1:20000 |
State fine sandy loam, 0 to 2 percent slopes, very rarely flooded | 27A | 2815 | 705294 | rnxf | va175 | 1996 | 1:24000 |
State fine sandy loam, 2 to 6 percent slopes, very rarely flooded | 27B | 1442 | 705295 | rnxg | va175 | 1996 | 1:24000 |
State fine sandy loam, local alluvium | Sn | 1440 | 120561 | 41g2 | va179 | 1970 | 1:15840 |
State sandy loam, 0 to 2 percent slopes, rarely flooded | 26A | 1626 | 1723108 | 1vv14 | va183 | 2006 | 1:24000 |
State fine sandy loam, 0 to 2 percent slopes | 20A | 3217 | 120605 | 41hh | va193 | 1980 | 1:20000 |
State fine sandy loam, 2 to 6 percent slopes | 20B | 1486 | 120606 | 41hj | va193 | 1980 | 1:20000 |
State fine sandy loam, 0 to 2 percent slopes | StA | 495 | 120759 | 41ng | va631 | 1973 | 1:15840 |
State fine sandy loam, 2 to 6 percent slopes | StB | 209 | 120760 | 41nh | va631 | 1973 | 1:15840 |
State fine sandy loam, 0 to 2 percent slopes, occasionally flooded | 18A | 185 | 2481806 | 2p9j8 | va653 | 1991 | 1:24000 |
State fine sandy loam | 30 | 343 | 120823 | 41qj | va695 | 1981 | 1:15840 |
State-Urban land complex, 0 to 3 percent slopes | 22 | 4158 | 122434 | 43dh | va715 | 1995 | 1:12000 |
State fine sandy loam, 0 to 2 percent slopes | 21A | 830 | 120858 | 41rn | va800 | 1979 | 1:15840 |
State fine sandy loam, 2 to 6 percent slopes | 21B | 670 | 120859 | 41rp | va800 | 1979 | 1:15840 |
State loam, 0 to 2 percent slopes | 34A | 5740 | 120911 | 41tc | va810 | 1982 | 1:15840 |
State loam, 2 to 6 percent slopes | 34B | 710 | 120912 | 41td | va810 | 1982 | 1:15840 |
State-Urban land complex | 35 | 695 | 120913 | 41tf | va810 | 1982 | 1:15840 |