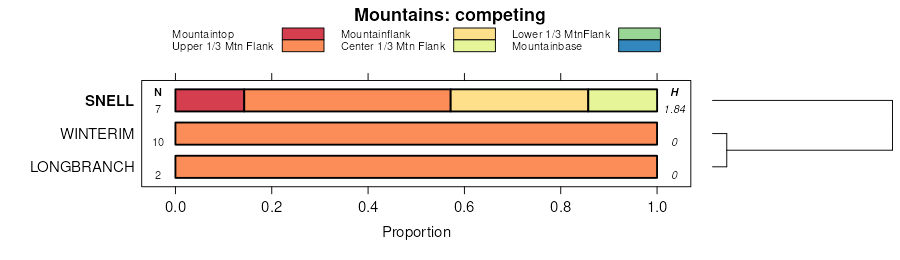
| Snell very stony loam, 5 to 30 percent slopes | 228 | 345 | 459137 | hdrw | ca602 | 1978 | 1:24000 |
Snell very stony loam, 5 to 30 percent slopes | 177 | 1100 | 486643 | jbd5 | ca684 | 1986 | 1:24000 |
Snell-Sharesnout complex, 5 to 40 percent slopes | 157 | 29204 | 486009 | j9qq | id675 | 1992 | 1:24000 |
Cleavage-Snell complex, 5 to 50 percent slopes | 42 | 20582 | 486192 | j9xm | id675 | 1992 | 1:24000 |
Doodlelink-Snell-Parkay complex, 5 to 40 percent slopes | 50 | 6147 | 486210 | j9y6 | id675 | 1992 | 1:24000 |
Snell-Kiyi association, 3 to 40 percent slopes | 156 | 5993 | 486007 | j9qn | id675 | 1992 | 1:24000 |
Snell-Ateron complex, 12 to 35 percent north slopes | 155D | 31791 | 62139 | 22nh | or604 | 1988 | 1:24000 |
Snell-Ateron complex, 35 to 60 percent north slopes | 155E | 22793 | 62140 | 22nj | or604 | 1988 | 1:24000 |
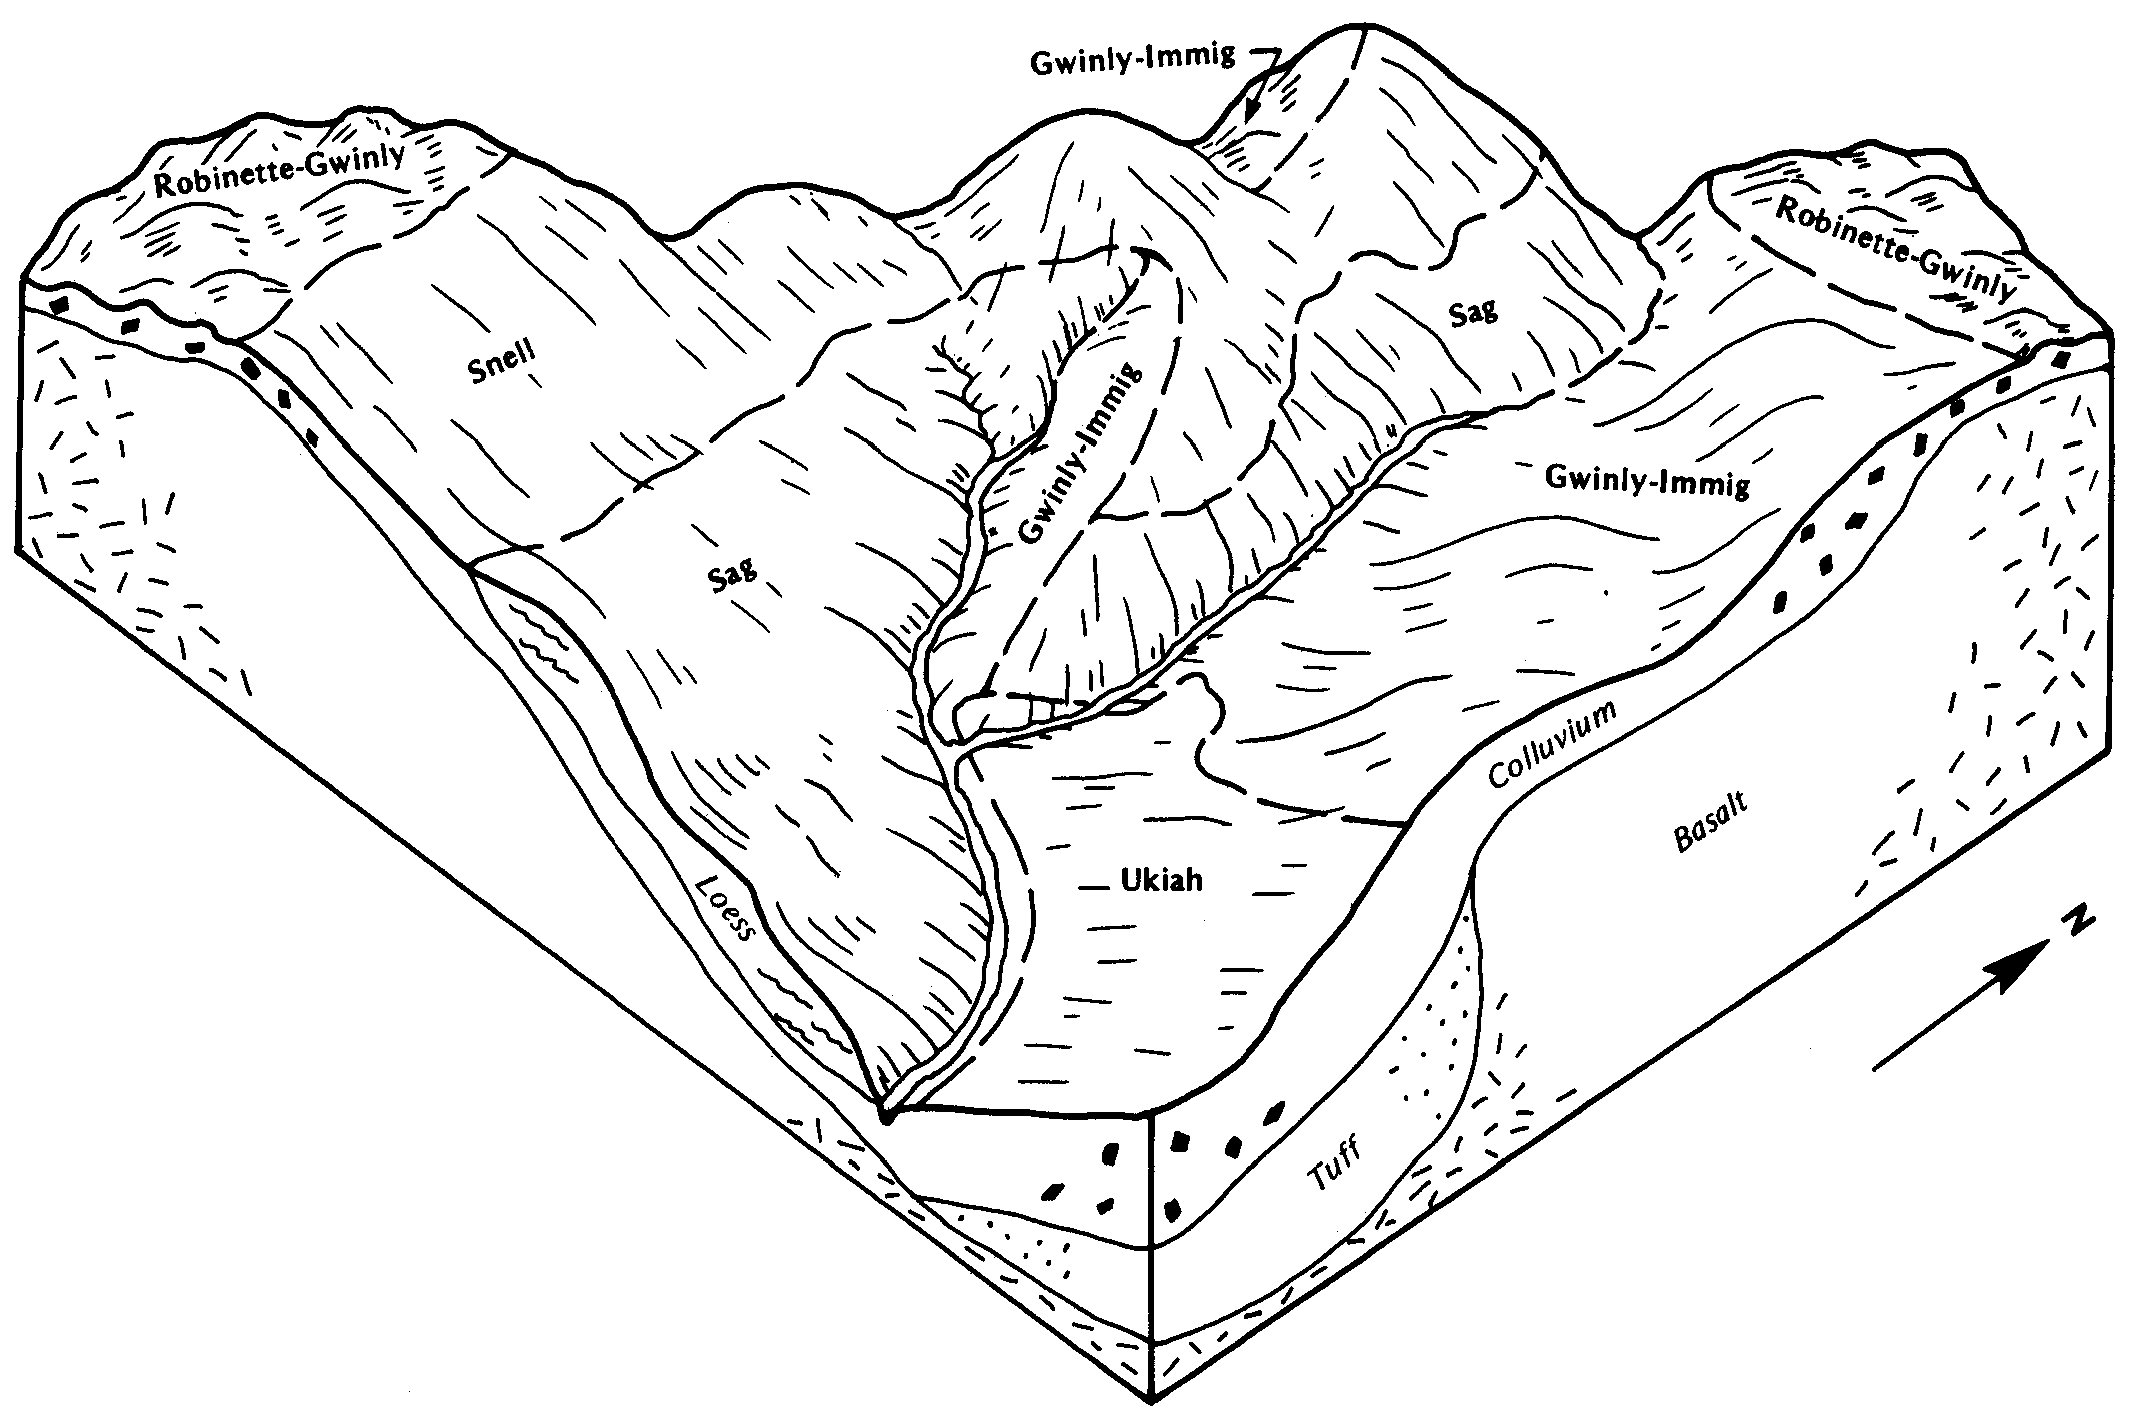
Gwinly-Immig-Snell very cobbly silt loams, 12 to 35 percent slopes | 60D | 6086 | 62239 | 22rq | or604 | 1988 | 1:24000 |
Sag-Snell complex, 12 to 35 percent north slopes | 146D | 5586 | 62121 | 22mx | or604 | 1988 | 1:24000 |
Sag-Snell complex, 35 to 50 percent north slopes | 146E | 3727 | 62122 | 22my | or604 | 1988 | 1:24000 |
Gwinly-Immig-Snell very cobbly silt loams, 35 to 50 percent slopes | 60E | 3659 | 62240 | 22rr | or604 | 1988 | 1:24000 |
Snell-Sag complex, 50 to 70 percent north slopes | 157F | 2473 | 62142 | 22nl | or604 | 1988 | 1:24000 |
Snell-Rock outcrop complex, 12 to 35 percent north slopes | 156D | 1328 | 62141 | 22nk | or604 | 1988 | 1:24000 |
Gwinly-Immig-Snell very cobbly silt loams, 50 to 70 percent slopes | 60F | 1216 | 62241 | 22rs | or604 | 1988 | 1:24000 |
Rock outcrop-Snell complex, 50 to 80 percent north slopes | 137F | 1033 | 62106 | 22mf | or604 | 1988 | 1:24000 |
Snell-Harlow complex, moist, 2 to 15 percent slopes | 3331AO | 73 | 3120215 | njh9 | or607 | 2018 | 1:24000 |
Snell-Bocker-Anatone complex, 15 to 30 percent slopes | 3323BO | 58 | 3120429 | 1r021 | or607 | 2018 | 1:24000 |
Harlow-Snell-Imnaha complex, moist, 30 to 60 percent south slopes | 73E | 144 | 64030 | 24mh | or625 | 1979 | 1:20000 |
Ateron-Snell complex, 20 to 50 percent south slopes | 4316NO | 30 | 3385478 | rcr2 | or626 | 2018 | 1:24000 |
Snell-Imnaha-Rock outcrop complex, moist, 60 to 90 percent north slopes | 6017DN | 23 | 3122084 | njht | or626 | 2018 | 1:24000 |
Skullgulch-Snell complex, 2 to 10 percent slopes | 260C | 2417 | 3426360 | nk48 | or627 | | 1:24000 |
Ateron-Snell complex, 20 to 50 percent south slopes | 207E | 1131 | 3425173 | rcr2 | or627 | | 1:24000 |
Ateron-Snell-Rock outcrop complex, 50 to 90 percent south slopes | 207F | 357 | 3425062 | 25xtp | or627 | | 1:24000 |
Snell-Bocker-Anatone complex, 30 to 60 percent slopes | 3323CO | 1965 | 2437089 | 1r022 | or631 | 2018 | 1:24000 |
Snell-Bocker-Anatone complex, 0 to 15 percent slopes | 3323AO | 644 | 2437088 | 1qqjl | or631 | 2018 | 1:24000 |
Gwinly-Immig-Snell very cobbly silt loams, 35 to 50 percent slopes | 4030CO | 324 | 2437149 | 22rr | or631 | 2018 | 1:24000 |
Snell-Bocker-Anatone complex, 15 to 30 percent slopes | 3323BO | 169 | 2486713 | 1r021 | or631 | 2018 | 1:24000 |
Snell-Imnaha-Rock outcrop complex, moist, 60 to 90 percent north slopes | 6017DN | 110 | 2437438 | njht | or631 | 2018 | 1:24000 |
Gwinly-Immig-Snell very cobbly silt loams, 12 to 35 percent slopes | 4030BO | 99 | 2437148 | 22rq | or631 | 2018 | 1:24000 |
Harlow-Imnaha-Snell complex, moist, 30 to 60 percent south slopes | 3328CO | 99 | 2437096 | nj5g | or631 | 2018 | 1:24000 |
Harlow-Imnaha-Snell complex, moist, 15 to 30 percent south slopes | 3328BO | 70 | 2437095 | nj57 | or631 | 2018 | 1:24000 |
Gwinly-Immig-Snell very cobbly silt loams, 50 to 70 percent slopes | 4030DO | 40 | 2437150 | 22rs | or631 | 2018 | 1:24000 |
Snell-Harlow complex, moist, 2 to 15 percent slopes | 3331AO | 17 | 2437099 | njh9 | or631 | 2018 | 1:24000 |
Sag-Snell complex, 35 to 50 percent north slopes | 4035CN | 16 | 2437155 | 22my | or631 | 2018 | 1:24000 |
Snell-Ateron complex, 12 to 35 percent north slopes | 4040BN | 5 | 2486804 | 22nh | or631 | 2018 | 1:24000 |
Snell very stony loam, 35 to 70 percent north slopes | 56F | 8824 | 61358 | 21v9 | or648 | 1977 | 1:24000 |
Snell-Bocker-Anatone complex, 15 to 30 percent slopes | 3323BO | 57 | 3121458 | 1r021 | or667 | 1984 | 1:20000 |
Snell-Harlow complex, 15 to 30 percent north slopes | 281 | 21142 | 84671 | 2v3b | or670 | 1999 | 1:24000 |
Snell-Harlow complex, 2 to 15 percent slopes | 280 | 12452 | 84670 | 2v39 | or670 | 1999 | 1:24000 |
Snell-Harlow complex, 30 to 60 percent north slopes | 282 | 6745 | 84672 | 2v3c | or670 | 1999 | 1:24000 |
Harlow-Snell-Imnaha complex, moist, 2 to 15 percent slopes | 123 | 5316 | 84495 | 2txn | or670 | 1999 | 1:24000 |
Snell-Harlow complex, 15 to 30 percent south slopes | 283 | 4763 | 84673 | 2v3d | or670 | 1999 | 1:24000 |
Harlow-Snell-Imnaha complex, moist, 30 to 60 percent south slopes | 125 | 4585 | 84497 | 2txq | or670 | 1999 | 1:24000 |
Snell-Harlow silt loams, 0 to 15 percent slopes | 284 | 4339 | 84674 | 2v3f | or670 | 1999 | 1:24000 |
Snell-Harlow-Imnaha complex, moist, 30 to 60 percent north slopes | 286 | 3104 | 84676 | 2v3h | or670 | 1999 | 1:24000 |
Harlow-Snell-Imnaha complex, moist, 15 to 30 percent south slopes | 124 | 3011 | 84496 | 2txp | or670 | 1999 | 1:24000 |
Snell-Imnaha-Rock outcrop complex, moist, 60 to 90 percent north slopes | 288 | 1850 | 84679 | 2v3l | or670 | 1999 | 1:24000 |
Snell-Harlow-Imnaha complex, moist, 15 to 30 percent north slopes | 285 | 1351 | 84675 | 2v3g | or670 | 1999 | 1:24000 |
Snell-Harlow-Rock outcrop complex, 60 to 90 percent north slopes | 287 | 122 | 84678 | 2v3k | or670 | 1999 | 1:24000 |
Demasters-Snell complex, 30 to 70 percent north slopes | 60 | 23 | 84785 | 2v70 | or670 | 1999 | 1:24000 |
Harlow-Snell-Rock outcrop complex, 40 to 90 percent south slopes | 126 | 17 | 84462 | 2twl | or670 | 1999 | 1:24000 |
Snell silty clay loam, 3 to 8 percent slopes | 279 | 16 | 84466 | 2twq | or670 | 1999 | 1:24000 |
Ateron-Snell-Rock outcrop complex, 50 to 90 percent south slopes | 207F | 924 | 3421992 | 25xtp | or677 | | 1:24000 |
Anatone-Snell complex, 15 to 40 percent north slopes | 144E | 831 | 3422010 | 26bw | or677 | | 1:24000 |
Snell very stony ashy loam, 40 to 70 percent south slopes | 143F | 512 | 3424520 | 26bv | or677 | | 1:24000 |
Ateron-Snell complex, 20 to 50 percent south slopes | 207E | 71 | 3424812 | rcr2 | or677 | | 1:24000 |
Snell-Harlow complex, moist, 2 to 15 percent slopes | 3331AO | 3 | 3424936 | njh9 | or677 | | 1:24000 |
Harlow-Snell-Harlow variant complex, 3 to 30 percent slopes | 45 | 5271 | 69446 | 2b86 | wa603 | 1984 | 1:24000 |
Snell silty clay loam, 3 to 8 percent slopes | 94 | 4064 | 69500 | 2b9y | wa603 | 1984 | 1:24000 |
Getaway-Snell complex, 30 to 70 percent slopes | 35 | 2971 | 69435 | 2b7v | wa603 | 1984 | 1:24000 |
Snell-Harlow-Demasters complex, 60 to 90 percent slopes | 96 | 1714 | 69502 | 2bb0 | wa603 | 1984 | 1:24000 |
Harlow-Snell very stony clay loams, 30 to 70 percent slopes | 44 | 1675 | 69445 | 2b85 | wa603 | 1984 | 1:24000 |
Snell-Harlow-Rock outcrop complex, 40 to 90 percent slopes | 97 | 1301 | 69503 | 2bb1 | wa603 | 1984 | 1:24000 |
Demasters-Snell complex, 30 to 70 percent slopes | 26 | 988 | 69425 | 2b7j | wa603 | 1984 | 1:24000 |
Harlow-Snell-Rock outcrop complex, 40 to 90 percent slopes | 46 | 835 | 69447 | 2b87 | wa603 | 1984 | 1:24000 |
Harlow-Snell-Imnaha complex, moist, 2 to 15 percent slopes | 118 | 529 | 817782 | wfz2 | wa603 | 1984 | 1:24000 |
Snell silty clay loam, 8 to 15 percent slopes | 95 | 309 | 69501 | 2b9z | wa603 | 1984 | 1:24000 |
Harlow-Snell-Imnaha complex, moist, 30 to 60 percent south slopes | 120 | 235 | 817783 | wfz3 | wa603 | 1984 | 1:24000 |
Getaway-Snell complex, 30 to 70 percent slopes | 35 | 105 | 69745 | 2bkv | wa623 | 1970 | 1:20000 |
Snell-Harlow-Demasters complex, 60 to 90 percent slopes | 96 | 23 | 69765 | 2blh | wa623 | 1970 | 1:20000 |
