| Sharrott-Rubble land-Rock outcrop complex, 15 to 60 percent slopes | 80F | 3391 | 3005045 | 57nw | mt603 | 1989 | 1:24000 |
Nemote-Sharrott association | NeS | 1736 | 144757 | 4vml | mt603 | 1989 | 1:24000 |
Sharrott soils, 35 to 90 percent slopes | Sh | 1391 | 144767 | 4vmx | mt603 | 1989 | 1:24000 |
Winkler, cool-Sharrott, cool-Rubble land complex, 40 to 85 percent slopes | 122G | 550 | 2995552 | 5742 | mt603 | 1989 | 1:24000 |
Sharrott, cool-Rock outcrop-Rubble land complex, 15 to 60 percent slopes | 82F | 415 | 3005047 | 57p9 | mt603 | 1989 | 1:24000 |
Winkler, cool-Rock outcrop-Sharrott, cool complex, 8 to 40 percent slopes | 122E | 73 | 2995551 | 5741 | mt603 | 1989 | 1:24000 |
Winkler-Sharrott-Rubble land complex, 40 to 85 percent slopes | 120G | 67 | 2995550 | 5740 | mt603 | 1989 | 1:24000 |
Coldcreek-Sharrott association | CoS | 62 | 144724 | 4vlj | mt603 | 1989 | 1:24000 |
Winkler-Sharrott-Rock outcrop complex, 8 to 40 percent slopes | 532E | 30 | 2995628 | 57gx | mt603 | 1989 | 1:24000 |
Kingspoint-Rock outcrop-Sharrott complex, 15 to 50 percent slopes | 711F | 1561 | 2409887 | 2lwp9 | mt617 | 1958 | 1:20000 |
Kingspoint-Rock outcrop-Sharrott complex, 15 to 50 percent slopes | 711F | 13073 | 1604056 | 1qv4r | mt618 | 2008 | 1:24000 |
Sharrott-Rock outcrop-Winkler complex, 15 to 60 percent slopes | 80F | 7582 | 784707 | vbk4 | mt618 | 2008 | 1:24000 |
Combest-Sharrott-Rock outcrop complex, 40 to 85 percent slopes | 211G | 951 | 796038 | vqbn | mt618 | 2008 | 1:24000 |
Winkler, cool-Rock outcrop-Sharrott, cool complex, 8 to 40 percent slopes | 122E | 122 | 157069 | 58fr | mt618 | 2008 | 1:24000 |
Kingspoint-Rock outcrop-Sharrott complex, 15 to 50 percent slopes | 711F | 1756 | 2409952 | 2lwrd | mt619 | 1988 | 1:24000 |
Sharrott-Rock outcrop-Winkler complex, 15 to 60 percent slopes | 80F | 228 | 2409938 | 2lwqy | mt619 | 1988 | 1:24000 |
Winkler-Sharrott-Rock outcrop complex, 30 to 60 percent slopes | 187 | 2645 | 145101 | 4vzp | mt629 | 1991 | 1:20000 |
Sharrott-Rock outcrop-Winkler complex, 15 to 60 percent slopes | 80F | 1106 | 2409864 | 2lwnk | mt634 | 1988 | 1:24000 |
Sharrott-Rock outcrop complex, 4 to 30 percent slopes | 99 | 2119 | 145522 | 4wf8 | mt638 | 1985 | 1:24000 |
Mitten-Sharrott, cool, complex, 15 to 40 percent slopes | 70 | 2033 | 145491 | 4wd8 | mt638 | 1985 | 1:24000 |
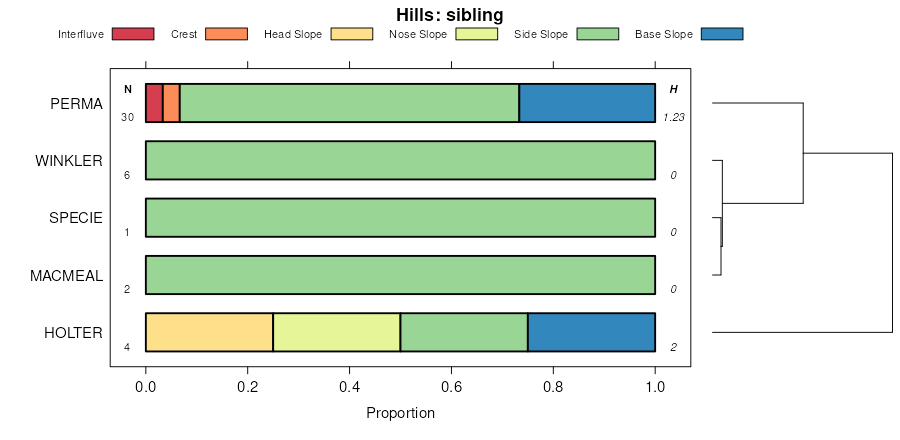
Perma-Holter-Sharrott families complex, steep mountain slopes | 30K31 | 422 | 2422667 | 2m9zk | mt638 | 1985 | 1:24000 |
Nemote-Sharrott association | NeS | 239 | 3044974 | 4vml | mt638 | 1985 | 1:24000 |
Kadygulch-Totelake-Sharrott families complex, breaklands | 61B15 | 97 | 2422741 | 2mb1y | mt638 | 1985 | 1:24000 |
Repp-Sharrott families-Rubble land complex, breaklands | 61K53 | 60 | 2422743 | 2mb20 | mt638 | 1985 | 1:24000 |
Holter-Repp-Sharrott families complex, breaklands | 61K54 | 58 | 2422666 | 2m9zj | mt638 | 1985 | 1:24000 |
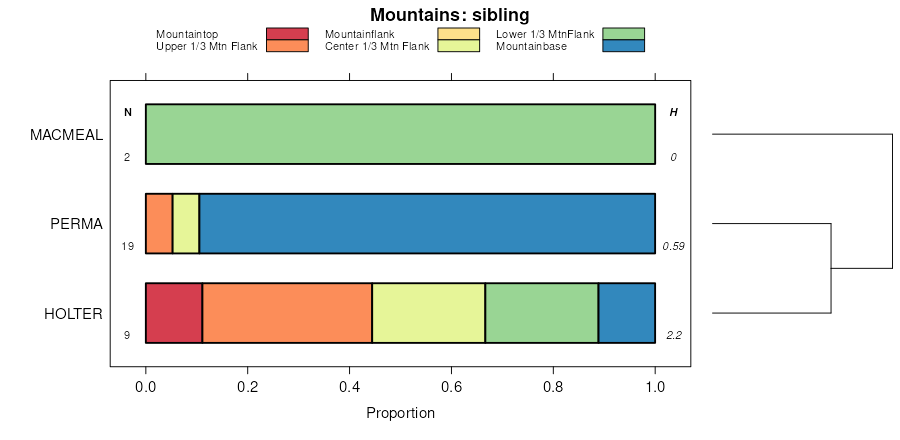
Totelake-Macmeal-Sharrott families, complex, dissected mountain slopes | 31B15 | 2906 | 2423804 | 51by | mt645 | 2013 | 1:12000 |
Kadygulch-Totelake-Sharrott families, complex, breaklands | 61B15 | 2581 | 754431 | tb1h | mt645 | 2013 | 1:12000 |
Macmeal-Totelake-Sharrott families, complex, moderately steep mountain slopes | 32B30 | 2371 | 1389554 | 1hmyb | mt645 | 2013 | 1:12000 |
Perma-Holter-Sharrott families, complex, steep mountain slopes | 30K31 | 2318 | 633763 | p8gz | mt645 | 2013 | 1:12000 |
Kadygulch-Sharrott families, complex, dissected mountain slopes | 31B19 | 1921 | 633768 | p8h4 | mt645 | 2013 | 1:12000 |
Kellygulch-Haugan-Sharrott families, complex, dissected mountain slopes | 31B71 | 1383 | 2437593 | 2mtj1 | mt645 | 2013 | 1:12000 |
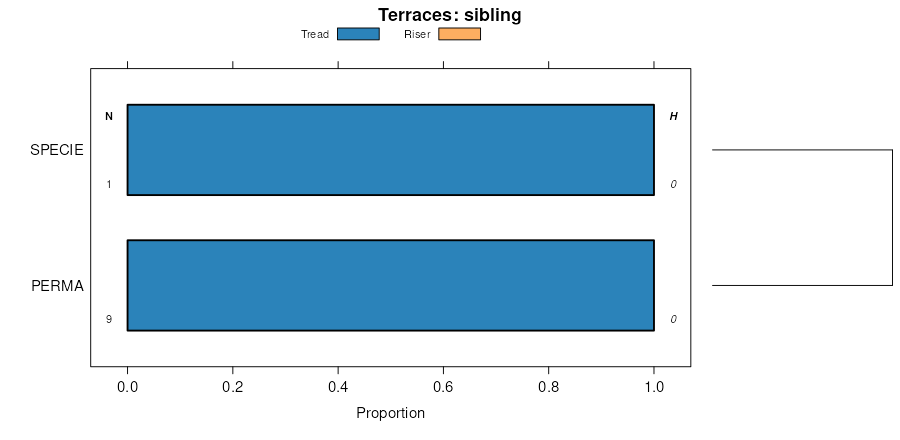
Holter-Specie-Sharrott families, complex, breaklands | 61K54 | 984 | 1389559 | 1hmyh | mt645 | 2013 | 1:12000 |
Totelake-Sharrott-Macmeal families, complex, steep mountain slopes | 30B33 | 759 | 757659 | tfdm | mt645 | 2013 | 1:12000 |
Haugan-Kadygulch-Sharrott families, complex, mountain uplands and ridges | 33B30 | 473 | 633781 | p8hk | mt645 | 2013 | 1:12000 |
Kadygulch-Kellygulch-Sharrott families, complex, dissected mountain slopes | 31B72 | 139 | 2437594 | 2mtj2 | mt645 | 2013 | 1:12000 |
Totelake-Macmeal-Sharrott families, complex, dissected mountain slopes | 31B15 | 28376 | 150255 | 51by | mt647 | 2007 | 1:24000 |
Kadygulch-Totelake-Sharrott families, complex, breaklands | 61B15 | 21281 | 150348 | 51fy | mt647 | 2007 | 1:24000 |
Macmeal-Totelake-Sharrott families, complex, moderately steep mountain slopes | 32B30 | 10331 | 150279 | 51cq | mt647 | 2007 | 1:24000 |
Haugan-Kadygulch-Sharrott families, complex, mountain ridges | 33B30 | 9330 | 150299 | 51dc | mt647 | 2007 | 1:24000 |
Kadygulch-Sharrott families, complex, dissected mountain slopes | 31B19 | 7727 | 150256 | 51bz | mt647 | 2007 | 1:24000 |
Holter-Specie-Sharrott families, complex, breaklands | 61K54 | 6307 | 150363 | 51gf | mt647 | 2007 | 1:24000 |
Perma-Holter-Sharrott families, complex, steep mountain slopes | 30K31 | 5005 | 150250 | 51bs | mt647 | 2007 | 1:24000 |
Totelake-Sharrott-Macmeal families, complex, steep mountain slopes | 30B33 | 4976 | 150229 | 51b3 | mt647 | 2007 | 1:24000 |
Specie-Sharrott families-Rubble land complex, breaklands | 61K53 | 3036 | 150362 | 51gd | mt647 | 2007 | 1:24000 |
Kellygulch-Haugan-Sharrott families, complex, dissected mountain slopes | 31B71 | 1839 | 150261 | 51c4 | mt647 | 2007 | 1:24000 |
Kadygulch-Kellygulch-Sharrott families, complex, dissected mountain slopes | 31B72 | 1223 | 150262 | 51c5 | mt647 | 2007 | 1:24000 |
Totelake-Sharrott families-Rubble land association, breaklands | 61W15 | 307 | 150366 | 51gj | mt647 | 2007 | 1:24000 |
Totelake-Holter-Sharrott families, association, dissected mountain slopes | 31W15 | 69 | 150273 | 51cj | mt647 | 2007 | 1:24000 |
Winkler, cool-Sharrott, cool-Rubble land complex, 40 to 85 percent slopes | 122G | 10535 | 155808 | 5742 | mt651 | 1997 | 1:24000 |
Sharrott-Rubble land-Rock outcrop complex, 15 to 60 percent slopes | 80F | 6949 | 156329 | 57nw | mt651 | 1997 | 1:24000 |
Sharrott, cool-Rock outcrop-Rubble land complex, 15 to 60 percent slopes | 82F | 5710 | 156342 | 57p9 | mt651 | 1997 | 1:24000 |
Winkler-Sharrott-Rubble land complex, 40 to 85 percent slopes | 120G | 5670 | 155806 | 5740 | mt651 | 1997 | 1:24000 |
Winkler, cool-Rock outcrop-Sharrott, cool complex, 8 to 40 percent slopes | 122E | 4094 | 155807 | 5741 | mt651 | 1997 | 1:24000 |
Winkler-Sharrott-Rock outcrop complex, 8 to 40 percent slopes | 532E | 1909 | 156144 | 57gx | mt651 | 1997 | 1:24000 |


