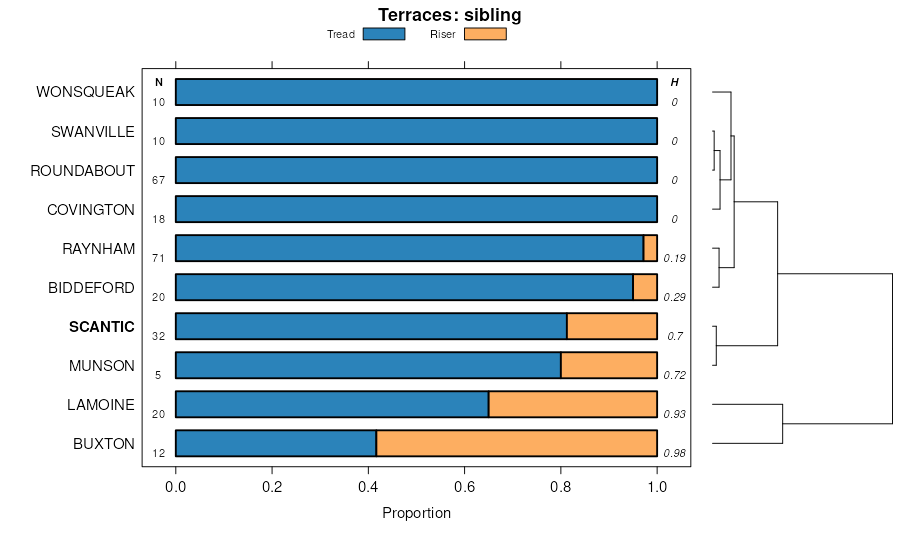
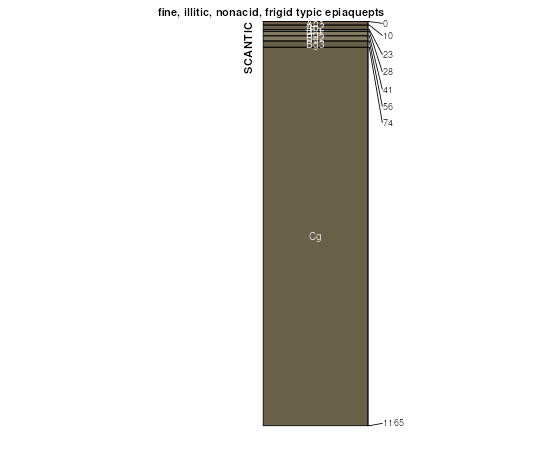
| Scantic silt loam, 0 to 3 percent slopes | 16A | 2986 | 790673 | vjrl | ma605 | 1977 | 1:15840 |
Scantic silt loam, 3 to 8 percent slopes | 16B | 301 | 790676 | vjrp | ma605 | 1977 | 1:15840 |
Scantic silt loam, 0 to 3 percent slopes | Sn | 33454 | 315733 | 2slv3 | me005 | 1969 | 1:24000 |
Scantic silt loam, 0 to 3 percent slopes | ScA | 40697 | 284497 | 2slv3 | me011 | 1974 | 1:20000 |
Scantic silt loam, 0 to 3 percent slopes | Sc | 32437 | 284659 | 2slv3 | me031 | 1978 | 1:20000 |
Urban land-Scantic complex, 0 to 3 percent slopes | UsA | 455 | 284671 | 9k6y | me031 | 1978 | 1:20000 |
Scantic silt loam, 0 to 3 percent slopes | Sc | 22947 | 284734 | 2slv3 | me601 | 1983 | 1:20000 |
Scantic silt loam, 0 to 3 percent slopes | Sc | 30245 | 284792 | 2slv3 | me602 | 1967 | 1:20000 |
Scantic silt loam, 0 to 3 percent slopes | ScA | 26473 | 284871 | 2slv3 | me606 | 1966 | 1:15840 |
Lamoine-Scantic-Buxton complex, 0 to 15 percent slopes | LCB | 24172 | 285109 | 2x1bq | me611 | 1988 | 1:20000 |
Scantic-Lamoine-Peru complex, 0 to 8 percent slopes, very stony | SEB | 20456 | 285138 | 2x1bx | me611 | 1988 | 1:20000 |
Scantic silt loam, 0 to 3 percent slopes | Sa | 19116 | 285141 | 2slv3 | me611 | 1988 | 1:20000 |
Scantic-Biddeford complex, 0 to 3 percent slopes | SB | 13663 | 285137 | 2t0jm | me611 | 1988 | 1:20000 |
Scantic-Lamoine complex, 0 to 8 percent slopes, very stony | SdB | 9244 | 285142 | 2x1bp | me611 | 1988 | 1:20000 |
Lamoine-Scantic complex, 0 to 8 percent slopes | LbB | 5232 | 285114 | 2x1bn | me611 | 1988 | 1:20000 |
Scantic-Biddeford complex, 0 to 3 percent slopes | SBA | 51136 | 742169 | sx8y | me612 | 2016 | 1:24000 |
Scantic-Lamoine-Colonel association, 0 to 8 percent slopes, very stony | SLB | 15936 | 742170 | sx8z | me612 | 2016 | 1:24000 |
Lamoine-Scantic complex, 0 to 8 percent slopes | LAB | 7390 | 742159 | sx8m | me612 | 2016 | 1:24000 |
Lamoine-Scantic complex, 0 to 8 percent slopes | LsB | 6199 | 741610 | swpx | me612 | 2016 | 1:24000 |
Scantic silt loam, 0 to 3 percent slopes | ScA | 2841 | 741913 | sx0p | me612 | 2016 | 1:24000 |
Biddeford-Scantic-Lamoine complex, 0 to 8 percent slopes, very stony | BxB | 24442 | 285183 | 2x1c5 | me614 | 1960 | 1:20000 |
Scantic silt loam, 0 to 8 percent slopes | ScB | 8202 | 285264 | 2x1c0 | me614 | 1960 | 1:20000 |
Lamoine-Buxton-Scantic complex, 0 to 15 percent slopes | LCB | 98832 | 285582 | 2t0kb | me617 | 2004 | 1:24000 |
Scantic-Biddeford complex, 0 to 3 percent slopes | SF | 57068 | 285614 | 2t0jm | me617 | 2004 | 1:24000 |
Lamoine-Scantic-Colonel complex, 0 to 8 percent slopes, very stony | LSB | 24016 | 285585 | 2x1br | me617 | 2004 | 1:24000 |
Lamoine-Tunbridge-Scantic complex, 0 to 8 percent slopes, very stony | LTB | 22645 | 285586 | 2x1bt | me617 | 2004 | 1:24000 |
Lamoine-Rawsonville-Scantic complex, 0 to 8 percent slopes, very stony | LKB | 20044 | 1401267 | 1j145 | me617 | 2004 | 1:24000 |
Lamoine-Scantic complex, 0 to 8 percent slopes | LmB | 6580 | 285591 | 2x1bn | me617 | 2004 | 1:24000 |
Scantic silt loam, 0 to 3 percent slopes | Sa | 2779 | 285620 | 2slv3 | me617 | 2004 | 1:24000 |
Lamoine-Creasey-Scantic complex, 0 to 8 percent slopes | LEB | 2702 | 285583 | 9l5c | me617 | 2004 | 1:24000 |
Scantic-Lamoine complex, 0 to 8 percent slopes, very stony | LnB | 778 | 285592 | 2x1bp | me617 | 2004 | 1:24000 |
Scantic-Biddeford complex, 0 to 3 percent slopes | SBA | 4522 | 1909085 | 2t0jm | me622 | 2007 | 1:24000 |
Lamoine-Buxton-Scantic complex, 0 to 15 percent slopes | LBC | 3161 | 1909084 | 2t0kb | me622 | 2007 | 1:24000 |
Lamoine-Scantic-Colonel complex, 0 to 8 percent slopes, very stony | LLB | 1944 | 1909083 | 2x1br | me622 | 2007 | 1:24000 |
Lamoine-Tunbridge-Scantic complex, 0 to 8 percent slopes, very stony | LNB | 1047 | 1909082 | 2x1bt | me622 | 2007 | 1:24000 |
Scantic-Lamoine-Peru complex, 0 to 8 percent slopes, very stony | SLB | 1034 | 1909280 | 2x1bx | me622 | 2007 | 1:24000 |
Lamoine-Scantic-Buxton complex, 0 to 15 percent slopes | LEB | 380 | 1909224 | 2x1bq | me622 | 2007 | 1:24000 |
Scantic silt loam, 0 to 3 percent slopes | ScA | 6905 | 279923 | 9d8s | nh017 | 1968 | 1:20000 |
Scantic silt loam, 3 to 8 percent slopes | ScB | 952 | 279924 | 9d8t | nh017 | 1968 | 1:20000 |
Scantic silty clay loam, 0 to 3 percent slopes | SdA | 7037 | 2677791 | bmnt | ny049 | 2018 | 1:24000 |
Scantic silt loam, 0 to 3 percent slopes | 47A | 210 | 282921 | 2slv3 | vt005 | 2006 | 1:20000 |
Scantic silt loam, 0 to 2 percent slopes | ScA | 3496 | 281749 | 9g5p | vt007 | 1969 | 1:15840 |
Scantic silt loam, 2 to 6 percent slopes | ScB | 2140 | 281750 | 9g5q | vt007 | 1969 | 1:15840 |
Scantic silt loam, 0 to 3 percent slopes | ScA | 7583 | 281848 | 9g8w | vt011 | 1976 | 1:20000 |
Scantic silt loam, 3 to 8 percent slopes | ScB | 806 | 281849 | 9g8x | vt011 | 1976 | 1:20000 |
Scantic variant bouldery silt loam, 8 to 25 percent slopes | SeD | 316 | 281943 | 9gcy | vt015 | 1979 | 1:20000 |
Scantic variant bouldery silt loam, 25 to 50 percent slopes | SeE | 209 | 281944 | 9gcz | vt015 | 1979 | 1:20000 |
Scantic silt loam, 0 to 3 percent slopes | 50A | 1537 | 283485 | 2slv3 | vt019 | 2005 | 1:20000 |
Scantic silt loam, 0 to 3 percent slopes | 45A | 756 | 282672 | 2slv3 | vt023 | 1996 | 1:20000 |