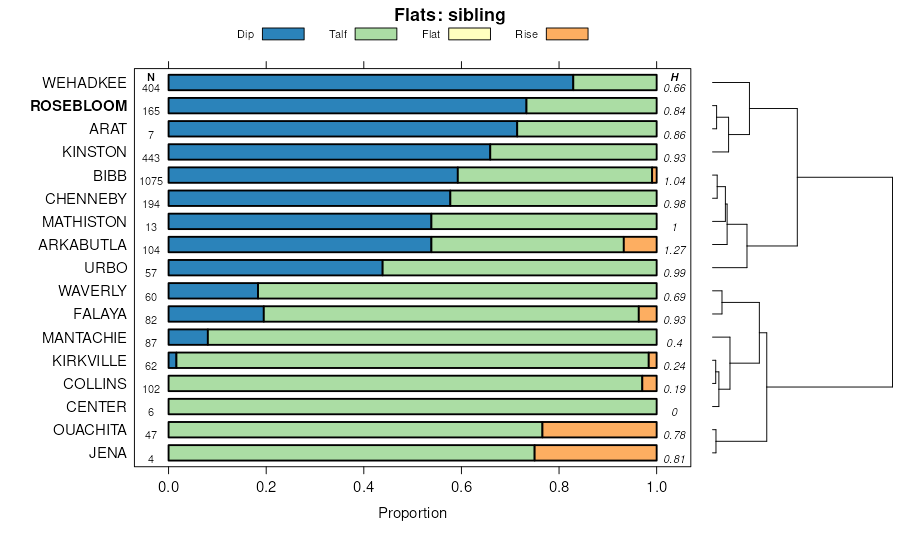
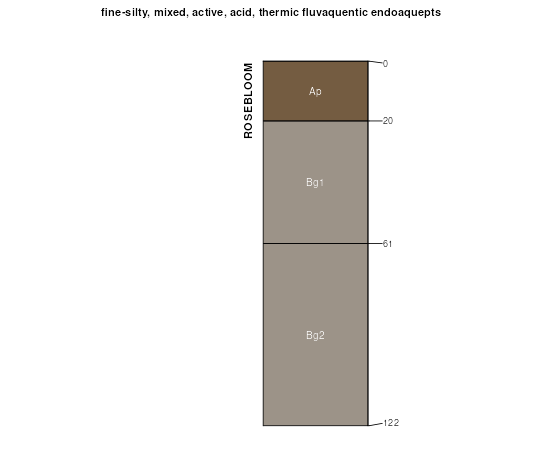
| Rosebloom silt loam, frequently flooded | Ro | 2999 | 570646 | m4sy | ky083 | 1995 | 1:12000 |
Rosebloom silt loam, ponded | Rp | 1410 | 570647 | m4sz | ky083 | 1995 | 1:12000 |
Rosebloom silt loam, 0 to 2 percent slopes, frequently flooded | Ro | 3613 | 1598989 | 1qnw9 | ky602 | 1972 | 1:12000 |
Rosebloom silt loam, 0 to 2 percent slopes, occasionally flooded | Rm | 2501 | 1592692 | 1qgb5 | ky602 | 1972 | 1:12000 |
Rosebloom silt loam, ponded | Rs | 1874 | 1592701 | 1qgbg | ky602 | 1972 | 1:12000 |
Rosebloom and Bibb soils, 0 to 2 percent slopes, frequently flooded | RB | 8750 | 2232330 | 2dxxn | ky610 | 1968 | 1:12000 |
Rosebloom silt loam, ponded | Rp | 248 | 2232331 | 2dxxp | ky610 | 1968 | 1:12000 |
Arkabutla-Rosebloom complex, 0 to 2 percent slopes, frequently flooded | Ao | 56 | 2232319 | 2dxx9 | ky610 | 1968 | 1:12000 |
Rosebloom silt loam, 0 to 2 percent slopes, occasionally flooded | Rm | 16 | 2623446 | 2qykm | ky610 | 1968 | 1:12000 |
Arkabutla and Rosebloom soils, frequently flooded | AT | 53222 | 326990 | bz82 | la103 | 1985 | 1:24000 |
Arkabutla, Rosebloom, and Jena soils, frequently flooded | AT | 15972 | 1724134 | 1vw37 | la117 | 1989 | 1:24000 |
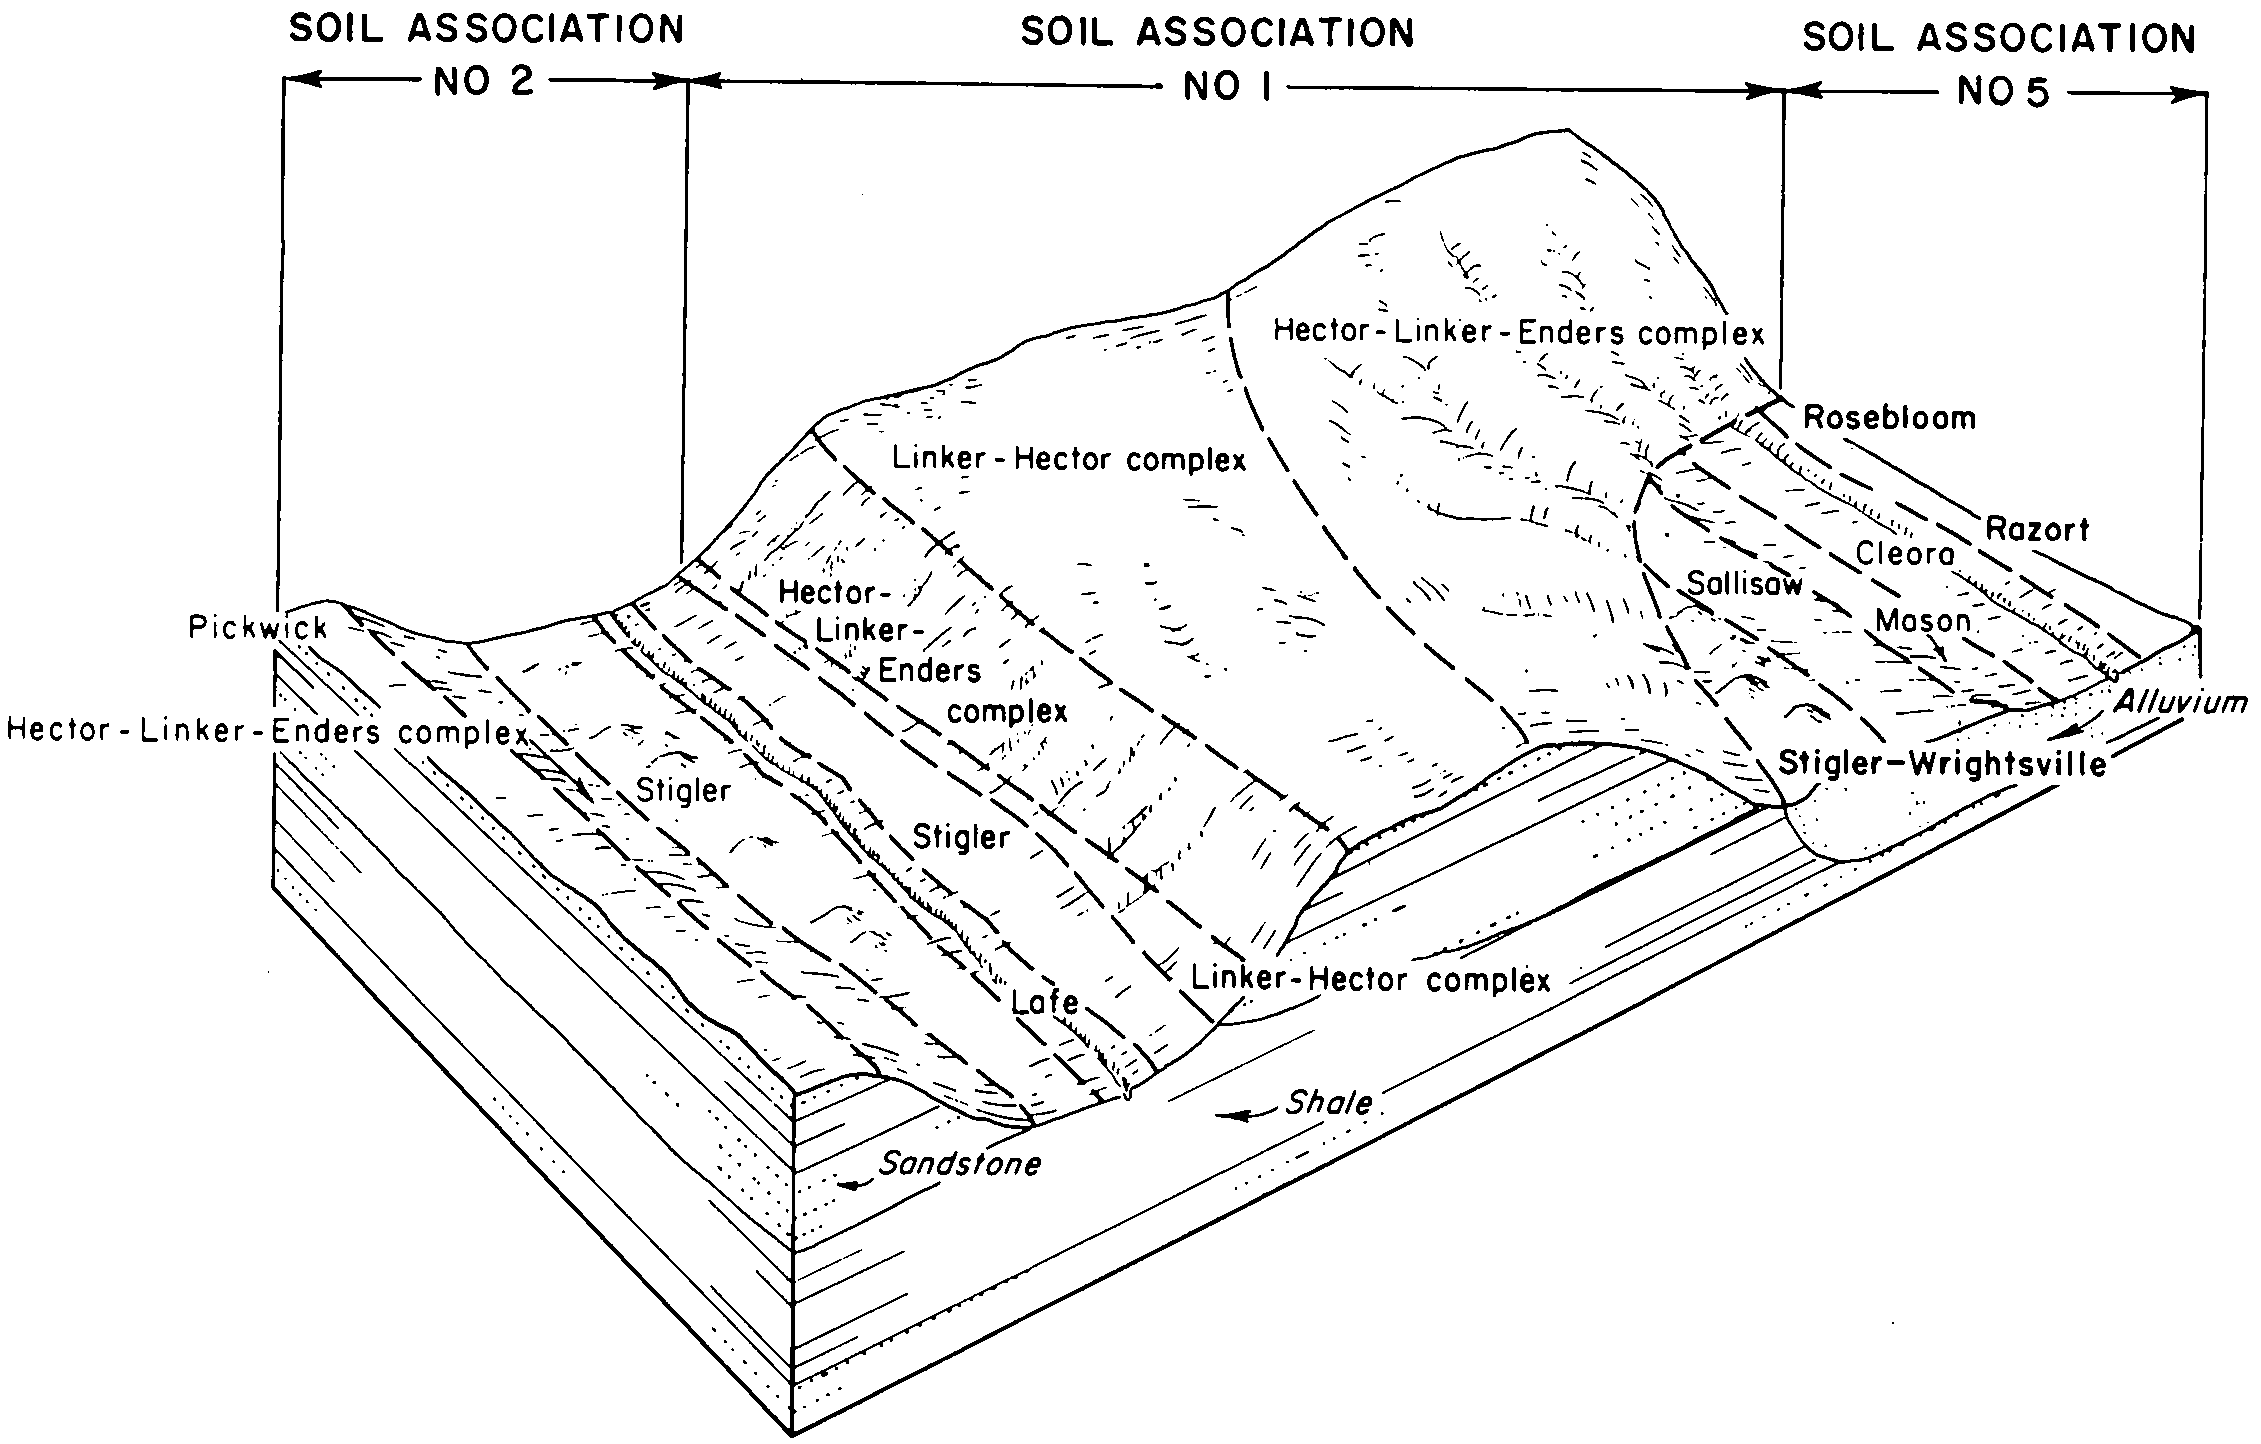
Rosebloom-Arkabutla association, frequently flooded | Rk | 7762 | 331749 | c46l | ms003 | 1967 | 1:20000 |
Rosebloom silt loam | Rb | 1352 | 331748 | c46k | ms003 | 1967 | 1:20000 |
Rosebloom-Arkabutla association, 0 to 2 percent slopes, frequently flooded | 10 | 23030 | 331762 | 2x59j | ms007 | 1997 | 1:24000 |
Rosebloom silt loam, ponded | 12 | 888 | 331764 | c472 | ms007 | 1997 | 1:24000 |
Chenneby-Rosebloom complex, frequently flooded | 14 | 825 | 331766 | c474 | ms007 | 1997 | 1:24000 |
Rosebloom silt loam | Rs | 3064 | 331905 | c4cm | ms017 | 1969 | 1:20000 |
Rosebloom fine sandy loam, sandy variant (bibb) | Ro | 334 | 331904 | c4cl | ms017 | 1969 | 1:20000 |
Rosebloom silt loam, occasionally flooded | Ro | 2351 | 331945 | c4dx | ms019 | 1982 | 1:20000 |
Rosebloom silt loam, 0 to 2 percent slopes, frequently flooded | Rs | 1067 | 331946 | 301km | ms019 | 1982 | 1:20000 |
Bibb and Waverly soils (rosebloom, rosebloom) | Bb | 9512 | 332118 | c4lh | ms031 | 1962 | 1:15840 |
Arkabutla-Rosebloom association, frequently flooded | AR | 7563 | 332382 | c4w0 | ms045 | 1979 | 1:20000 |
Chenneby-Rosebloom complex, frequently flooded | Cm | 4995 | 567953 | m202 | ms051 | 1997 | 1:20000 |
Rosebloom silt loam, depressional | Ro | 2834 | 567987 | m215 | ms051 | 1997 | 1:20000 |
Rosebloom silt loam | Ro | 738 | 568096 | m24p | ms063 | 1976 | 1:20000 |
Rosebloom-Arkabutla association, 0 to 2 percent slopes, frequently flooded | RA | 7002 | 332783 | 2x59j | ms069 | 1991 | 1:20000 |
Rosebloom silt loam, 0 to 2 percent slopes, frequently flooded | Ro | 6969 | 332935 | 301km | ms077 | 1972 | 1:20000 |
Rosebloom and Arkabutla soils, frequently flooded | RK | 63852 | 332992 | c5hp | ms079 | 2008 | 1:24000 |
Rosebloom silt loam, ponded | Rb | 1739 | 1603560 | 1qtmr | ms079 | 2008 | 1:24000 |
Arkabutla-Rosebloom association | AR | 5944 | 568260 | m29z | ms093 | 1968 | 1:20000 |
Rosebloom-Arkabutla association, 0 to 2 percent slopes, frequently flooded | RA | 37713 | 333276 | 2x59j | ms099 | 1979 | 1:20000 |
Arkabutla-Rosebloom association, frequently flooded | AR | 33794 | 333527 | c61y | ms109 | 1980 | 1:20000 |
Rosebloom silt loam | Rs | 1112 | 333730 | c68h | ms115 | 1969 | 1:20000 |
Rosebloom silt loam, frequently flooded | Ro | 362 | 333827 | c6cm | ms117 | 1995 | 1:24000 |
Rosebloom and Arkabutla soils, frequently flooded | Rk | 34382 | 2431374 | 2mm1f | ms123 | 2009 | 1:24000 |
Rosebloom silt loam, ponded | Rb | 496 | 2431375 | 2mm1g | ms123 | 2009 | 1:24000 |
Rosebloom silt loam, 0 to 2 percent slopes, frequently flooded | Ro | 2791 | 333980 | 301km | ms127 | 1993 | 1:20000 |
Rosebloom silt loam | Ro | 2755 | 568545 | m2m5 | ms135 | 1966 | 1:24000 |
Rosebloom silt loam, ponded | 25 | 1444 | 571084 | m582 | ms157 | 2006 | 1:24000 |
Rosebloom silt loam, 0 to 2 percent slopes, frequently flooded | Ro | 11211 | 334615 | 301km | ms159 | 1997 | 1:24000 |
Arkabutla-Rosebloom complex, 0 to 2 percent slopes, frequently flooded | Ao | 2374 | 2545400 | 2qshz | tn005 | 2011 | 1:12000 |
Rosebloom and Bibb soils, 0 to 2 percent slopes, frequently flooded | RO | 1890 | 2545379 | 2qsh9 | tn005 | 2011 | 1:12000 |
Rosebloom silt loam, frequently flooded | Ro | 3860 | 566760 | m0rl | tn033 | 1985 | 1:24000 |
Rosebloom silt loam, ponded | RS | 2123 | 566759 | m0rk | tn033 | 1985 | 1:24000 |
Swamp (Rosebloom) | Sw | 7589 | 566817 | m0tf | tn045 | 1963 | 1:15840 |
Rosebloom silt loam, 0 to 2 percent slopes, frequently flooded, long | Rb | 134 | 3334873 | 2zym9 | tn045 | 1963 | 1:15840 |
Swamp (Rosebloom ponded) | Sw | 3100 | 567030 | m119 | tn047 | 1961 | 1:15840 |
Rosebloom, Waverly silt loams and frequently flooded soils | RS | 16680 | 567062 | m12b | tn053 | 1990 | 1:24000 |
Rosebloom silt loam, ponded | Ro | 6776 | 567063 | m12c | tn053 | 1990 | 1:24000 |
Rosebloom and Bibb soils, frequently flooded | RB | 16217 | 327492 | bzs8 | tn069 | 1996 | 1:24000 |
Rosebloom and Bibb soils, occasionally flooded | RO | 2354 | 327493 | bzs9 | tn069 | 1996 | 1:24000 |
Swamp (Rosebloom) | Sw | 445 | 327649 | bzyb | tn071 | 1961 | 1:15840 |
Rosebloom silt loam, frequently flooded | Re | 18070 | 567105 | m13q | tn075 | 1990 | 1:24000 |
Rosebloom silt loam, rarely flooded | Rb | 3500 | 567104 | m13p | tn075 | 1990 | 1:24000 |
Rosebloom-Center complex, frequently flooded | Rh | 1490 | 567108 | m13t | tn075 | 1990 | 1:24000 |
Rosebloom silt loam, depressional, frequently flooded | Rf | 1490 | 567106 | m13r | tn075 | 1990 | 1:24000 |
Rosebloom silt loam, frequently flooded, ponded | Rg | 1420 | 567107 | m13s | tn075 | 1990 | 1:24000 |
Rosebloom and Bibb soils, 0 to 2 percent slopes, frequently flooded | RO | 9629 | 2545297 | 2qs9b | tn079 | 2012 | 1:12000 |
Arkabutla-Rosebloom complex, 0 to 2 percent slopes, frequently flooded | Ao | 9573 | 2545405 | 2qsj6 | tn079 | 2012 | 1:12000 |
Swamp (Rosebloom, ponded) | Sw | 3466 | 567134 | m14n | tn095 | 1966 | 1:20000 |
Rosebloom silt loam, frequently flooded | Ro | 2951 | 567183 | m167 | tn097 | 1985 | 1:24000 |
Swamp (Rosebloom, ponded) | Sw | 6613 | 567275 | m196 | tn131 | 1966 | 1:15840 |
Rosebloom silt loam, 0 to 2 percent slopes, frequently flooded, long | Ro | 1510 | 3334874 | 2zym9 | tn131 | 1966 | 1:15840 |
Waverly, Rosebloom silt loams and Frequently flooded soils | WR | 30957 | 567392 | m1dz | tn183 | 1986 | 1:24000 |
Rosebloom silt loam, ponded | RO | 4603 | 567385 | m1dr | tn183 | 1986 | 1:24000 |