| Porters loam, 25 to 60 percent slopes | PcF | 3955 | 124546 | 45lm | ga137 | 1960 | 1:20000 |
Porters-Ashe stony loams, 60 to 95 percent slopes | PAG | 1770 | 124543 | 45lj | ga137 | 1960 | 1:20000 |
Porters-Ashe stony loams, 25 to 60 percent slopes | PAF | 1355 | 124542 | 45lh | ga137 | 1960 | 1:20000 |
Porters loam, 60 to 80 percent slopes | PcG | 955 | 124547 | 45ln | ga137 | 1960 | 1:20000 |
Porters loam, 15 to 25 percent slopes | PcE | 600 | 124545 | 45ll | ga137 | 1960 | 1:20000 |
Porters loam, 10 to 15 percent slopes | PcD | 385 | 124544 | 45lk | ga137 | 1960 | 1:20000 |
Porters-Ashe stony loams, 15 to 25 percent slopes | PAE | 150 | 124541 | 45lg | ga137 | 1960 | 1:20000 |
Porters loam, 6 to 15 percent slopes | PcD | 995 | 531357 | ktxk | ga622 | 1967 | 1:20000 |
Edneyville and Porters loams, 25 to 60 percent slopes | EPF | 16670 | 125653 | 46rb | ga632 | 1967 | 1:15840 |
Edneyville and Porters loams, 15 to 25 percent slopes | EPE | 4950 | 125652 | 46r9 | ga632 | 1967 | 1:15840 |
Edneyville and Porters loams, 10 to 15 percent slopes | EPD | 1210 | 125651 | 46r8 | ga632 | 1967 | 1:15840 |
Edneyville and Porters loams, 60 to 80 percent slopes | EPG | 610 | 125654 | 46rc | ga632 | 1967 | 1:15840 |
Porters loam, 25 to 45 percent slopes, stony | PsF | 18595 | 531780 | kvc6 | ga637 | 1990 | 1:20000 |
Porters loam, 45 to 60 percent slopes, stony | PsG | 8725 | 531781 | kvc7 | ga637 | 1990 | 1:20000 |
Saunook-Porters complex, 45 to 60 percent slopes, stony | SpG | 7200 | 531786 | kvcd | ga637 | 1990 | 1:20000 |
Porters-Rock outcrop complex, 60 to 90 percent slopes | PxH | 1940 | 531782 | kvc8 | ga637 | 1990 | 1:20000 |
Porters association, stony, steep | PCF | 22680 | 531399 | ktyx | ga651 | 1976 | 1:20000 |
Porters association, stony, very steep | PCG | 10900 | 531400 | ktyy | ga651 | 1976 | 1:20000 |
Ashe-Porters association, moderately steep | ACE | 5000 | 531383 | ktyd | ga651 | 1976 | 1:20000 |
Porters stony loam, 25 to 45 percent slopes | PsF | 3520 | 545921 | lb2c | nc005 | 1967 | 1:15840 |
Porters stony loam, 45 to 65 percent slopes | PsG | 2477 | 545922 | lb2d | nc005 | 1967 | 1:15840 |
Porters loam, 25 to 45 percent slopes | PoF | 1239 | 545919 | lb29 | nc005 | 1967 | 1:15840 |
Porters loam, 10 to 25 percent slopes | PoE | 1025 | 545918 | lb28 | nc005 | 1967 | 1:15840 |
Porters stony loam, 10 to 25 percent slopes | PsE | 823 | 545920 | lb2b | nc005 | 1967 | 1:15840 |
Porters stony loam, 25 to 65 percent slopes | PsF | 28085 | 545956 | lb3h | nc009 | 1982 | 1:24000 |
Porters stony loam, 15 to 25 percent slopes | PsE | 3018 | 545955 | lb3g | nc009 | 1982 | 1:24000 |
Porters gravelly loam, 30 to 50 percent slopes, stony | PuE | 10822 | 548090 | ldbb | nc011 | 1997 | 1:12000 |
Unaka-Porters complex, 30 to 50 percent slopes, very rocky | UnE | 6898 | 548120 | ldc9 | nc011 | 1997 | 1:12000 |
Unaka-Porters complex, 50 to 95 percent slopes, very rocky | UnF | 5801 | 548121 | ldcb | nc011 | 1997 | 1:12000 |
Porters gravelly loam, 15 to 30 percent slopes, stony | PuD | 5455 | 548089 | ldb9 | nc011 | 1997 | 1:12000 |
Unaka-Porters complex, 15 to 30 percent slopes, very rocky | UnD | 2082 | 548119 | ldc8 | nc011 | 1997 | 1:12000 |
Porters gravelly loam, 50 to 80 percent slopes, stony | PuF | 458 | 548091 | ldbc | nc011 | 1997 | 1:12000 |
Porters gravelly loam, 8 to 15 percent slopes, stony | PuC | 332 | 548088 | ldb8 | nc011 | 1997 | 1:12000 |
Porters loam, 30 to 50 percent slopes, stony | PwE | 62 | 557355 | lpz6 | nc011 | 1997 | 1:12000 |
Porters loam, 15 to 30 percent slopes, stony | PwD | 18 | 557354 | lpz5 | nc011 | 1997 | 1:12000 |
Porters-Unaka complex, 50 to 95 percent slopes, rocky | PxF | 11000 | 1672066 | 1t3xm | nc021 | 2006 | 1:12000 |
Porters-Unaka complex, 30 to 50 percent slopes, stony | PwE | 7333 | 1672065 | 1t3xl | nc021 | 2006 | 1:12000 |
Porters-Unaka complex, 15 to 30 percent slopes, stony | PwD | 2020 | 1672064 | 1t3xk | nc021 | 2006 | 1:12000 |
Porters-Unaka complex, 8 to 15 percent slopes, stony | PwC | 205 | 1672067 | 1t3xn | nc021 | 2006 | 1:12000 |
Unaka-Porters complex, 50 to 95 percent slopes, very rocky | UkF | 254 | 2679267 | 2r93z | nc027 | 2012 | 1:12000 |
Unaka-Porters complex, 30 to 50 percent slopes, very rocky | UkE | 143 | 2679266 | 2r93y | nc027 | 2012 | 1:12000 |
Unaka-Porters complex, 15 to 30 percent slopes, very rocky | UkD | 93 | 2679265 | 2r93x | nc027 | 2012 | 1:12000 |
Porters stony loam, 25 to 45 percent slopes | PoF | 2213 | 546869 | lc1y | nc089 | 1974 | 1:20000 |
Porters stony loam, 45 to 70 percent slopes | PoG | 1603 | 546870 | lc1z | nc089 | 1974 | 1:20000 |
Porters stony loam, 15 to 25 percent slopes | PoE | 1009 | 546868 | lc1x | nc089 | 1974 | 1:20000 |
Porters-Unaka complex, 30 to 50 percent slopes, stony | 761E | 877 | 2509256 | 2p7qy | nc089 | 1974 | 1:20000 |
Porters-Unaka complex, 15 to 30 percent slopes, stony | 761D | 77 | 2509255 | 2p7qx | nc089 | 1974 | 1:20000 |
Porters-Unaka complex, windswept, 50 to 95 percent slopes, rocky | 765F | 28 | 2509285 | 2p7yt | nc089 | 1974 | 1:20000 |
Porters-Unaka complex, windswept, 30 to 50 percent slopes, stony | 765E | 8 | 2509284 | 2p7ys | nc089 | 1974 | 1:20000 |
Porters-Unaka complex, windswept, 8 to 15 percent slopes, stony | 765C | 7 | 2509286 | 2p7yv | nc089 | 1974 | 1:20000 |
Porters-Unaka complex, 8 to 15 percent slopes, stony | 761C | 4 | 2509257 | 2p7r0 | nc089 | 1974 | 1:20000 |
Porters-Unaka complex, windswept, 15 to 30 percent slopes, stony | 765D | 3 | 2509283 | 2p7yr | nc089 | 1974 | 1:20000 |
Porters loam, 25 to 80 percent slopes, stony | PoF | 1795 | 547213 | lcf1 | nc111 | 1989 | 1:24000 |
Porters loam, 6 to 25 percent slopes, stony | PoD | 471 | 547212 | lcf0 | nc111 | 1989 | 1:24000 |
Porters-Unaka complex, 50 to 95 percent slopes, rocky | PxF | 9431 | 1671421 | 1t37t | nc115 | 2006 | 1:12000 |
Porters-Unaka complex, 30 to 50 percent slopes, stony | PwE | 7244 | 1671420 | 1t37s | nc115 | 2006 | 1:12000 |
Porters-Unaka complex, 15 to 30 percent slopes, stony | PwD | 2338 | 1671419 | 1t37r | nc115 | 2006 | 1:12000 |
Porters-Unaka complex, 8 to 15 percent slopes, stony | PwC | 146 | 1671418 | 1t37q | nc115 | 2006 | 1:12000 |
Porters-Unaka complex, 30 to 50 percent slopes, stony | 761E | 4782 | 2501831 | 2q8kw | nc175 | 1968 | 1:15840 |
Unaka-Porters complex, 50 to 95 percent slopes, very rocky | BrG | 981 | 2390360 | 2l7cd | nc175 | 1968 | 1:15840 |
Porters-Unaka complex, 15 to 30 percent slopes, stony | 761D | 845 | 2501830 | 2q8kv | nc175 | 1968 | 1:15840 |
Porters loam, 30 to 50 percent slopes, stony | PoF | 265 | 2390389 | 2l7db | nc175 | 1968 | 1:15840 |
Porters-Unaka complex, 30 to 50 percent slopes, rocky | PrF | 148 | 2390390 | 2l7dc | nc175 | 1968 | 1:15840 |
Porters-Unaka complex, windswept, 15 to 30 percent slopes, stony | 765D | 122 | 2501860 | 2q8kz | nc175 | 1968 | 1:15840 |
Porters-Unaka complex, windswept, 30 to 50 percent slopes, stony | 765E | 76 | 2501861 | 2q8l0 | nc175 | 1968 | 1:15840 |
Porters-Unaka complex, 8 to 15 percent slopes, stony | 761C | 52 | 2501832 | 2q8kx | nc175 | 1968 | 1:15840 |
Unaka-Porters complex 30 to 50 percent slopes, very rocky | BrF | 32 | 2390359 | 2l7cc | nc175 | 1968 | 1:15840 |
Porters-Unaka complex, windswept, 50 to 95 percent slopes, rocky | 765F | 19 | 2501862 | 2q8l1 | nc175 | 1968 | 1:15840 |
Porters-Unaka complex, windswept, 8 to 15 percent slopes, stony | 765C | 18 | 2501863 | 2q8l2 | nc175 | 1968 | 1:15840 |
Porters loam, 15 to 30 percent slopes, stony | PoE | 3 | 2390388 | 2l7d9 | nc175 | 1968 | 1:15840 |
Porters loam, 30 to 50 percent slopes, stony | PuE | 12032 | 563354 | lx6q | nc189 | 2001 | 1:12000 |
Unaka-Porters complex, 30 to 50 percent slopes, very rocky | UkE | 11930 | 563219 | lx2c | nc189 | 2001 | 1:12000 |
Porters loam, 15 to 30 percent slopes, stony | PuD | 4382 | 563352 | lx6n | nc189 | 2001 | 1:12000 |
Unaka-Porters complex, 15 to 30 percent slopes, very rocky | UkD | 4319 | 563218 | lx2b | nc189 | 2001 | 1:12000 |
Unaka-Porters complex, 50 to 95 percent slopes, very rocky | UkF | 3395 | 563235 | lx2w | nc189 | 2001 | 1:12000 |
Porters loam, 50 to 95 percent slopes, stony | PuF | 971 | 563362 | lx6z | nc189 | 2001 | 1:12000 |
Porters loam, 8 to 15 percent slopes, stony | PuC | 928 | 563339 | lx67 | nc189 | 2001 | 1:12000 |
Unaka-Porters complex, 8 to 15 percent slopes, very rocky | UkC | 451 | 563217 | lx29 | nc189 | 2001 | 1:12000 |
Porters loam, 15 to 25 percent slopes, stony | PwD | 100 | 1383497 | 1hfmy | nc193 | 1993 | 1:24000 |
Porters-Unaka complex, 50 to 95 percent slopes, rocky | PwF | 17549 | 547860 | ld2x | nc199 | 1997 | 1:12000 |
Porters-Unaka complex, 30 to 50 percent slopes, stony | PuE | 3958 | 547859 | ld2w | nc199 | 1997 | 1:12000 |
Porters-Unaka complex, 15 to 30 percent slopes, stony | PuD | 884 | 547858 | ld2v | nc199 | 1997 | 1:12000 |
Porters-Unaka complex, 8 to 15 percent slopes, stony | PuC | 195 | 547857 | ld2t | nc199 | 1997 | 1:12000 |
Porters-Unaka complex, windswept, 30 to 50 percent slopes, stony | 765E | 56 | 2509086 | 2q1wb | nc606 | 1991 | 1:12000 |
Porters-Unaka complex, 30 to 50 percent slopes, stony | 761E | 47 | 2509058 | 2q1w8 | nc606 | 1991 | 1:12000 |
Porters-Unaka complex, windswept, 50 to 95 percent slopes, rocky | 765F | 22 | 2509087 | 2q1wq | nc606 | 1991 | 1:12000 |
Porters-Unaka complex, windswept, 15 to 30 percent slopes, stony | 765D | 1 | 2509085 | 2q1w9 | nc606 | 1991 | 1:12000 |
Porters loam, 15 to 40 percent slopes | PrF | 454 | 132508 | 4fwg | sc045 | 1972 | 1:20000 |
Porters loam, 40 to 70 percent slopes | PrG | 388 | 132509 | 4fwh | sc045 | 1972 | 1:20000 |
Porters loam, 6 to 15 percent slopes | PrD | 297 | 132507 | 4fwf | sc045 | 1972 | 1:20000 |
Porters stony loam, 25 to 45 percent slopes | PsF | 355 | 130996 | 4d9p | sc602 | 1960 | 1:20000 |
Porters loam, 25 to 45 percent slopes | PoF | 272 | 130995 | 4d9n | sc602 | 1960 | 1:20000 |
Stony land | St | 182 | 130998 | 4d9r | sc602 | 1960 | 1:20000 |
Porters gravelly loam, 50 to 80 percent slopes, stony | PnF | 5574 | 526480 | knv7 | tn019 | 2000 | 1:24000 |
Porters gravelly loam, 30 to 50 percent slopes, stony | PnE | 1328 | 526479 | knv6 | tn019 | 2000 | 1:24000 |
Porters gravelly loam, 15 to 30 percent slopes, stony | PnD | 786 | 526478 | knv5 | tn019 | 2000 | 1:24000 |
Porters loam, 15 to 30 percent slopes, stony | PoE | 297 | 526551 | knxj | tn091 | 2000 | 1:24000 |
Porters stony loam, 25 to 65 percent slopes | PsF | 239 | 526553 | knxl | tn091 | 2000 | 1:24000 |
Unaka-Porters complex, 35 to 50 percent slopes | 110F | 587 | 2401344 | 2llsq | tn171 | 1980 | 1:24000 |
Porters loam, 20 to 35 percent slopes | PsE | 289 | 524825 | km3v | tn606 | 2001 | 1:24000 |
Porters-Unaka complex, 15 to 30 percent slopes, stony | PuD | 264 | 524851 | km4p | tn606 | 2001 | 1:24000 |
Porters loam, 35 to 50 percent slopes | PsF | 194 | 524826 | km3w | tn606 | 2001 | 1:24000 |
Porters-Unaka complex, 30 to 50 percent slopes, stony | PuE | 17 | 524852 | km4q | tn606 | 2001 | 1:24000 |
Porters very stony loam, 25 to 45 percent slopes | 70E | 1800 | 516449 | kbdn | va003 | 1981 | 1:15840 |
Porters very stony loam, 15 to 25 percent slopes | 70D | 280 | 516448 | kbdm | va003 | 1981 | 1:15840 |
Porters very stony loam, 7 to 15 percent slopes | 70C | 210 | 516447 | kbdl | va003 | 1981 | 1:15840 |
Porters loam, steep | PoE | 8521 | 519271 | kfbp | va035 | 1965 | 1:15840 |
Porters loam, moderately steep | PoD | 4129 | 519270 | kfbn | va035 | 1965 | 1:15840 |
Porters loam, sloping | PoC | 1513 | 519269 | kfbm | va035 | 1965 | 1:15840 |
Porters loam, very steep | PoF | 861 | 519272 | kfbq | va035 | 1965 | 1:15840 |
Unaka-Porters complex, 15 to 35 percent slopes | 47D | 213 | 1914817 | 228j9 | va063 | 2007 | 1:24000 |
Unaka-Porters complex, 8 to 15 percent slopes | 47C | 187 | 1914816 | 228j8 | va063 | 2007 | 1:24000 |
Trimont-Porters complex, 45 to 95 percent slopes, very stony | 37F | 2130 | 582045 | mjnn | va067 | 2004 | 1:24000 |
Trimont-Porters complex, 25 to 45 percent slopes, very stony | 37E | 737 | 582044 | mjnm | va067 | 2004 | 1:24000 |
Porters very stony loam, 25 to 50 percent slopes | PoF | 12106 | 517038 | kc0n | va113 | 1967 | 1:15840 |
Porters very stony loam, 15 to 25 percent slopes | PoD | 2333 | 517037 | kc0m | va113 | 1967 | 1:15840 |
Porters very stony loam, 7 to 15 percent slopes | PoC | 527 | 517036 | kc0l | va113 | 1967 | 1:15840 |
Porters stony loam, steep phase | PoE | 2929 | 517457 | kcg5 | va157 | 1958 | 1:20000 |
Porters stony loam, moderately steep phase | PoD | 980 | 517456 | kcg4 | va157 | 1958 | 1:20000 |
Porters stony loam, sloping phase | PoC | 872 | 517455 | kcg3 | va157 | 1958 | 1:20000 |
Porters stony loam, gently sloping phase | PoB | 140 | 517454 | kcg2 | va157 | 1958 | 1:20000 |
Porters stony loam, 15 to 35 percent slopes | 51D | 757 | 2525250 | 2qm1j | va606 | | 1:24000 |
Porters stony loam, 35 to 60 percent slopes, extremely stony | 51E | 493 | 2525251 | 2qm1k | va606 | | 1:24000 |
Porters stony loam, 6 to 15 percent slopes | 51C | 465 | 2525249 | 2qm1h | va606 | | 1:24000 |
Porters-Rock outcrop complex, 15 to 35 percent slopes, rubbly | 25E | 57 | 3086816 | 2yn82 | va850 | | 1:24000 |

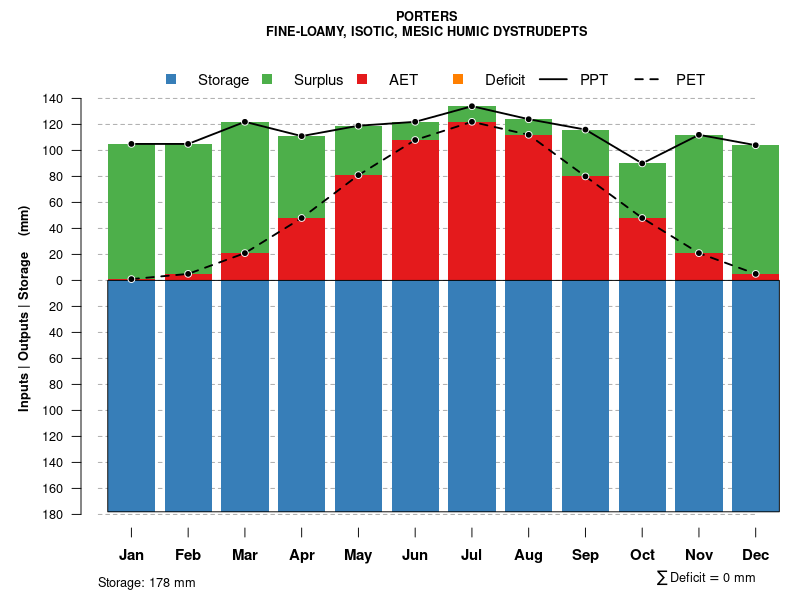
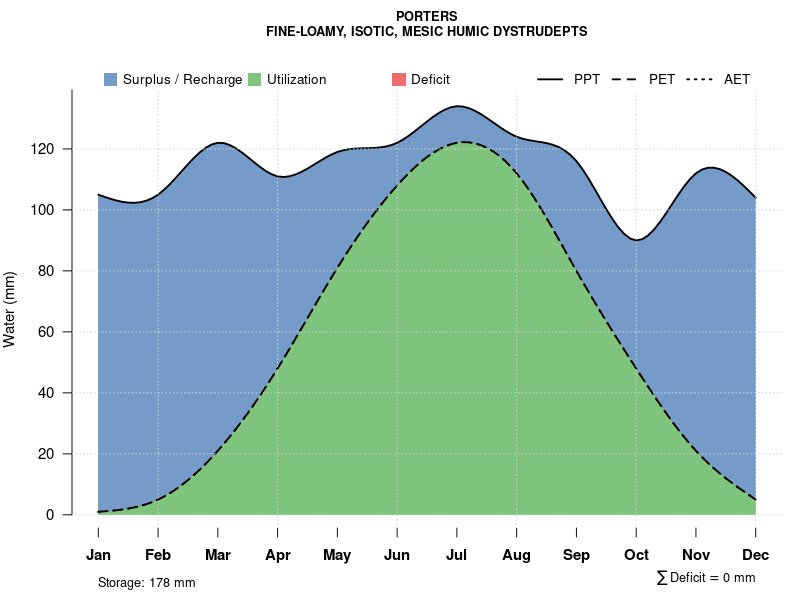

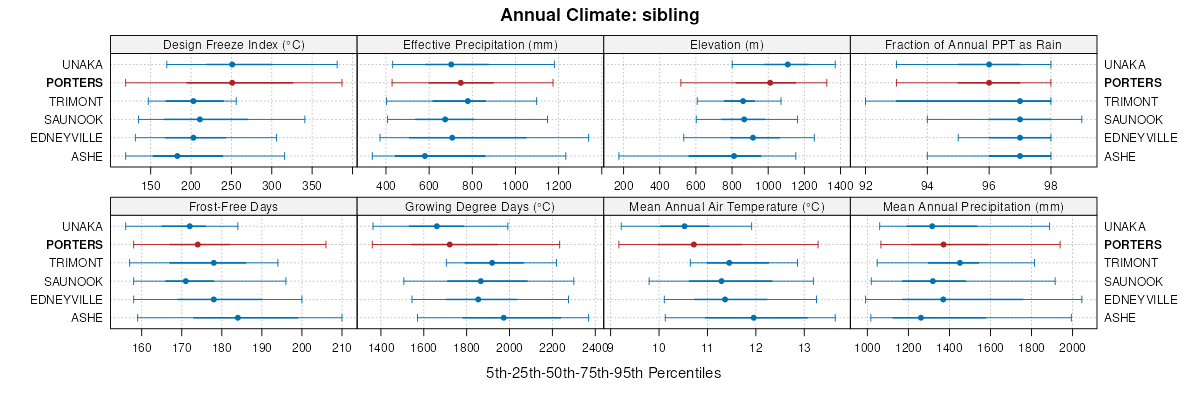
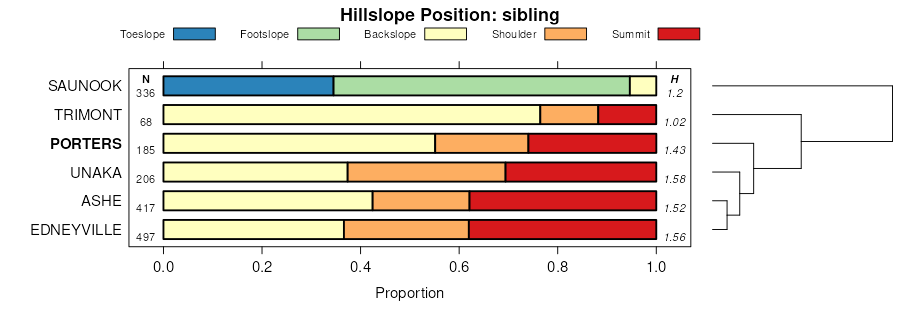


