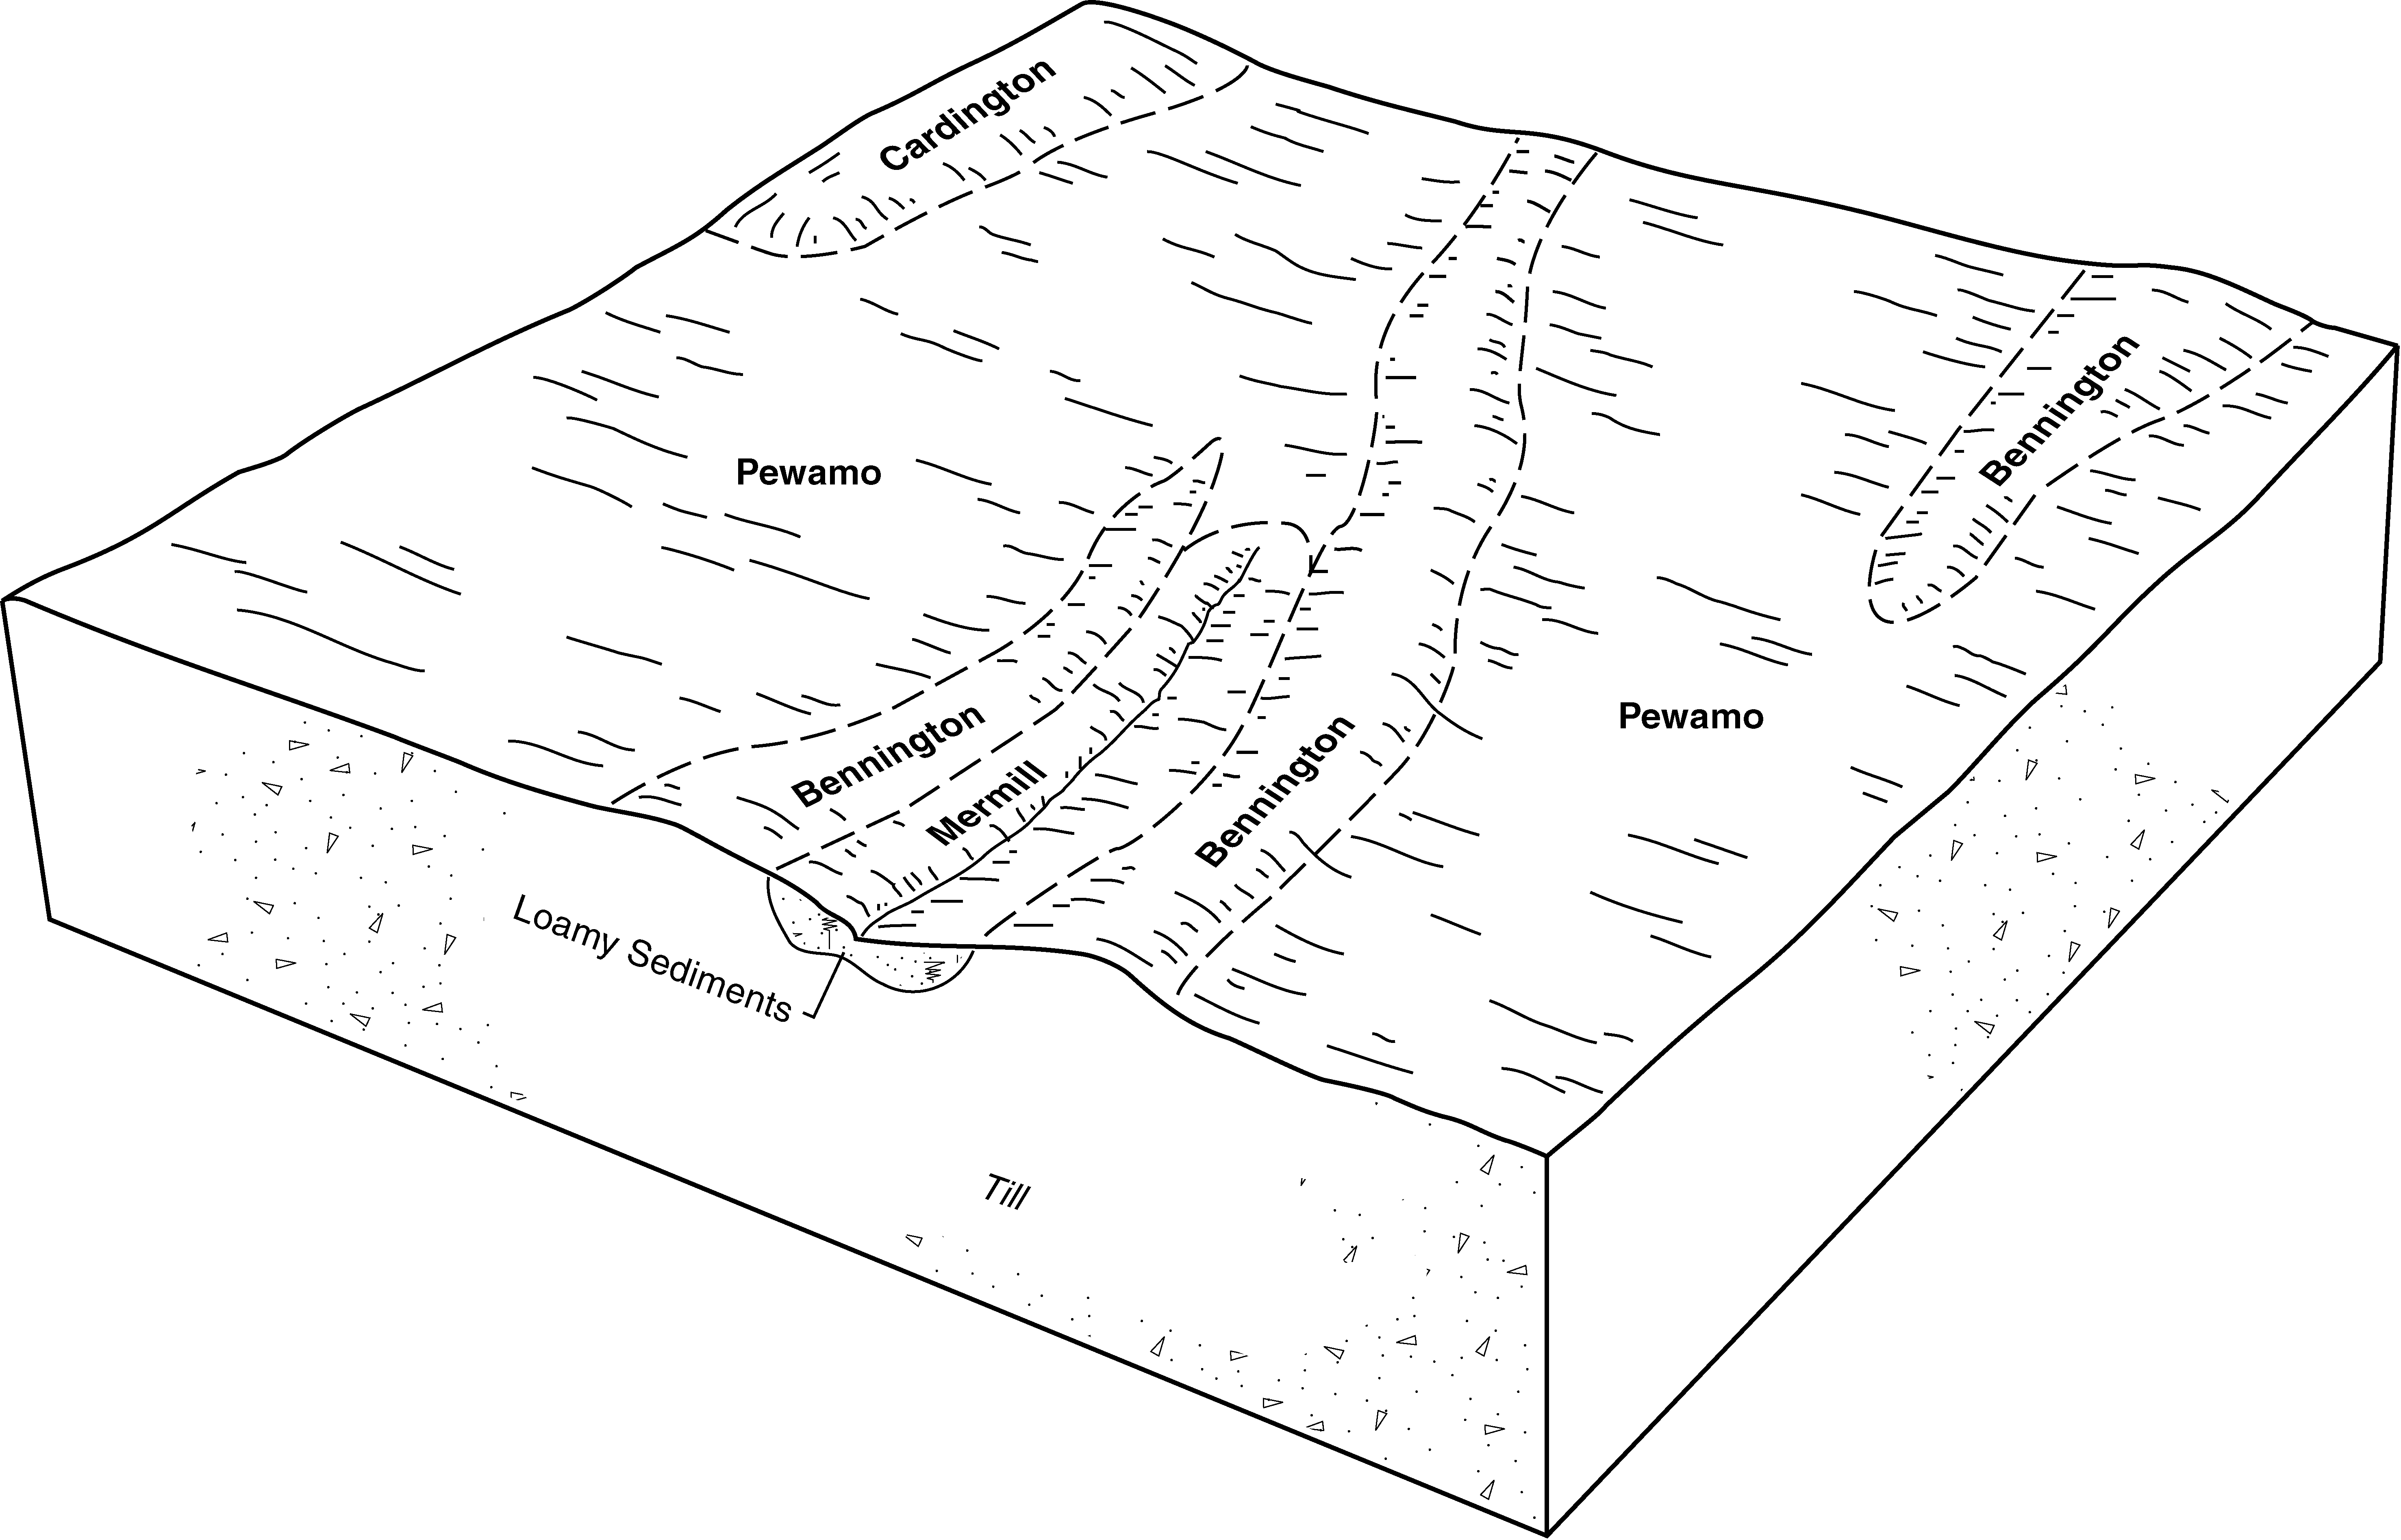
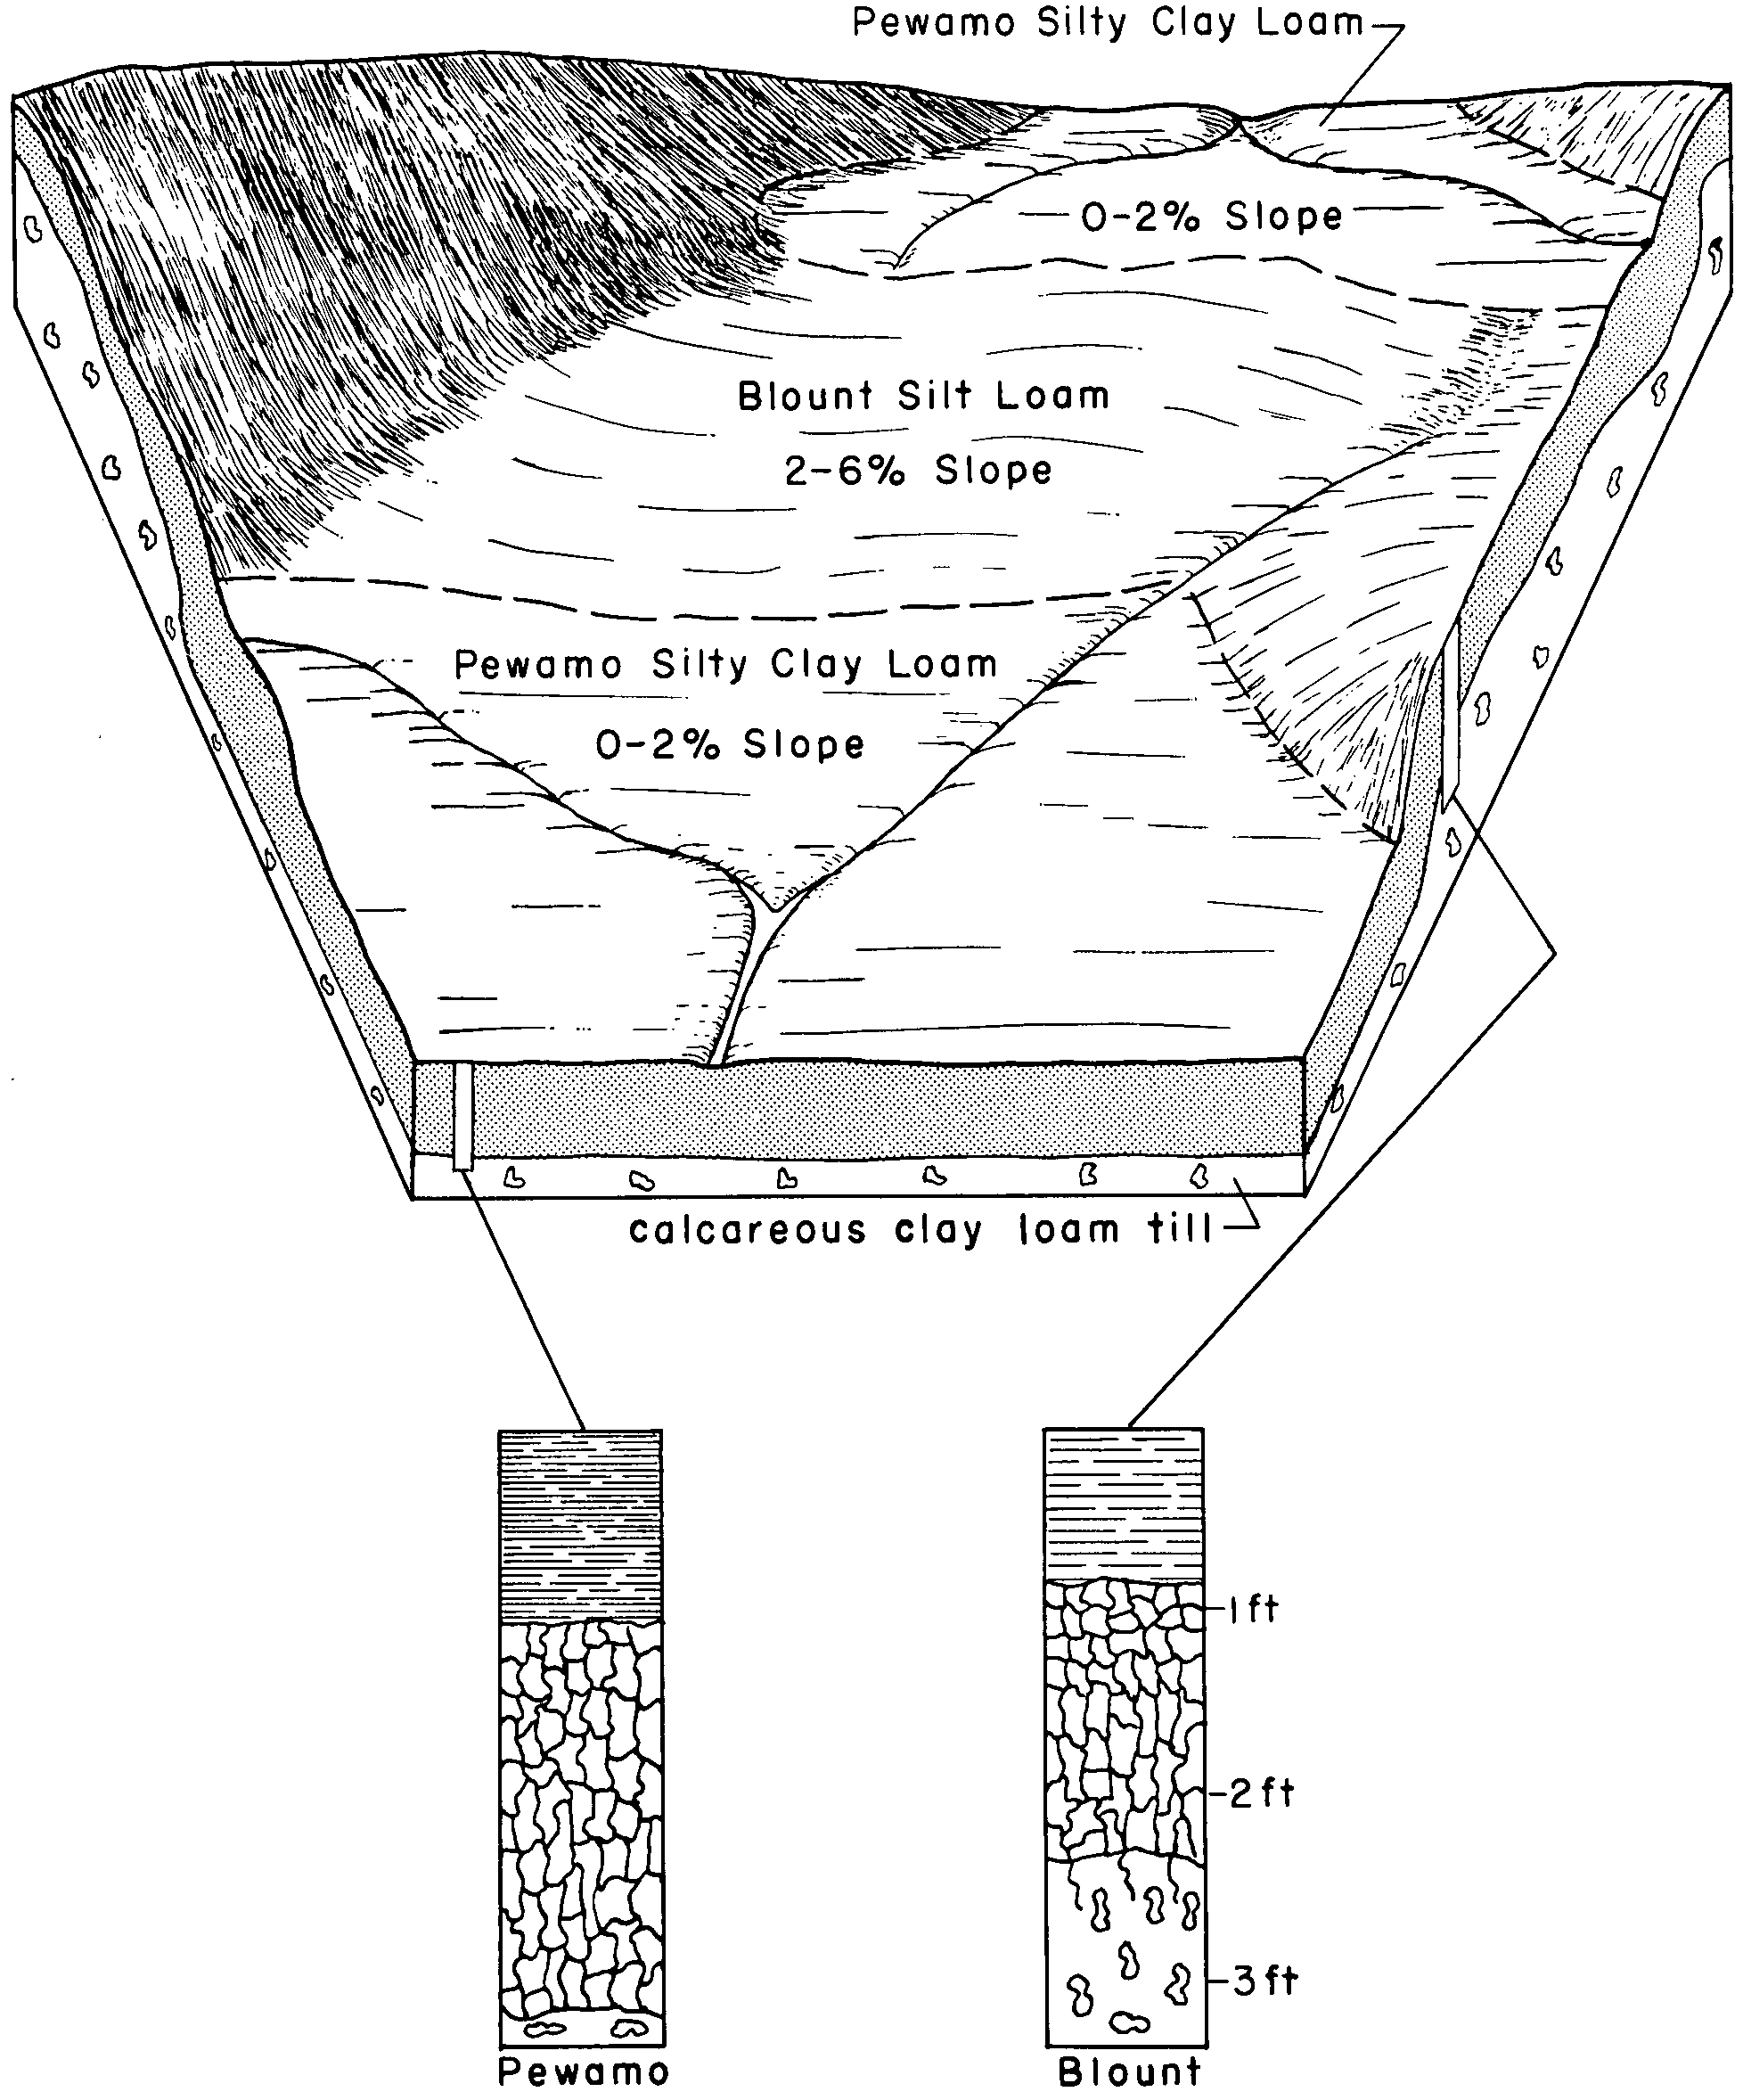
| Pewamo silty clay, 0 to 2 percent slopes | Pm | 75423 | 163442 | 2t6m0 | in001 | 1983 | 1:15840 |
Pewamo silty clay-Urban land complex, 0 to 2 percent slopes | YpmA | 183 | 3216802 | 2yc2z | in001 | 1983 | 1:15840 |
Urban land-Pewamo complex, 0 to 2 percent slopes | UpmA | 166 | 3216794 | 2yc5d | in001 | 1983 | 1:15840 |
Pewamo silty clay loam, 0 to 1 percent slopes | Pe | 67138 | 164738 | 2t6lv | in003 | 1965 | 1:15840 |
Pewamo-Urban land complex, 0 to 1 percent slopes | YpfA | 7226 | 3404600 | 2yc2y | in003 | 1965 | 1:15840 |
Urban land-Pewamo complex, 0 to 1 percent slopes | UppA | 1742 | 3404599 | 2yc4t | in003 | 1965 | 1:15840 |
Pewamo mucky silty clay loam | Pc | 209 | 164737 | 5jf3 | in003 | 1965 | 1:15840 |
Pewamo mucky silty clay loam-Urban land complex, 0 to 2 percent slopes | YpnA | 15 | 3404528 | 3129s | in003 | 1965 | 1:15840 |
Pewamo silty clay, 0 to 2 percent slopes | Pm | 26540 | 623801 | 2t6m0 | in009 | 1983 | 1:15840 |
Pewamo silty clay-Urban land complex, 0 to 2 percent slopes | YpmA | 109 | 3216813 | 2yc2z | in009 | 1983 | 1:15840 |
Urban land-Pewamo complex, 0 to 2 percent slopes | UpmA | 56 | 3216807 | 2yc5d | in009 | 1983 | 1:15840 |
Pewamo silty clay | Pe | 40838 | 160338 | 5cv6 | in033 | 1980 | 1:15840 |
Pewamo silty clay loam, 0 to 1 percent slopes | PkkA | 43775 | 164942 | 2t6lv | in035 | 1997 | 1:12000 |
Urban land-Blount-Pewamo complex, 0 to 2 percent slopes | UdmA | 6732 | 165000 | 5jpl | in035 | 1997 | 1:12000 |
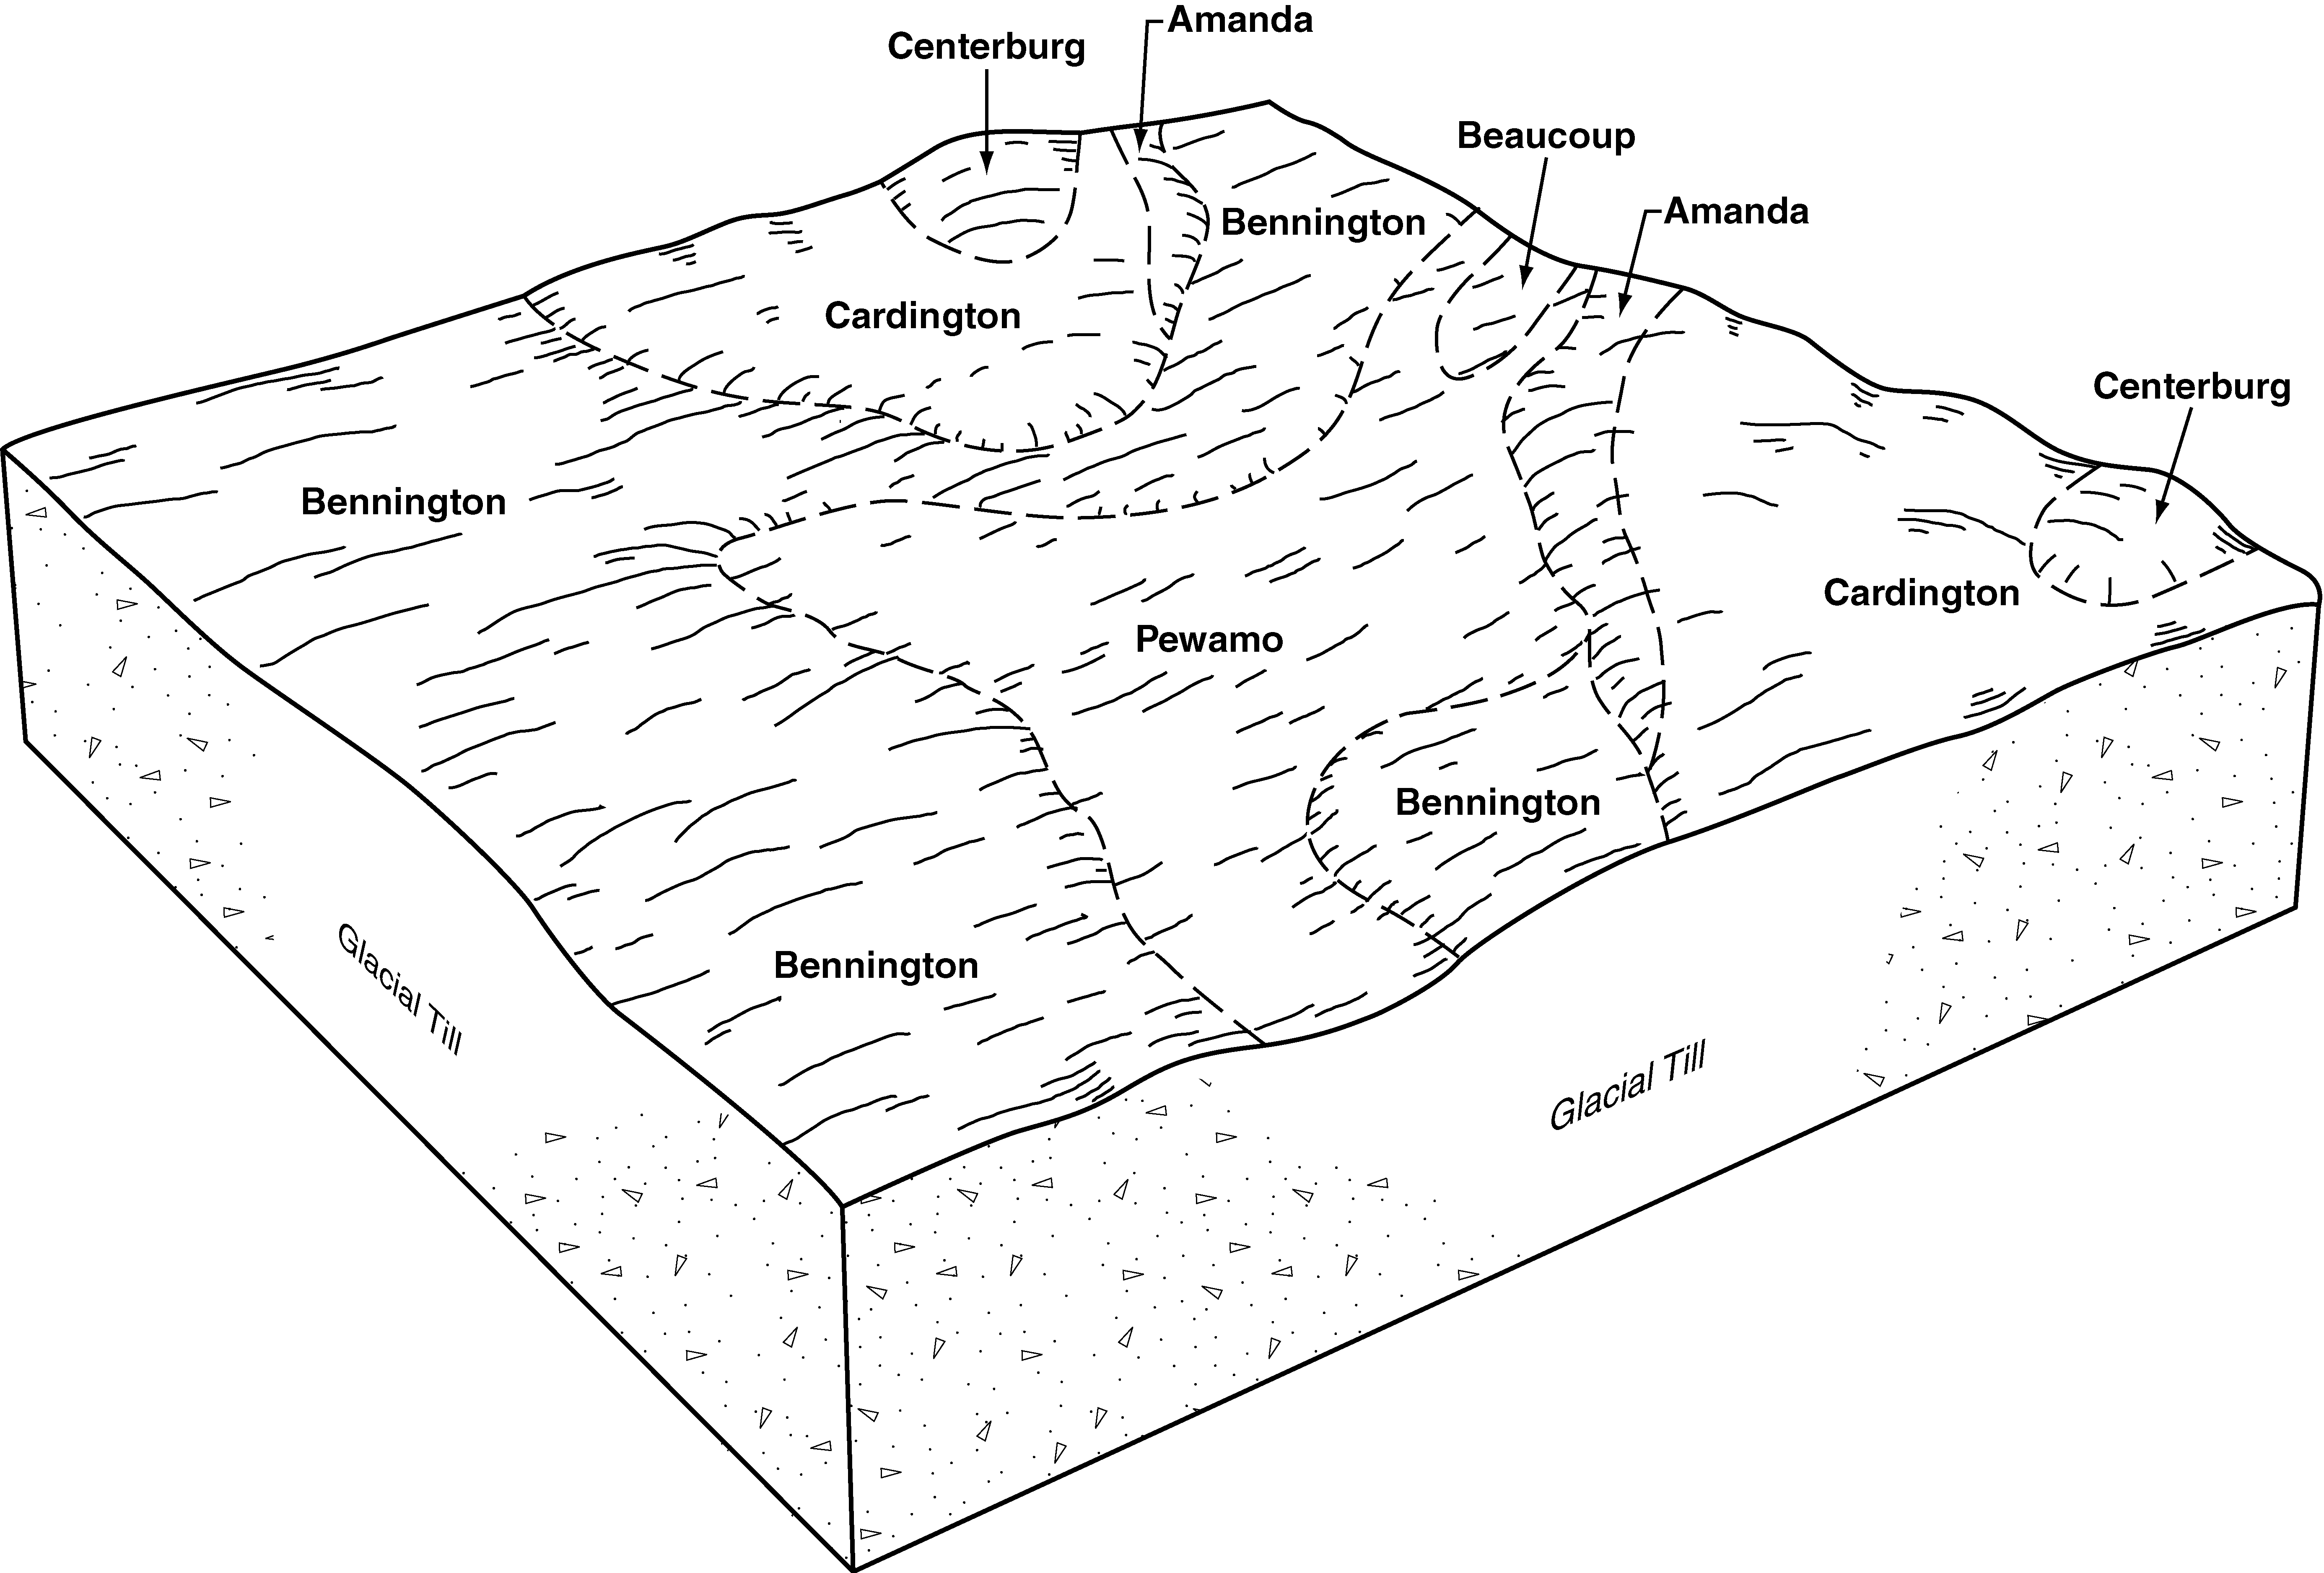
Pewamo clay loam, 0 to 2 percent slopes | PkdA | 1697 | 165433 | 2t6lz | in039 | 1997 | 1:12000 |
Pewamo clay loam, 0 to 2 percent slopes | Pe | 440 | 162587 | 2t6lz | in049 | 1984 | 1:15840 |
Pewamo silty clay loam, 0 to 1 percent slopes | Pw | 103159 | 162806 | 2t6lv | in053 | 1985 | 1:15840 |
Urban land-Pewamo complex | Ut | 5131 | 162814 | 5gf2 | in053 | 1985 | 1:15840 |
Pewamo-Urban land complex, 0 to 1 percent slopes | YpgA | 33 | 3216823 | 2yc2y | in053 | 1985 | 1:15840 |
Urban land-Pewamo complex, 0 to 1 percent slopes | UpwA | 6 | 3216818 | 2yc4t | in053 | 1985 | 1:15840 |
Pewamo silty clay loam, 0 to 1 percent slopes | Pe | 19218 | 161472 | 2t6lv | in067 | 1967 | 1:20000 |
Pewamo silty clay loam, 0 to 1 percent slopes | Pg | 71369 | 161428 | 2t6lv | in069 | 1980 | 1:15840 |
Pewamo-Urban land complex, 0 to 1 percent slopes | YpgA | 162 | 3216848 | 2yc2y | in069 | 1980 | 1:15840 |
Urban land-Pewamo complex, 0 to 1 percent slopes | UpwA | 112 | 3216833 | 2yc4t | in069 | 1980 | 1:15840 |
Pewamo silty clay, 0 to 2 percent slopes | Pm | 58873 | 210648 | 2t6m0 | in075 | 1983 | 1:15840 |
Pewamo silty clay-Urban land complex, 0 to 2 percent slopes | YpmA | 355 | 3216859 | 2yc2z | in075 | 1983 | 1:15840 |
Urban land-Pewamo complex, 0 to 2 percent slopes | UpmA | 77 | 3216855 | 2yc5d | in075 | 1983 | 1:15840 |
Pewamo silty clay loam, 0 to 1 percent slopes | Pe | 1715 | 160906 | 2t6lv | in085 | 1985 | 1:20000 |
Pewamo silty clay loam | Pt | 1502 | 272625 | 94pc | in087 | 1978 | 1:20000 |
Pewamo silty clay loam | Pc | 27907 | 272487 | 94jx | in089 | 1967 | 1:15840 |
Pewamo silty clay loam, calcareous variant | Pe | 1655 | 272488 | 94jy | in089 | 1967 | 1:15840 |
Pewamo silty clay loam | Pe | 1302 | 272681 | 94r5 | in091 | 1979 | 1:15840 |
Pewamo silty clay loam, 0 to 1 percent slopes | Pc | 16986 | 162119 | 2t6lv | in095 | 1965 | 1:15840 |
Pewamo silty clay loam, 0 to 1 percent slopes | Pw | 33140 | 161986 | 2t6lv | in103 | 1977 | 1:20000 |
Pewamo silty clay loam, 0 to 1 percent slopes | Pe | 14022 | 272566 | 2t6lv | in113 | 1974 | 1:15840 |
Pewamo silty clay loam | Pe | 9855 | 160673 | 5d60 | in127 | 1978 | 1:15840 |
Pewamo silty clay loam, 0 to 1 percent slopes | Pw | 38628 | 161311 | 2t6lv | in135 | 1984 | 1:15840 |
Pewamo silt loam, overwash | Px | 629 | 161312 | 5dvm | in135 | 1984 | 1:15840 |
Pewamo silty clay loam, 0 to 1 percent slopes | Pe | 7164 | 160233 | 2t6lv | in151 | 1979 | 1:20000 |
Pewamo silty clay loam, 0 to 1 percent slopes | Pw | 14864 | 161221 | 2t6lv | in169 | 1980 | 1:15840 |
Pewamo silty clay loam, 0 to 1 percent slopes | Pm | 77582 | 161269 | 2t6lv | in179 | 1988 | 1:15840 |
Pewamo-Urban land complex, 0 to 1 percent slopes | YpgA | 253 | 3216873 | 2yc2y | in179 | 1988 | 1:15840 |
Urban land-Pewamo complex, 0 to 1 percent slopes | UpwA | 168 | 3216865 | 2yc4t | in179 | 1988 | 1:15840 |
Pewamo silty clay loam, 0 to 1 percent slopes | Pw | 27806 | 161809 | 2t6lv | in183 | 1985 | 1:15840 |
Pewamo silt loam | 45 | 5581 | 212468 | 742t | mi005 | 1984 | 1:15840 |
Pewamo silt loam | 36 | 3813 | 186176 | 67qp | mi021 | 1979 | 1:15840 |
Pewamo clay loam | 78 | 3979 | 188726 | 6bcy | mi025 | 1993 | 1:15840 |
Pewamo silt loam | 20 | 8931 | 188635 | 6b90 | mi059 | 1991 | 1:15840 |
Pewamo loam | Pn | 2178 | 188176 | 69t6 | mi067 | 1965 | 1:15840 |
Pewamo clay loam | Pm | 1473 | 188175 | 69t5 | mi067 | 1965 | 1:15840 |
Pewamo loam | 47 | 3500 | 187155 | 68r8 | mi081 | 1984 | 1:15840 |
Pewamo loam | Pe | 5643 | 192135 | 6fxx | mi087 | 1966 | 1:15840 |
Pewamo clay loam, 0 to 2 percent slopes | Pm | 519 | 192136 | 2t6lz | mi087 | 1966 | 1:15840 |
Pewamo clay loam, dense substratum, 0 to 1 percent slopes | PwmaaA | 33 | 2673684 | 2qz3f | mi087 | 1966 | 1:15840 |
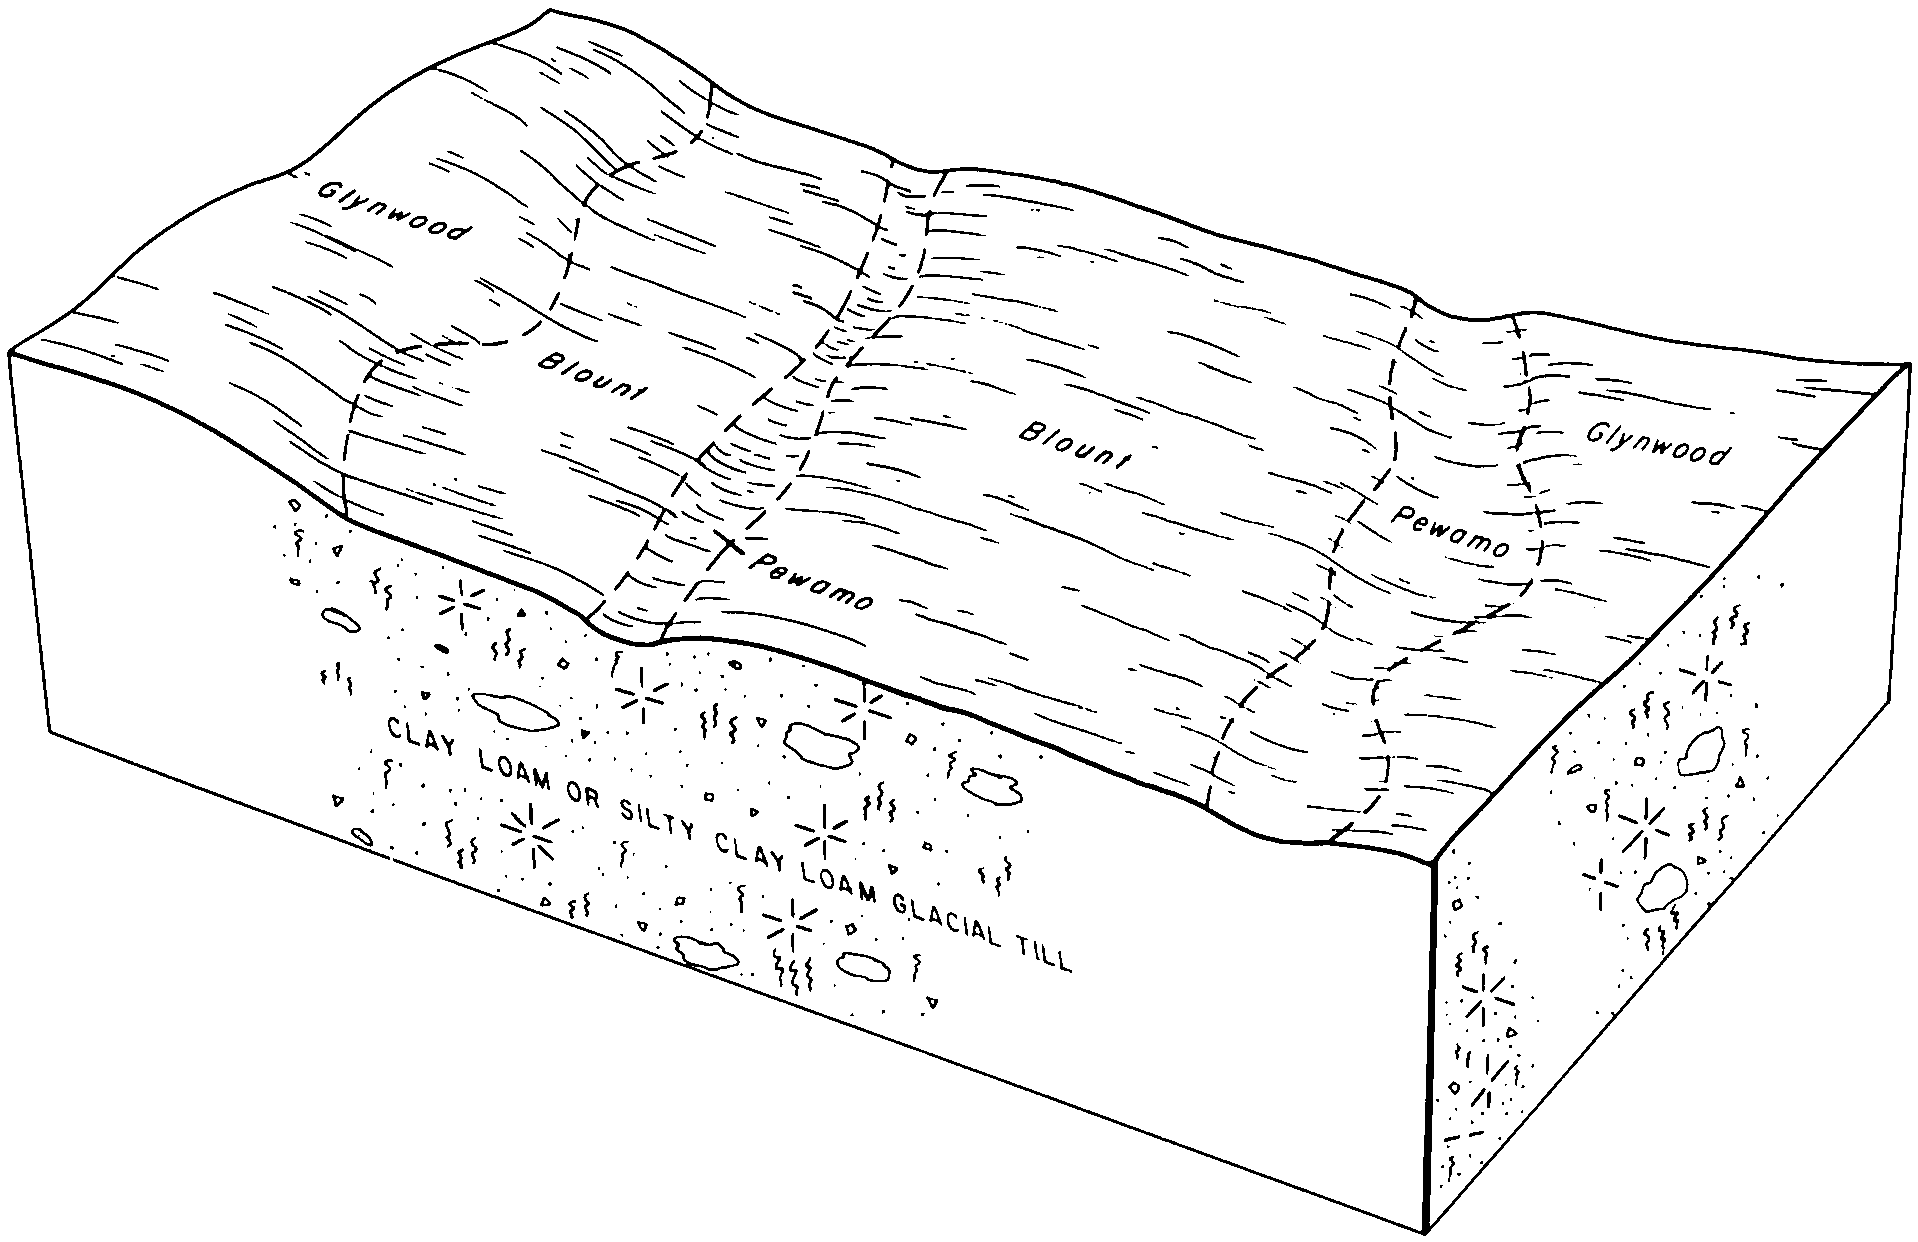
Pewamo clay loam, 0 to 2 percent slopes | PbA | 20011 | 188551 | 2t6lz | mi091 | 1957 | 1:20000 |
Blount loam and Pewamo clay loam, 0 to 3 percent slopes | BgA | 5397 | 188440 | 6b2q | mi091 | 1957 | 1:20000 |
Pewamo clay loam, dense substratum, 0 to 1 percent slopes | PwmaaA | 4490 | 2673730 | 2qz3f | mi091 | 1957 | 1:20000 |
Pewamo mucky clay loam, 0 to 3 percent slopes | PcA | 2254 | 188552 | 6b6b | mi091 | 1957 | 1:20000 |
Selfridge-Pewamo complex, 0 to 3 percent slopes | ShA | 86 | 2509151 | 68tp | mi091 | 1957 | 1:20000 |
Pewamo clay loam | Pc | 1474 | 187599 | 696l | mi093 | 1968 | 1:20000 |
Pewamo clay loam, 0 to 2 percent slopes | Pm | 378 | 2508537 | 2t6lz | mi099 | 1967 | 1:20000 |
Pewamo clay loam, dense substratum, 0 to 1 percent slopes | PwmaaA | 221 | 2673711 | 2qz3f | mi099 | 1967 | 1:20000 |
Pewamo clay loam | 22 | 46944 | 187232 | 68tr | mi115 | 1980 | 1:15840 |
Selfridge-Pewamo complex, 0 to 3 percent slopes | 20A | 23761 | 187230 | 68tp | mi115 | 1980 | 1:15840 |
Blount-Pewamo-Metamora complex, 0 to 3 percent slopes | 62A | 2378 | 187267 | 68vw | mi115 | 1980 | 1:15840 |
Urban land-Selfridge-Pewamo complex, 0 to 3 percent slopes | 59A | 1329 | 187264 | 68vs | mi115 | 1980 | 1:15840 |
Pewamo clay loam, dense substratum, 0 to 1 percent slopes | PwmaaA | 12 | 2673732 | 2qz3f | mi115 | 1980 | 1:15840 |
Pewamo loam | 146 | 15 | 2673701 | 6fxx | mi125 | 1980 | 1:15840 |
Pewamo loam | Pf | 808 | 2508385 | 6fxx | mi147 | 1969 | 1:20000 |
Pewamo clay loam, 0 to 2 percent slopes | Pm | 91 | 2508386 | 2t6lz | mi147 | 1969 | 1:20000 |
Pewamo silty clay loam | 56 | 2495 | 186339 | 67wy | mi159 | 1984 | 1:15840 |
Pewamo clay loam, 0 to 2 percent slopes | Pe | 12782 | 191665 | 2t6lz | mi161 | 1974 | 1:20000 |
Pewamo clay loam, dense substratum, 0 to 1 percent slopes | PwmaaA | 2230 | 2673717 | 2qz3f | mi161 | 1974 | 1:20000 |
Pewamo mucky clay loam, 0 to 3 percent slopes | PdA | 6 | 2508718 | 6b6b | mi161 | 1974 | 1:20000 |
Pewamo loam | Pe | 17117 | 3015060 | 6bkv | mi163 | 1974 | 1:12000 |
Selfridge-Pewamo complex, 0 to 2 percent slopes | SfA | 4758 | 3015062 | 6bkx | mi163 | 1974 | 1:12000 |
Blount-Pewamo loams, 0 to 2 percent slopes | BcA | 2286 | 3015035 | 6bk0 | mi163 | 1974 | 1:12000 |
Selfridge-Pewamo-Metea complex, 0 to 4 percent slopes | SgB | 2190 | 3015063 | 6bky | mi163 | 1974 | 1:12000 |
Pewamo clay loam | Pf | 1712 | 3015094 | 68tr | mi163 | 1974 | 1:12000 |
Metamora-Pewamo complex, 0 to 3 percent slopes | MfA | 1447 | 3015051 | 6bkk | mi163 | 1974 | 1:12000 |
Selfridge-Pewamo complex, 0 to 3 percent slopes | SdA | 443 | 3015096 | 68tp | mi163 | 1974 | 1:12000 |
Pewamo clay loam, dense substratum, 0 to 1 percent slopes | PwmaaA | 14 | 3015106 | 2qz3f | mi163 | 1974 | 1:12000 |
Pewamo silty clay loam, 0 to 1 percent slopes | PmA | 65042 | 171840 | 2t6lv | oh003 | 1998 | 1:12000 |
Pewamo-Urban land complex, 0 to 2 percent slopes | PoA | 1002 | 171842 | 2t6ly | oh003 | 1998 | 1:12000 |
Pewamo silty clay loam, low carbonate till, 0 to 2 percent slopes | Pc | 717 | 288186 | 2t6m4 | oh005 | 1976 | 1:15840 |
Pewamo silty clay loam, 0 to 1 percent slopes | Pt | 55268 | 817831 | 2t6lv | oh011 | 1979 | 1:15840 |
Pewamo silt loam, overwash | Po | 543 | 169697 | 5pl3 | oh011 | 1979 | 1:15840 |
Pewamo-Urban land complex, 0 to 1 percent slopes | PuA | 253 | 3216888 | 2yc2y | oh011 | 1979 | 1:15840 |
Urban land-Pewamo complex, 0 to 1 percent slopes | UpA | 190 | 3216900 | 2yc4t | oh011 | 1979 | 1:15840 |
Pewamo silty clay loam, low carbonate till, 0 to 2 percent slopes | Pm | 24143 | 168588 | 2t6m4 | oh033 | 1975 | 1:15840 |
Pewamo silty clay loam, 0 to 1 percent slopes | Pe | 30658 | 168524 | 2t6lv | oh037 | 1984 | 1:15840 |
Pewamo silty clay loam, 0 to 1 percent slopes | Pm | 4258 | 168463 | 2t6lv | oh039 | 1981 | 1:15840 |
Pewamo silty clay loam, 0 to 1 percent slopes | PwA | 62603 | 172077 | 2t6lv | oh041 | 1997 | 1:12000 |
Pewamo silty clay loam, 0 to 1 percent slopes | PcA | 12606 | 172171 | 5s4x | oh043 | 1998 | 1:12000 |
Pewamo silty clay loam, low carbonate till, 0 to 2 percent slopes | Pe | 9510 | 172298 | 2t6m4 | oh045 | 1998 | 1:12000 |
Pewamo silty clay loam, low carbonate till, 0 to 2 percent slopes | Pm | 8943 | 167928 | 2t6m4 | oh049 | 1977 | 1:15840 |
Pewamo low carbonate till-Urban land complex, 0 to 2 percent slopes | Pn | 2133 | 167929 | 2t6m7 | oh049 | 1977 | 1:15840 |
Pewamo clay loam | Pm | 9297 | 169105 | 5nz0 | oh051 | 1981 | 1:15840 |
Pewamo silty clay loam, 0 to 1 percent slopes | PmA | 83197 | 644439 | 2t6lv | oh063 | 1997 | 1:12000 |
Pewamo-Urban land complex, 0 to 2 percent slopes | PnA | 743 | 644440 | 2t6ly | oh063 | 1997 | 1:12000 |
Pewamo silty clay loam, 0 to 1 percent slopes | PkA | 78114 | 1611198 | 2t6lv | oh065 | 1987 | 1:15840 |
Pewamo-Urban land complex, 0 to 1 percent slopes | PuA | 52 | 3216909 | 2yc2y | oh065 | 1987 | 1:15840 |
Urban land-Pewamo complex, 0 to 1 percent slopes | UpA | 50 | 3216916 | 2yc4t | oh065 | 1987 | 1:15840 |
Pewamo silty clay loam | Pm | 12662 | 167993 | 5mt4 | oh077 | 1988 | 1:15840 |
Pewamo silty clay loam, 0 to 1 percent slopes | PkA | 1076 | 1605984 | 2t6lv | oh077 | 1988 | 1:15840 |
Pewamo silty clay loam, low carbonate till, 0 to 2 percent slopes | Pc | 6968 | 613758 | 2t6m4 | oh083 | 1983 | 1:15840 |
Pewamo silt loam, low carbonate till, overwash, 0 to 2 percent slopes | Pb | 2 | 1593077 | 2t6m8 | oh083 | 1983 | 1:15840 |
Pewamo silty clay loam, low carbonate till, 0 to 2 percent slopes | Pe | 31330 | 171069 | 2t6m4 | oh089 | 1986 | 1:15840 |
Pewamo low carbonate till-Urban land complex, 0 to 2 percent slopes | Pf | 350 | 171070 | 2t6m7 | oh089 | 1986 | 1:15840 |
Pewamo silty clay loam, 0 to 1 percent slopes | Pe | 8782 | 171157 | 2t6lv | oh091 | 1977 | 1:15840 |
Pewamo silty clay loam, 0 to 1 percent slopes | Pk | 51117 | 2903469 | 2t6lv | oh101 | 1984 | 1:15840 |
Urban land-Typic Endoaquents-Pewamo complex, 0 to 3 percent slopes | UTWXA | 1272 | 2569805 | 2qhvg | oh101 | 1984 | 1:15840 |
Pewamo silty clay loam, 0 to 1 percent slopes | Pm | 83424 | 169951 | 2t6lv | oh107 | 1975 | 1:15840 |
Pewamo silty clay loam, ponded | Pn | 436 | 169952 | 5pvb | oh107 | 1975 | 1:15840 |
Pewamo silty clay, 0 to 2 percent slopes | Po | 427 | 169953 | 2t6m0 | oh107 | 1975 | 1:15840 |
Pewamo-Urban land complex, 0 to 1 percent slopes | PuA | 275 | 3216920 | 2yc2y | oh107 | 1975 | 1:15840 |
Urban land-Pewamo complex, 0 to 1 percent slopes | UpA | 172 | 3216926 | 2yc4t | oh107 | 1975 | 1:15840 |
Pewamo silty clay loam, 0 to 1 percent slopes | Pe | 1350 | 169530 | 2t6lv | oh109 | 1973 | 1:15840 |
Pewamo silty clay loam, 0 to 1 percent slopes | Pm | 20126 | 170364 | 2t6lv | oh117 | 1986 | 1:15840 |
Pewamo silt loam, low carbonate till, overwash, 0 to 2 percent slopes | Pk | 2 | 1593250 | 2t6m8 | oh117 | 1986 | 1:15840 |
Pewamo silty clay loam | Pm | 541 | 537576 | l1d5 | oh127 | 1984 | 1:15840 |
Pewamo silty clay loam, 0 to 1 percent slopes | Pm | 4470 | 2903470 | 2t6lv | oh137 | 1971 | 1:20000 |
Pewamo silty clay loam, low carbonate till, 0 to 2 percent slopes | Pm | 13883 | 170789 | 2t6m4 | oh139 | 1971 | 1:15840 |
Pewamo silt loam | Pa | 809 | 170787 | 5qq8 | oh139 | 1971 | 1:15840 |
Pewamo silt loam, low carbonate till, overwash, 0 to 2 percent slopes | Pc | 364 | 170788 | 2t6m8 | oh139 | 1971 | 1:15840 |
Pewamo silty clay loam, 0 to 1 percent slopes | Pe | 461 | 169576 | 2t6lv | oh143 | 1983 | 1:15840 |
Pewamo silty clay loam, 0 to 1 percent slopes | Pm | 2002 | 2903471 | 2t6lv | oh147 | 1978 | 1:15840 |
Pewamo-Urban land complex, 0 to 2 percent slopes | PoA | 409 | 1592178 | 2t6ly | oh147 | 1978 | 1:15840 |
Pewamo silty clay loam, 0 to 1 percent slopes | Pe | 42814 | 170062 | 2t6lv | oh149 | 1977 | 1:15840 |
Pewamo silt loam | Pd | 954 | 170061 | 5pyv | oh149 | 1977 | 1:15840 |
Urban land-Pewamo complex, 0 to 1 percent slopes | UpA | 106 | 3216967 | 2yc4t | oh149 | 1977 | 1:15840 |
Pewamo-Urban land complex, 0 to 1 percent slopes | PuA | 67 | 3216953 | 2yc2y | oh149 | 1977 | 1:15840 |
Pewamo-Urban land complex | PtA | 8 | 3216952 | 2z6c0 | oh149 | 1977 | 1:15840 |
Pewamo silty clay loam, 0 to 1 percent slopes | Pk | 23685 | 2903472 | 2t6lv | oh159 | 1970 | 1:15840 |
Pewamo-Urban land complex, 0 to 1 percent slopes | PuA | 388 | 3216984 | 2yc2y | oh159 | 1970 | 1:15840 |
Urban land-Pewamo complex, 0 to 1 percent slopes | UpA | 250 | 3217000 | 2yc4t | oh159 | 1970 | 1:15840 |
Pewamo silty clay loam, 0 to 1 percent slopes | Pk | 76457 | 2903473 | 2t6lv | oh161 | 1967 | 1:15840 |
Pewamo silty clay, 0 to 2 percent slopes | Po | 1034 | 168113 | 2t6m0 | oh161 | 1967 | 1:15840 |
Pewamo silty clay loam, 0 to 1 percent slopes | Pm | 21018 | 168187 | 2t6lv | oh171 | 1975 | 1:15840 |
Pewamo clay loam, 0 to 2 percent slopes | Pk | 314 | 1414128 | 2t6lz | oh171 | 1975 | 1:15840 |
Pewamo silty clay loam, 0 to 1 percent slopes | PkA | 29432 | 2903474 | 2t6lv | oh175 | 1980 | 1:15840 |


