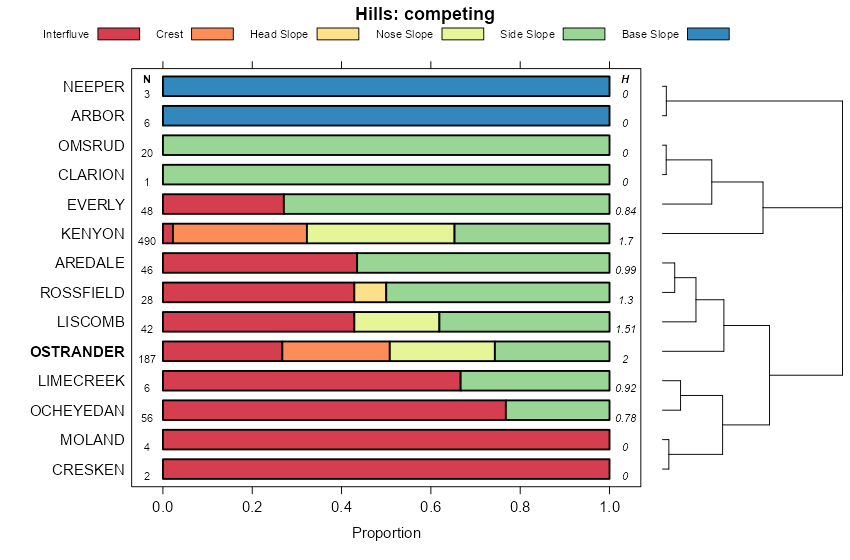
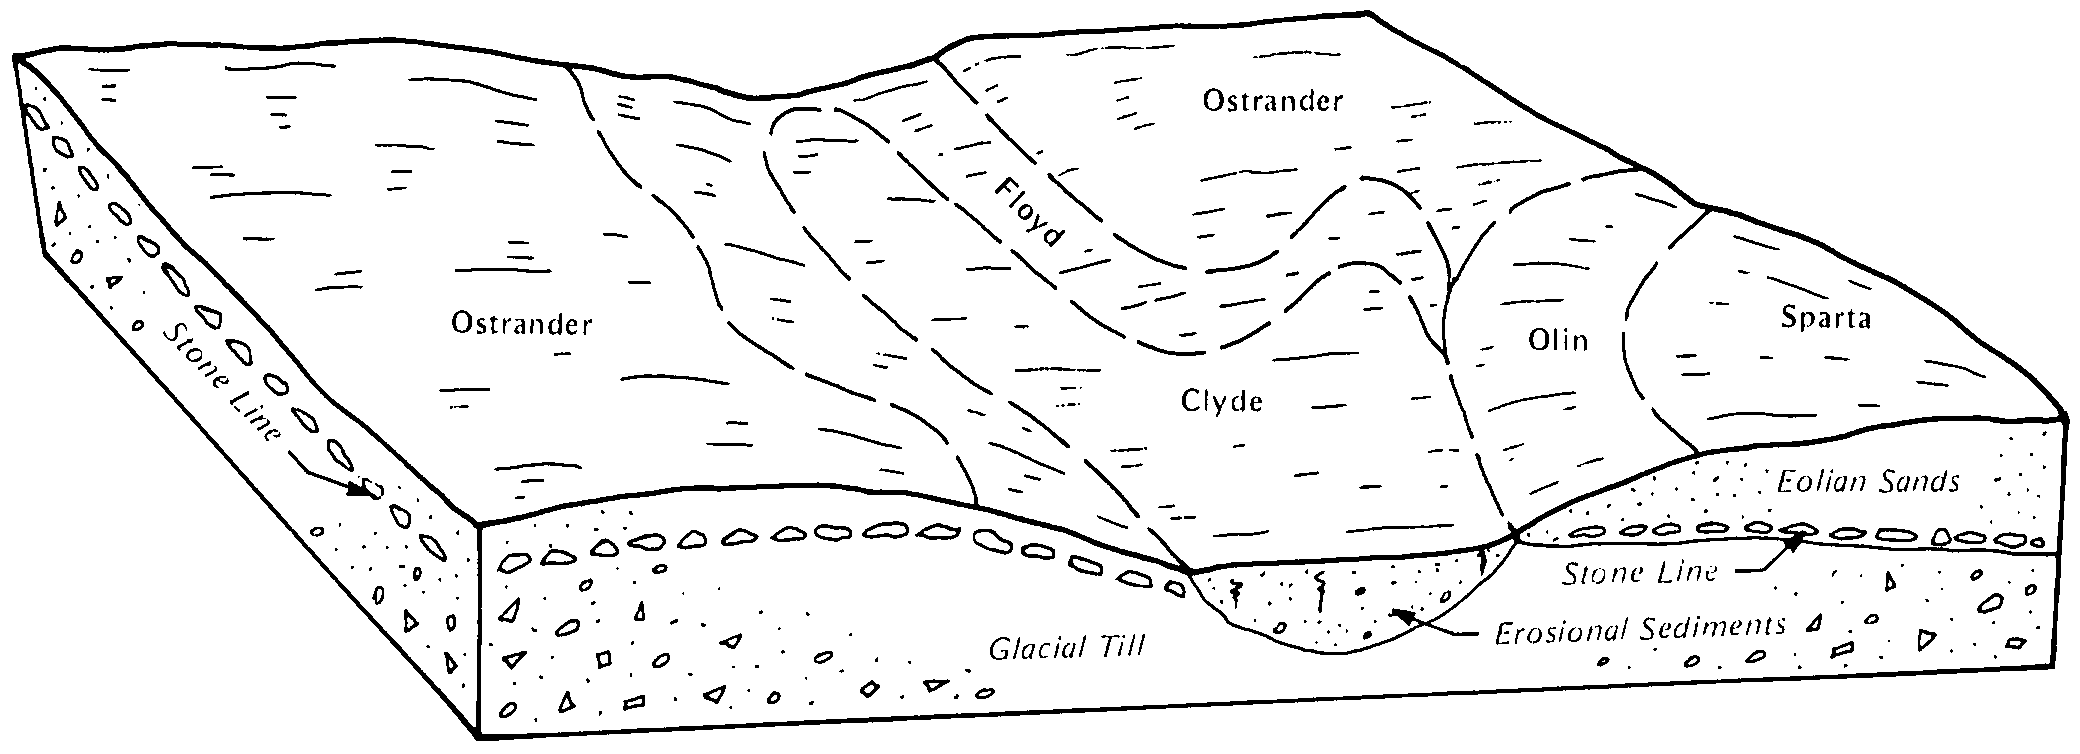
| Ostrander loam, 2 to 5 percent slopes | 394B | 4195 | 1689580 | 2wm7c | ia017 | 2008 | 1:12000 |
Ostrander loam, 5 to 9 percent slopes | 394C | 1196 | 1689588 | 2wm7d | ia017 | 2008 | 1:12000 |
Ostrander loam, 2 to 5 percent slopes | 394B | 8611 | 403398 | 2wm7c | ia023 | 1978 | 1:15840 |
Ostrander loam, 5 to 9 percent slopes, eroded | 394C2 | 2806 | 403400 | 2wm7f | ia023 | 1978 | 1:15840 |
Ostrander loam, 0 to 2 percent slopes | 394 | 1525 | 403397 | 2wm7b | ia023 | 1978 | 1:15840 |
Ostrander loam, 5 to 9 percent slopes | 394C | 491 | 403399 | 2wm7d | ia023 | 1978 | 1:15840 |
Ostrander loam, 0 to 2 percent slopes | 394 | 4 | 2474590 | 2wm7b | ia033 | 1978 | 1:15840 |
Ostrander loam, 2 to 5 percent slopes | 394B | 9517 | 404028 | 2wm7c | ia037 | 1989 | 1:15840 |
Ostrander loam, 5 to 9 percent slopes, eroded | 394C2 | 1735 | 404030 | 2wm7f | ia037 | 1989 | 1:15840 |
Ostrander loam, 5 to 9 percent slopes | 394C | 1157 | 404029 | 2wm7d | ia037 | 1989 | 1:15840 |
Ostrander loam, 2 to 5 percent slopes | 394B | 1919 | 405419 | 2wm7c | ia061 | 1983 | 1:15840 |
Ostrander loam, 5 to 9 percent slopes | 394C | 583 | 405420 | 2wm7d | ia061 | 1983 | 1:15840 |
Ostrander loam, 2 to 5 percent slopes | 394B | 4416 | 405762 | 2wm7c | ia065 | 1975 | 1:15840 |
Ostrander loam, 5 to 9 percent slopes | 394C | 792 | 405763 | 2wm7d | ia065 | 1975 | 1:15840 |
Ostrander loam, 5 to 9 percent slopes, eroded | 394C2 | 279 | 405764 | 2wm7f | ia065 | 1975 | 1:15840 |
Ostrander loam, 2 to 5 percent slopes | 394B | 11929 | 405914 | 2wm7c | ia067 | 1989 | 1:15840 |
Ostrander loam, 0 to 2 percent slopes | 394 | 5226 | 405913 | 2wm7b | ia067 | 1989 | 1:15840 |
Ostrander loam, 5 to 9 percent slopes | 394C | 759 | 405915 | 2wm7d | ia067 | 1989 | 1:15840 |
Ostrander loam, 5 to 9 percent slopes, eroded | 394C2 | 363 | 405916 | 2wm7f | ia067 | 1989 | 1:15840 |
Ostrander loam, 0 to 2 percent slopes | 394 | 22 | 2474751 | 2wm7b | ia069 | 1977 | 1:15840 |
Ostrander loam, 2 to 5 percent slopes | 394B | 6 | 2474752 | 2wm7c | ia069 | 1977 | 1:15840 |
Ostrander loam, 2 to 5 percent slopes | 394B | 2820 | 406303 | 2wm7c | ia075 | 1973 | 1:15840 |
Ostrander loam, 5 to 9 percent slopes, eroded | 394C2 | 1077 | 406305 | 2wm7f | ia075 | 1973 | 1:15840 |
Ostrander loam, 5 to 9 percent slopes | 394C | 667 | 406304 | 2wm7d | ia075 | 1973 | 1:15840 |
Ostrander loam, 2 to 5 percent slopes | 394B | 9635 | 406944 | 2wm7c | ia089 | 1969 | 1:15840 |
Ostrander loam, 0 to 2 percent slopes | 394A | 1015 | 406943 | 2wm7b | ia089 | 1969 | 1:15840 |
Ostrander loam, 5 to 9 percent slopes | 394C | 396 | 406945 | 2wm7d | ia089 | 1969 | 1:15840 |
Dickinson-Ostrander complex, 2 to 5 percent slopes | 575B | 359 | 406967 | 2vw5c | ia089 | 1969 | 1:15840 |
Ostrander loam, 5 to 9 percent slopes, eroded | 394C2 | 265 | 406946 | 2wm7f | ia089 | 1969 | 1:15840 |
Ostrander loam, 2 to 5 percent slopes | 394B | 5619 | 408151 | 2wm7c | ia105 | 1988 | 1:15840 |
Ostrander loam, 5 to 9 percent slopes | 394C | 1624 | 408152 | 2wm7d | ia105 | 1988 | 1:15840 |
Ostrander loam, 2 to 5 percent slopes | 394B | 10221 | 2606436 | 2qcs4 | ia113 | 1970 | 1:15840 |
Ostrander loam, 5 to 9 percent slopes | 394C | 2384 | 2606437 | 2qcs5 | ia113 | 1970 | 1:15840 |
Ostrander loam, 0 to 2 percent slopes | 394 | 450 | 2606435 | 2qcs3 | ia113 | 1970 | 1:15840 |
Ostrander loam, 0 to 2 percent slopes | 394 | 3525 | 409669 | 2wm7b | ia131 | 1971 | 1:15840 |
Ostrander loam, 2 to 5 percent slopes | 394B | 3170 | 409670 | 2wm7c | ia131 | 1971 | 1:15840 |
Dickinson-Ostrander complex, 2 to 5 percent slopes | 575B | 1741 | 409687 | 2vw5c | ia131 | 1971 | 1:15840 |
Dickinson-Ostrander complex, 0 to 2 percent slopes | 575 | 414 | 409686 | 2vw5b | ia131 | 1971 | 1:15840 |
Ostrander silt loam, 2 to 5 percent slopes | 394B | 2539 | 451009 | 2wm7h | ia191 | 2005 | 1:12000 |
Ostrander silt loam, 5 to 9 percent slopes | 394C | 280 | 451010 | 2wm7j | ia191 | 2005 | 1:12000 |
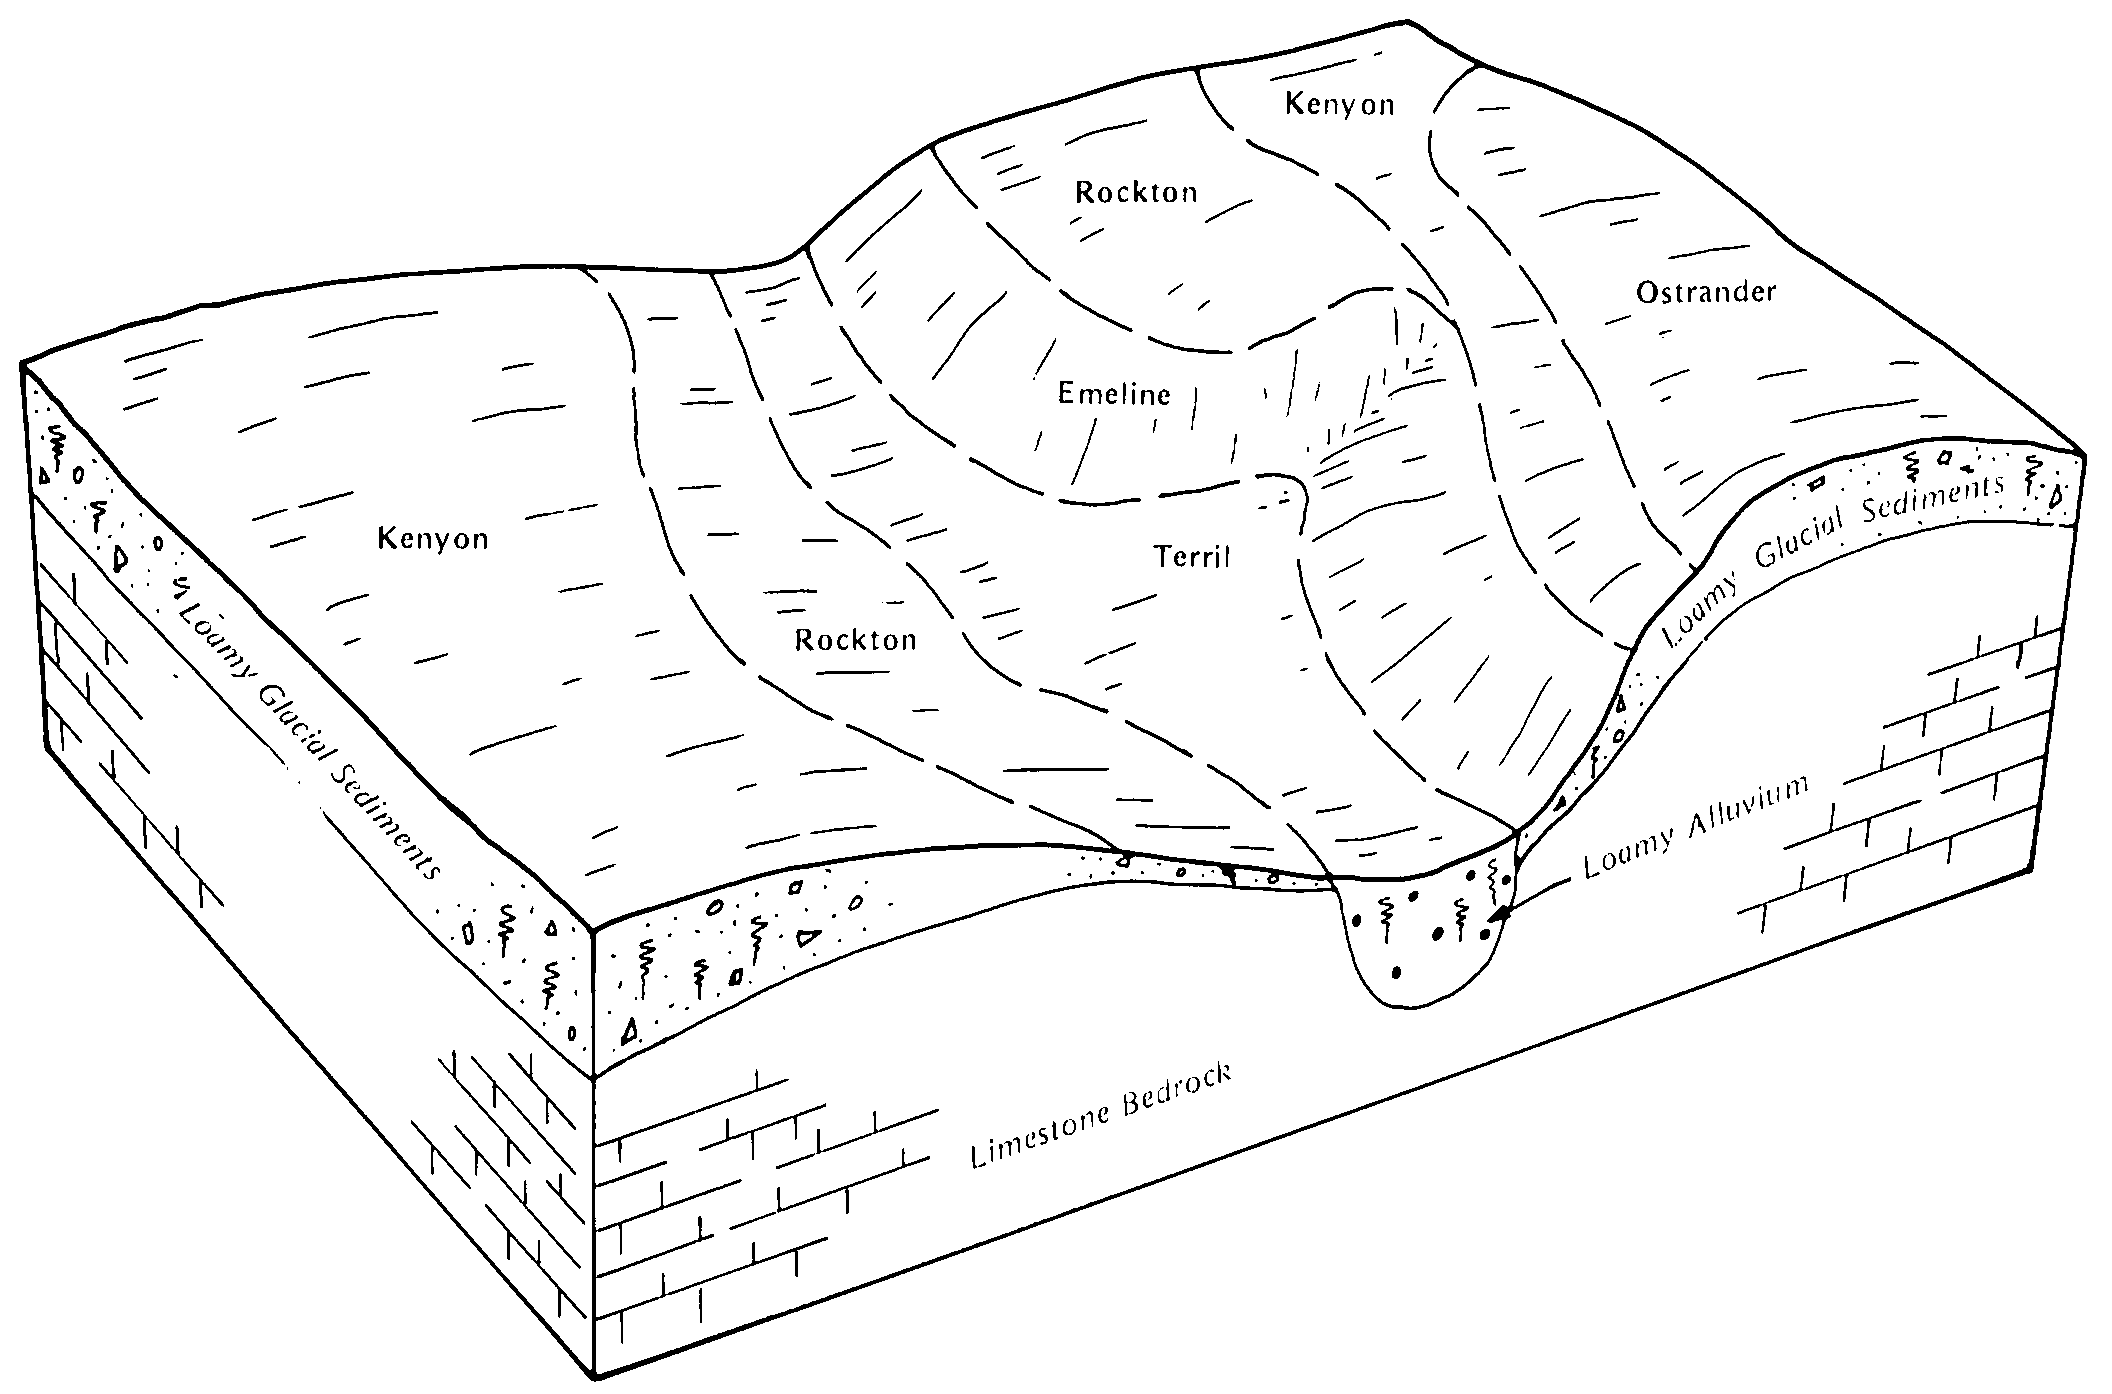
Ostrander loam, 1 to 6 percent slopes | 2B | 15550 | 396830 | f9xz | mn037 | 1980 | 1:15840 |
Ostrander loam, 6 to 12 percent slopes | 2C | 4246 | 396831 | f9y0 | mn037 | 1980 | 1:15840 |
Ostrander-Carmi loams, 2 to 6 percent slopes | 1896B | 2543 | 396803 | f9x3 | mn037 | 1980 | 1:15840 |
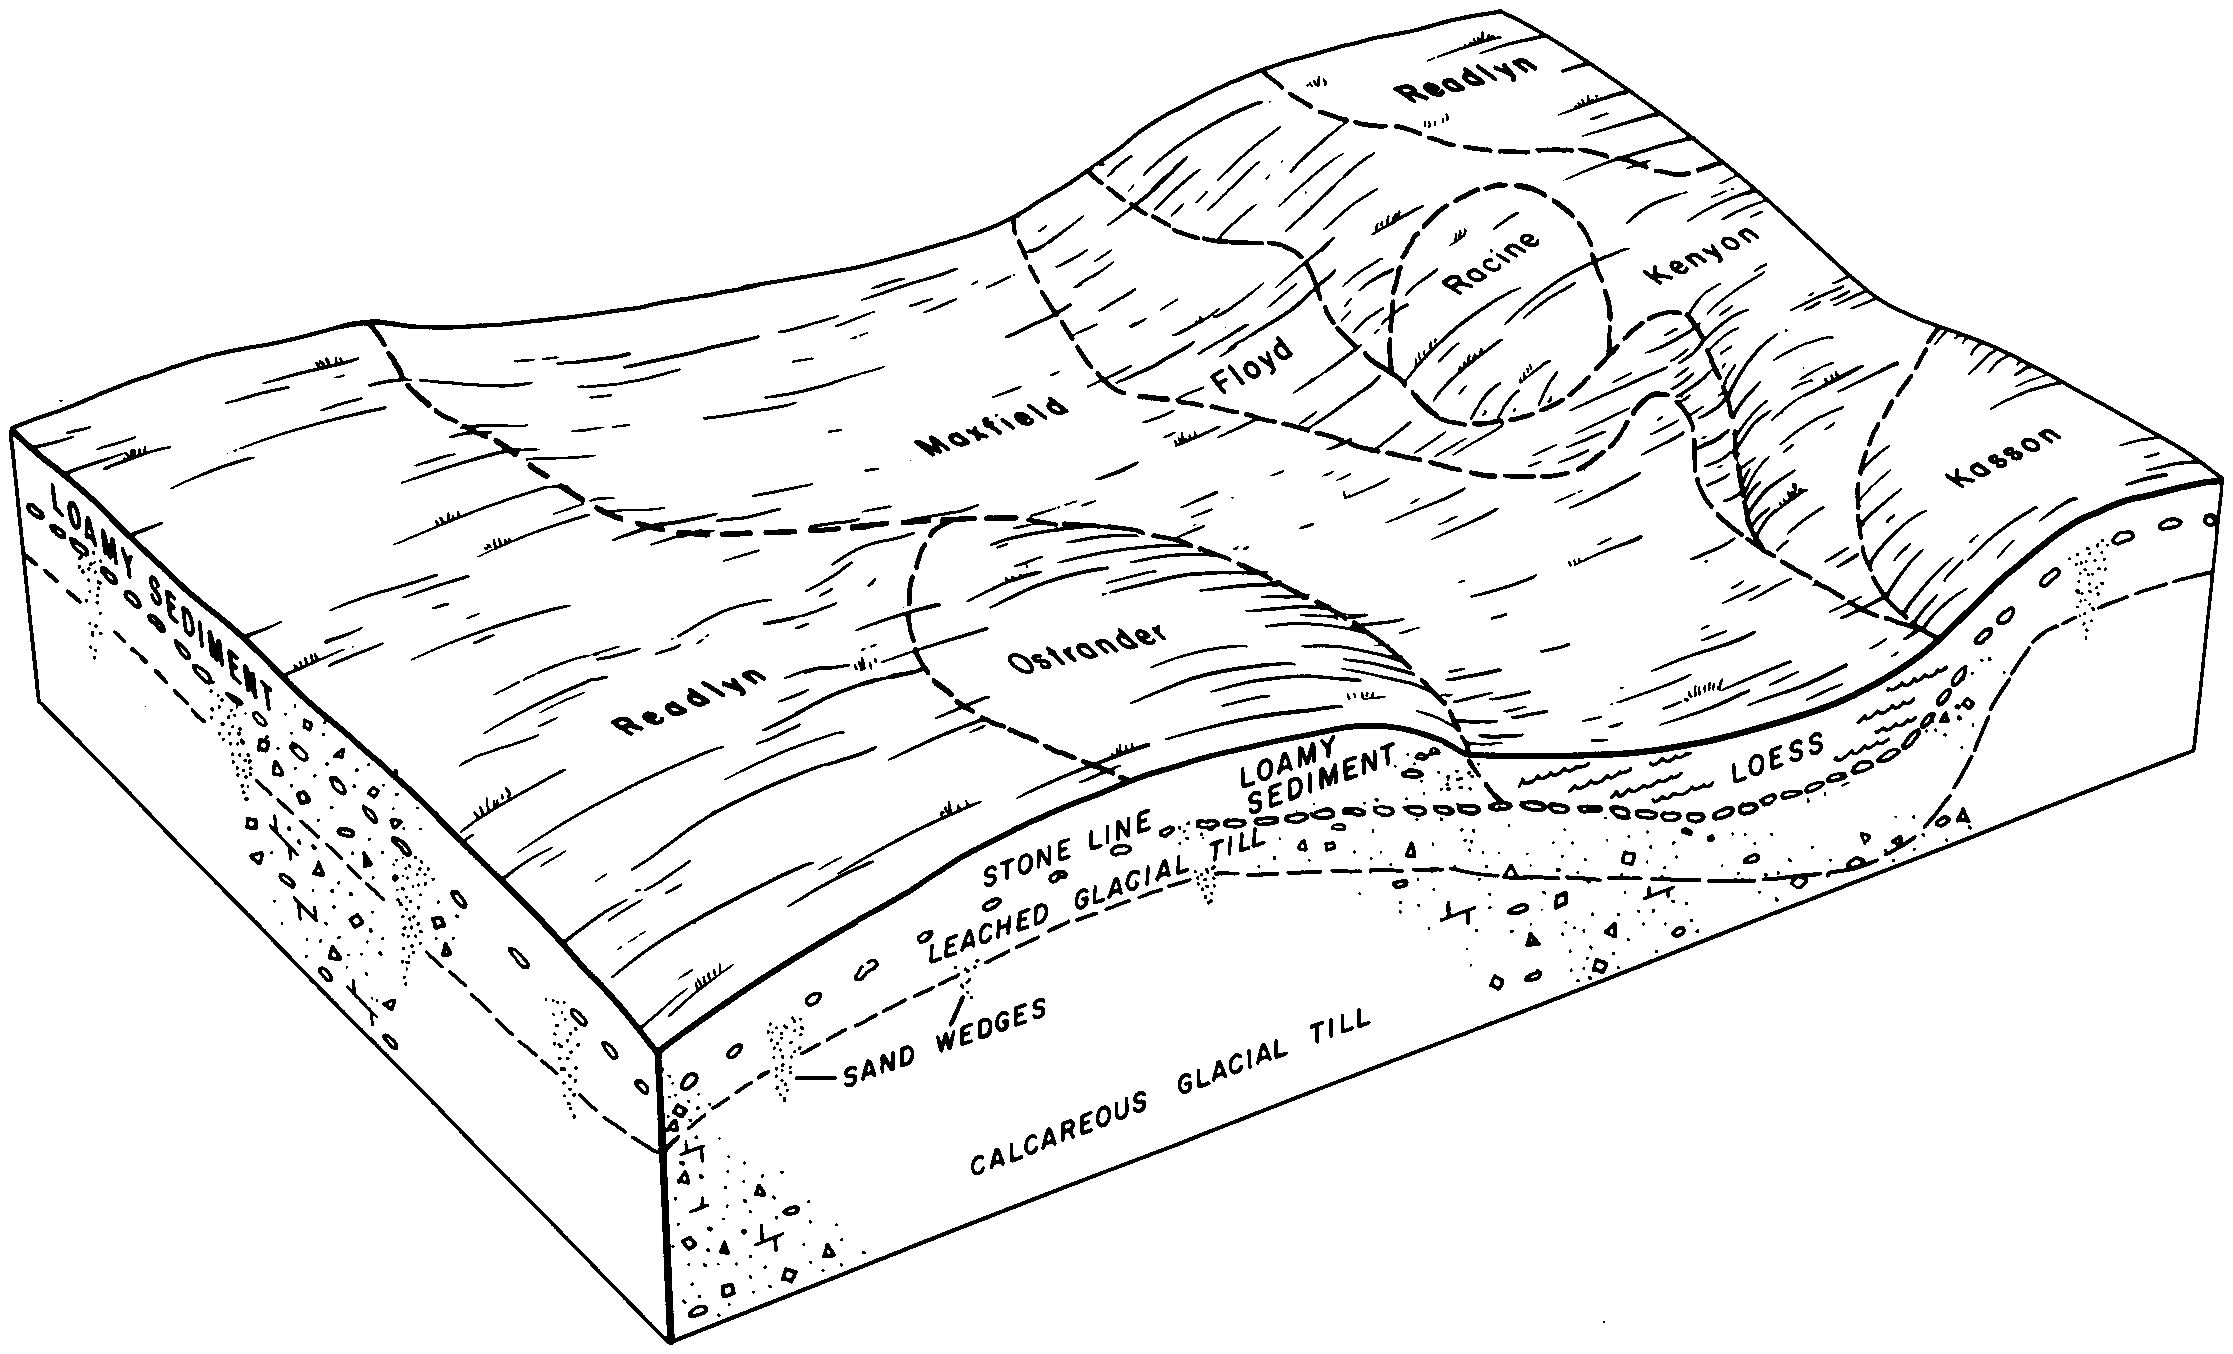
Racine and Ostrander silt loams, 2 to 6 percent slopes | Rb | 16742 | 2216766 | 2yvkb | mn045 | 2008 | 1:12000 |
Racine and Ostrander silt loams, 0 to 2 percent slopes | Ra | 5443 | 2216765 | 2yvk9 | mn045 | 2008 | 1:12000 |
Racine and Ostrander silt loams, 7 to 11 percent slopes, moderately eroded | Rd | 924 | 2216769 | 2ddqp | mn045 | 2008 | 1:12000 |
Racine and Ostrander loams, 12 to 17 percent slopes, moderately eroded | Re | 155 | 2216767 | 2ddqm | mn045 | 2008 | 1:12000 |
Ostrander loam, 0 to 2 percent slopes | 2A | 3388 | 400448 | 2wm7b | mn099 | 1986 | 1:15840 |
Ostrander loam, 2 to 5 percent slopes | 2B | 3347 | 400449 | 2wm7c | mn099 | 1986 | 1:15840 |
Ostrander silt loam, 0 to 2 percent slopes | 2A | 2522 | 400751 | 2wm7g | mn109 | 1977 | 1:15840 |
Ostrander-Dowagiac loams, 6 to 12 percent slopes | 1832C | 1849 | 400722 | ffzj | mn109 | 1977 | 1:15840 |
Ostrander loam, 2 to 5 percent slopes | 2B | 1606 | 400752 | 2wm7c | mn109 | 1977 | 1:15840 |
Ostrander silt loam, 2 to 6 percent slopes | 2B | 5469 | 1677038 | 1t930 | mn163 | 1978 | 1:15840 |
Ostrander silt loam, 0 to 2 percent slopes | 2 | 1298 | 1677037 | 1t92z | mn163 | 1978 | 1:15840 |
Ostrander silt loam, 6 to 12 percent slopes | 2C | 924 | 1677039 | 1t931 | mn163 | 1978 | 1:15840 |