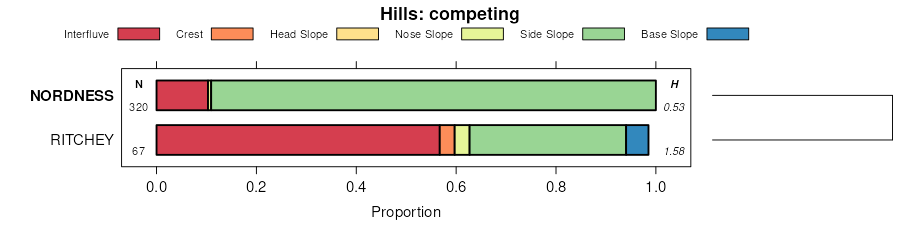
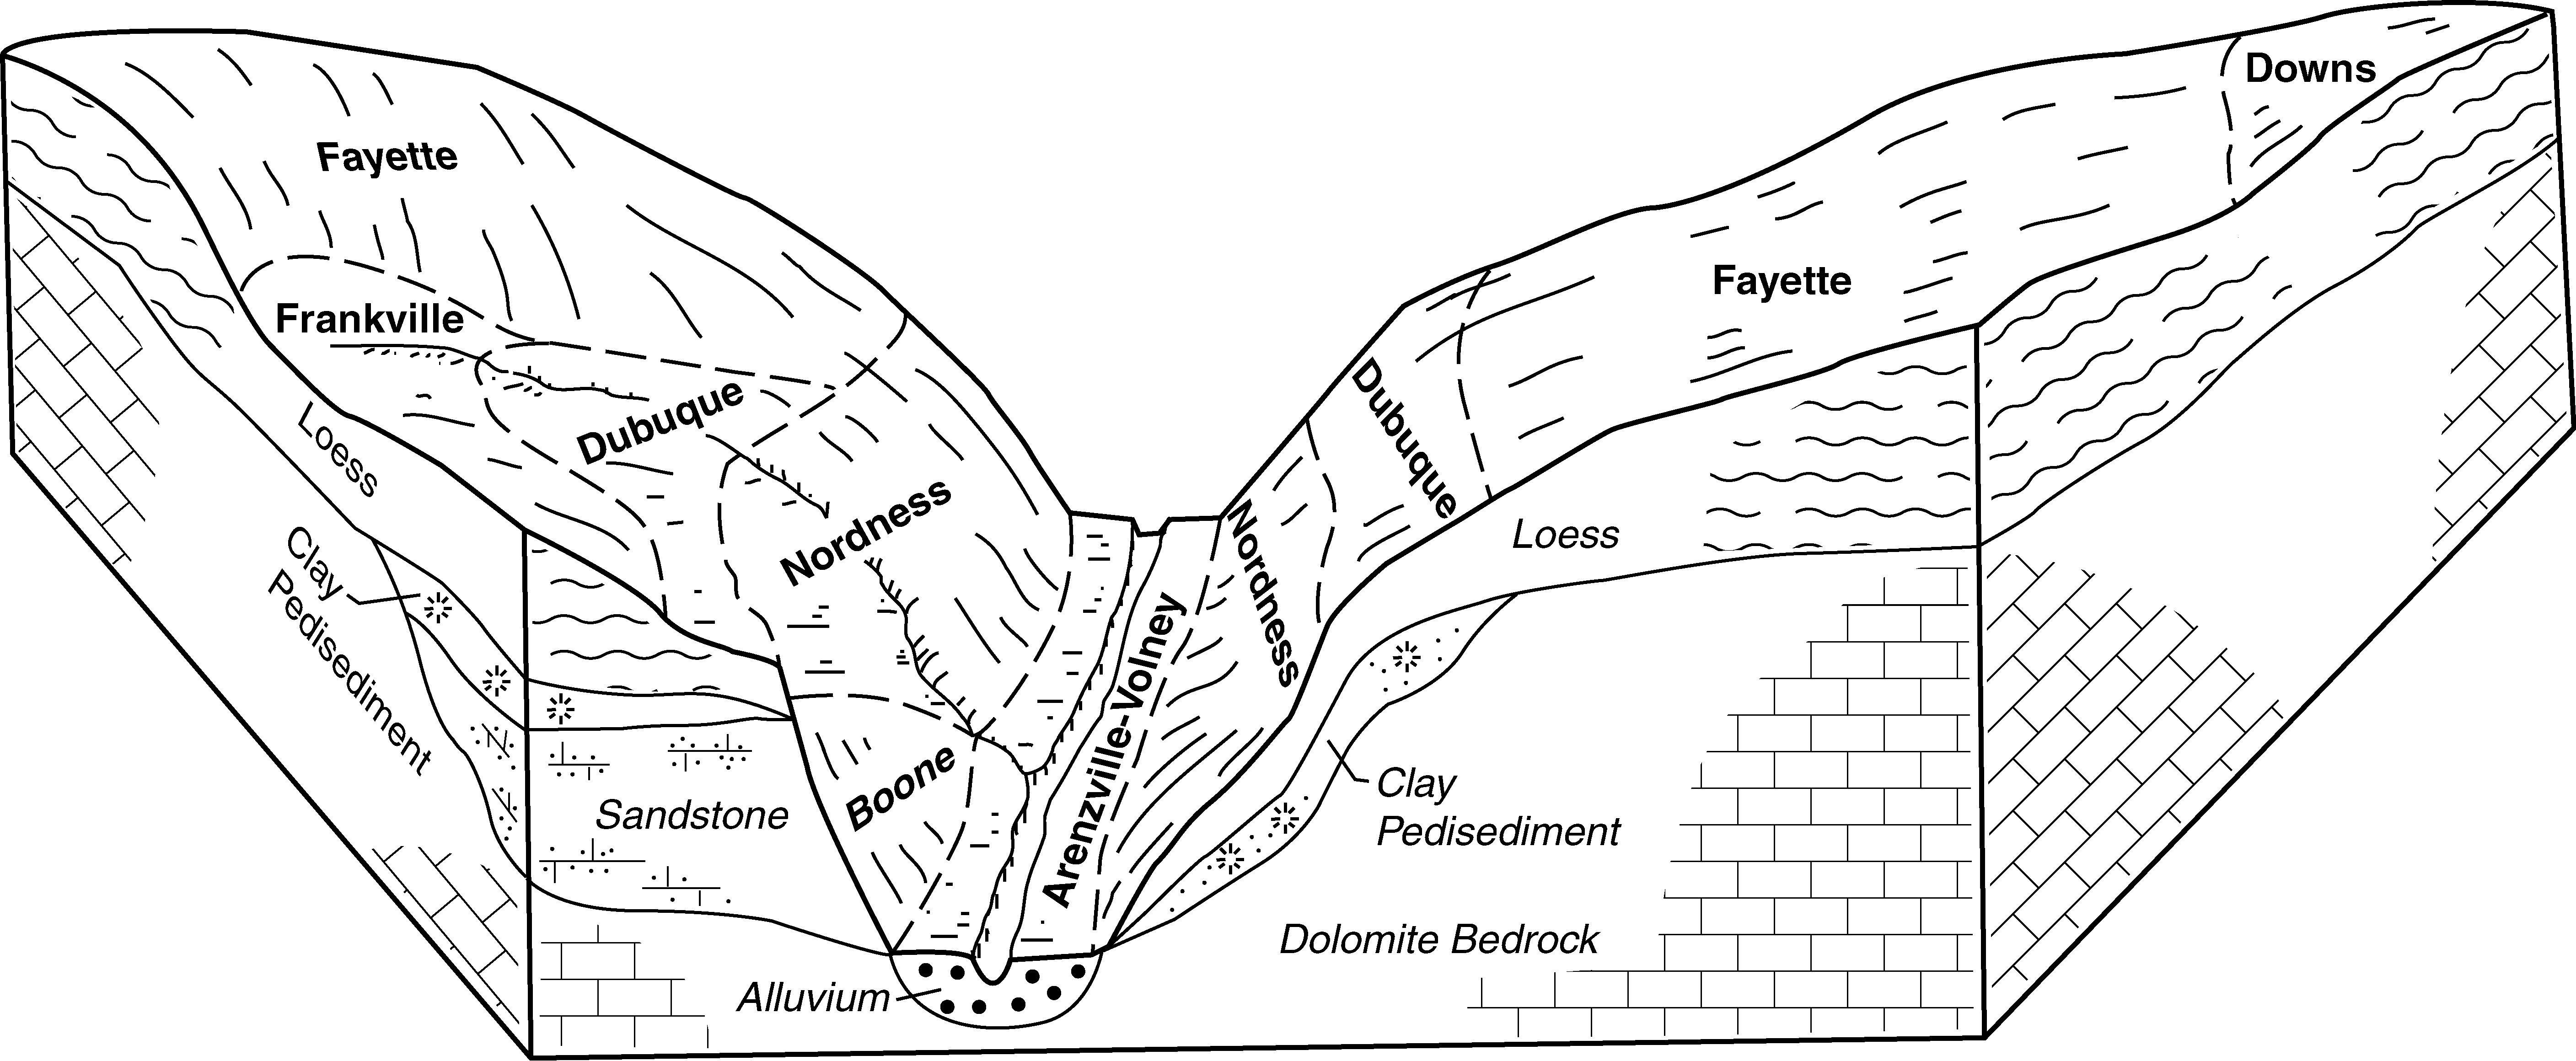
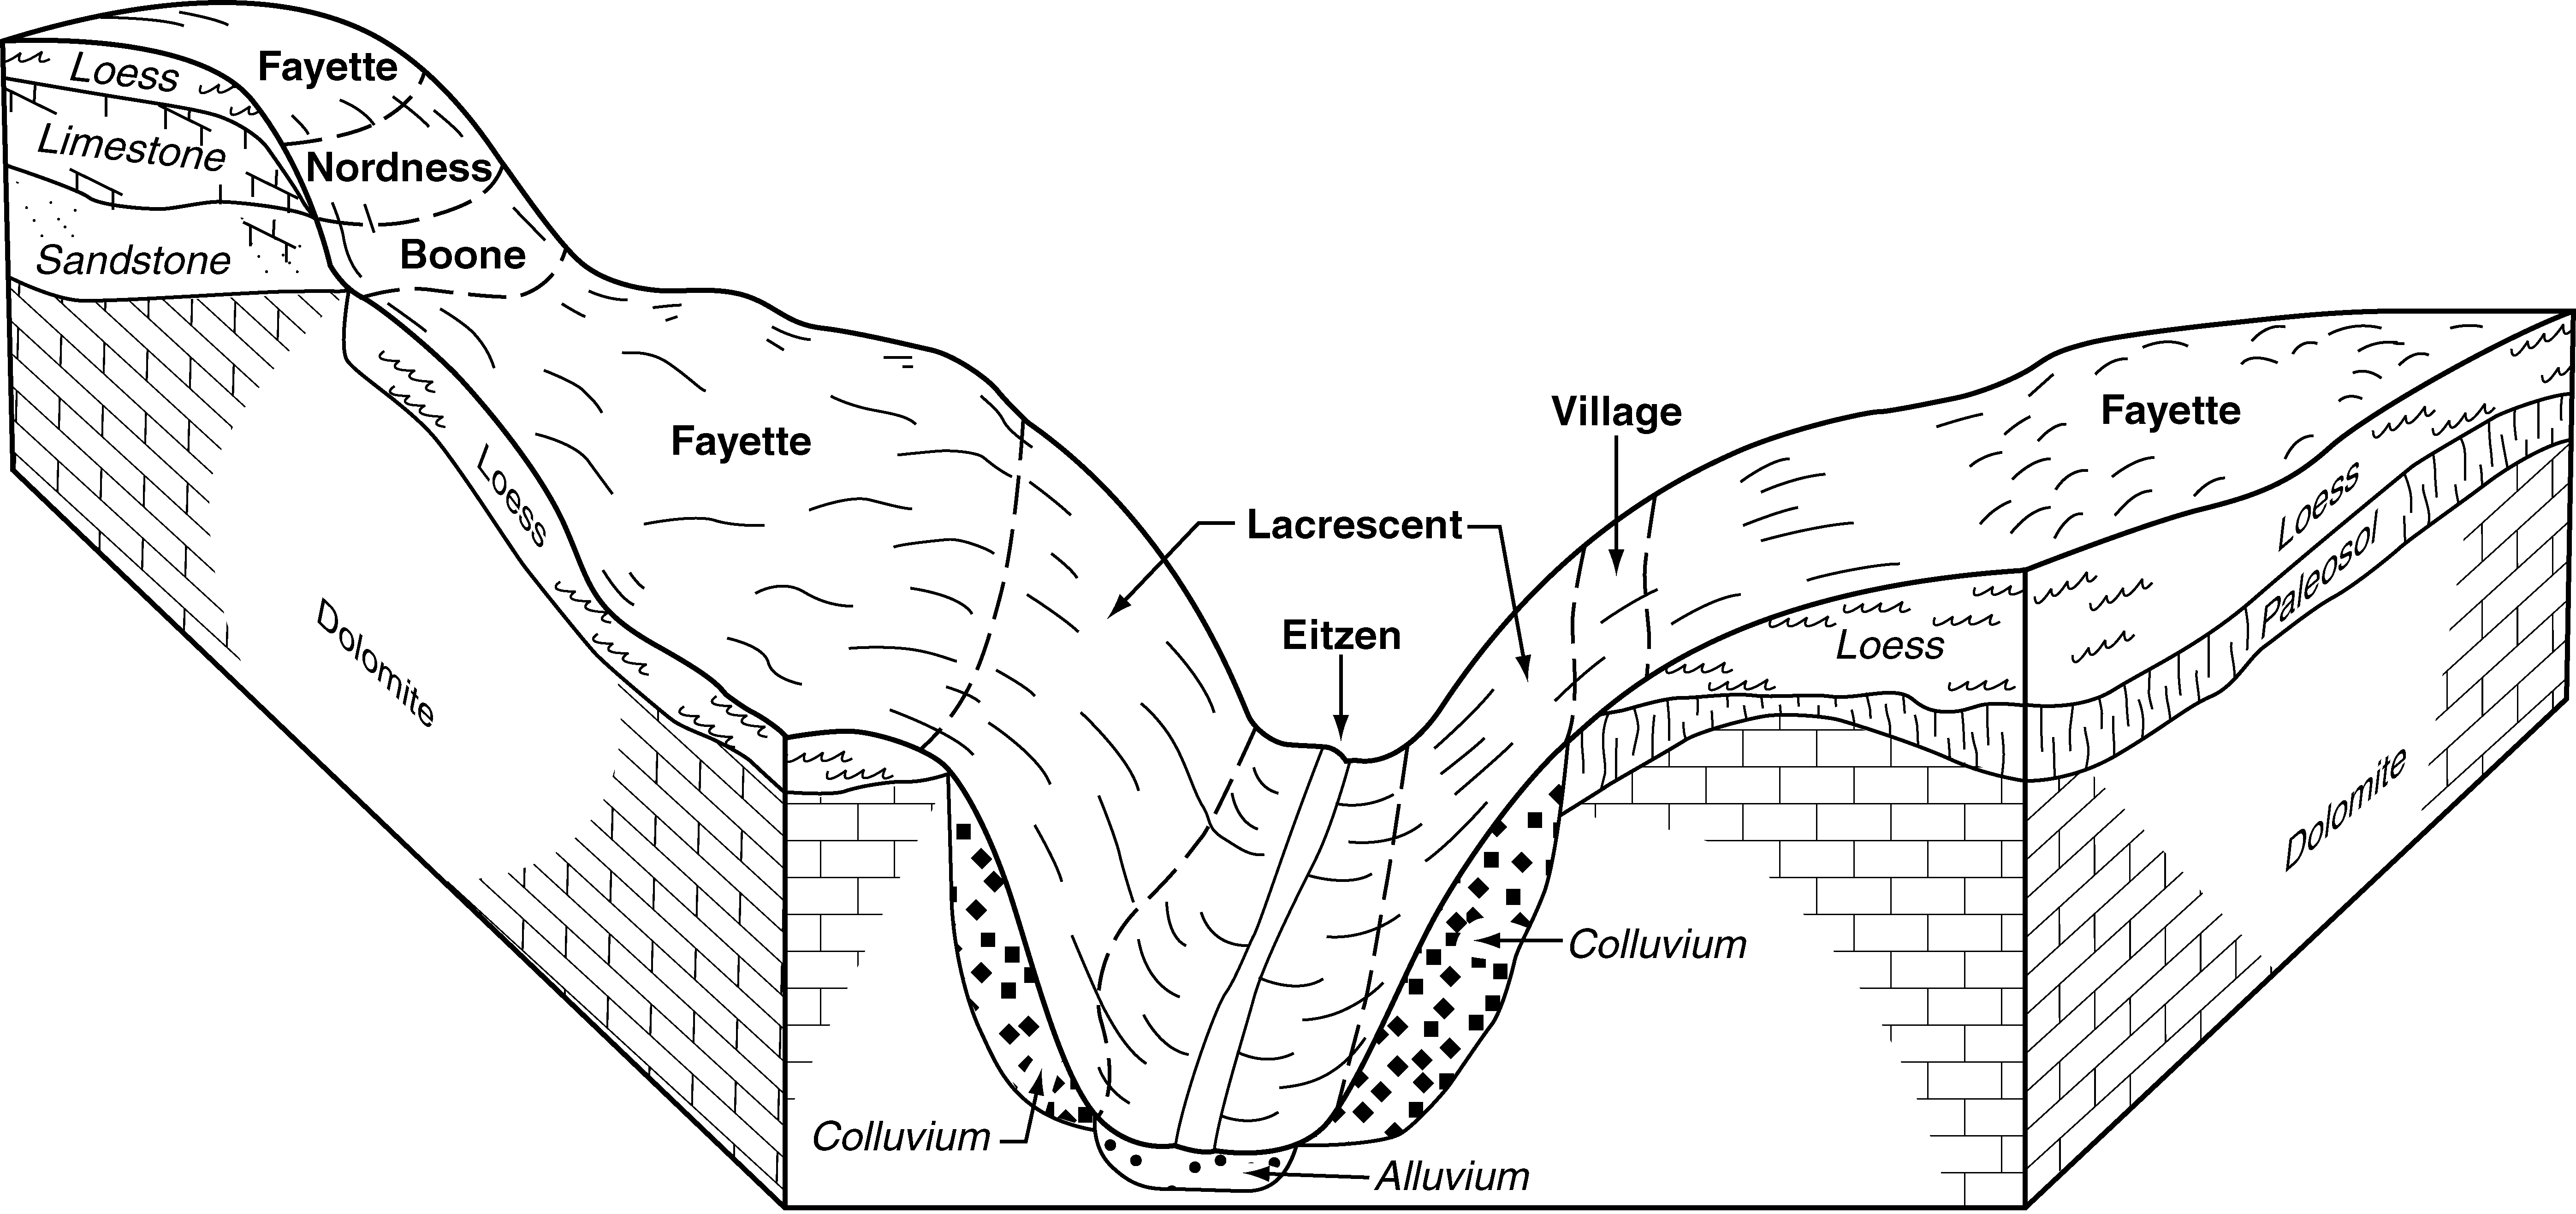
| Nordness silt loam, 25 to 40 percent slopes | 499G | 8699 | 402465 | fhsr | ia005 | 1992 | 1:15840 |
Nordness silt loam, 18 to 25 percent slopes | 499F | 4686 | 402464 | fhsq | ia005 | 1992 | 1:15840 |
Nordness silt loam, 14 to 18 percent slopes | 499E | 2930 | 402462 | fhsn | ia005 | 1992 | 1:15840 |
Nordness-Rock outcrop complex, 25 to 60 percent slopes | 478G | 1118 | 402444 | fhs2 | ia005 | 1992 | 1:15840 |
Nordness silt loam, 9 to 14 percent slopes | 499D | 885 | 402460 | fhsl | ia005 | 1992 | 1:15840 |
Nordness silt loam, 9 to 14 percent slopes, moderately eroded | 499D2 | 706 | 402461 | fhsm | ia005 | 1992 | 1:15840 |
Nordness silt loam, 14 to 18 percent slopes, moderately eroded | 499E2 | 653 | 402463 | fhsp | ia005 | 1992 | 1:15840 |
Nordness silt loam, 5 to 9 percent slopes | 499C | 412 | 402458 | fhsj | ia005 | 1992 | 1:15840 |
Nordness loam, 5 to 14 percent slopes | 499D | 704 | 403245 | fjlx | ia019 | 1978 | 1:15840 |
Nordness loam, 14 to 30 percent slopes | 499F | 504 | 403246 | fjly | ia019 | 1978 | 1:15840 |
Nordness loam, 2 to 5 percent slopes | 499B | 388 | 403244 | fjlw | ia019 | 1978 | 1:15840 |
Nordness silt loam, 5 to 14 percent slopes | 499D | 5 | 2479316 | 2p6xy | ia037 | 1989 | 1:15840 |
Rock outcrop-Nordness complex, 25 to 60 percent slopes | 478G | 37511 | 404267 | fknw | ia043 | 1979 | 1:15840 |
Nordness silt loam, 14 to 25 percent slopes | 499F | 29437 | 404284 | fkpf | ia043 | 1979 | 1:15840 |
Nordness silt loam, 5 to 14 percent slopes | 499D | 2505 | 404283 | fkpd | ia043 | 1979 | 1:15840 |
Nordness silt loam, 2 to 5 percent slopes | 499B | 531 | 404282 | fkpc | ia043 | 1979 | 1:15840 |
Rock outcrop-Nordness complex, 18 to 60 percent slopes | 478G | 3510 | 404434 | fkv8 | ia045 | 1978 | 1:15840 |
Nordness silt loam, 14 to 25 percent slopes | 499F | 2068 | 404436 | fkvb | ia045 | 1978 | 1:15840 |
Nordness silt loam, 5 to 14 percent slopes | 499D | 501 | 404435 | fkv9 | ia045 | 1978 | 1:15840 |
Nordness silt loam, 5 to 14 percent slopes | 499D | 6625 | 405060 | flhg | ia055 | 1984 | 1:15840 |
Nordness-Rock outcrop complex, 25 to 60 percent slopes | 478G | 4556 | 405054 | flh8 | ia055 | 1984 | 1:15840 |
Nordness silt loam, 14 to 25 percent slopes | 499F | 3682 | 405061 | flhh | ia055 | 1984 | 1:15840 |
Nordness silt loam, 2 to 5 percent slopes | 499B | 496 | 405059 | flhf | ia055 | 1984 | 1:15840 |
Nordness-Rock outcrop complex, 25 to 40 percent slopes | 478G | 838 | 405251 | flpm | ia057 | 1980 | 1:15840 |
Nordness silt loam, 14 to 25 percent slopes | 499F | 504 | 405253 | flpp | ia057 | 1980 | 1:15840 |
Nordness-Rock outcrop complex, 18 to 60 percent slopes | 478G | 21283 | 405434 | flwj | ia061 | 1983 | 1:15840 |
Nordness silt loam, 18 to 35 percent slopes | 499F | 15334 | 405453 | flx4 | ia061 | 1983 | 1:15840 |
Nordness silt loam, 9 to 18 percent slopes | 499D | 5808 | 405452 | flx3 | ia061 | 1983 | 1:15840 |
Rock outcrop-Nordness complex, 25 to 60 percent slopes | 478G | 15441 | 405781 | fm7q | ia065 | 1975 | 1:15840 |
Nordness silt loam, 14 to 25 percent slopes | 499F | 2731 | 405794 | fm84 | ia065 | 1975 | 1:15840 |
Nordness silt loam, 5 to 14 percent slopes | 499D | 1018 | 405793 | fm83 | ia065 | 1975 | 1:15840 |
Nordness silt loam, 2 to 5 percent slopes | 499B | 525 | 405792 | fm82 | ia065 | 1975 | 1:15840 |
Nordness silt loam, 14 to 25 percent slopes | 499F | 1811 | 406866 | fncq | ia087 | 1982 | 1:15840 |
Nordness-Rock outcrop complex, 25 to 40 percent slopes | 478G | 1474 | 406863 | 2wbdm | ia087 | 1982 | 1:15840 |
Nordness silt loam, 9 to 14 percent slopes | 499D | 259 | 406865 | fncp | ia087 | 1982 | 1:15840 |
Nordness-Rock outcrop complex, 18 to 60 percent slopes | 478G | 27394 | 407514 | fp1m | ia097 | 1988 | 1:15840 |
Nordness silt loam, 14 to 35 percent slopes | 499F | 26282 | 407530 | fp24 | ia097 | 1988 | 1:15840 |
Nordness silt loam, 5 to 14 percent slopes | 499D | 3747 | 407529 | fp23 | ia097 | 1988 | 1:15840 |
Nordness silt loam, 25 to 40 percent slopes | 499G | 239 | 407822 | fpck | ia101 | 1992 | 1:15840 |
Nordness-Rock outcrop complex, 18 to 60 percent slopes | 478G | 6281 | 408165 | fpqm | ia105 | 1988 | 1:15840 |
Nordness loam, 14 to 30 percent slopes | 499F | 3032 | 408177 | fpr0 | ia105 | 1988 | 1:15840 |
Nordness loam, 5 to 14 percent slopes | 499D | 1040 | 408176 | fpqz | ia105 | 1988 | 1:15840 |
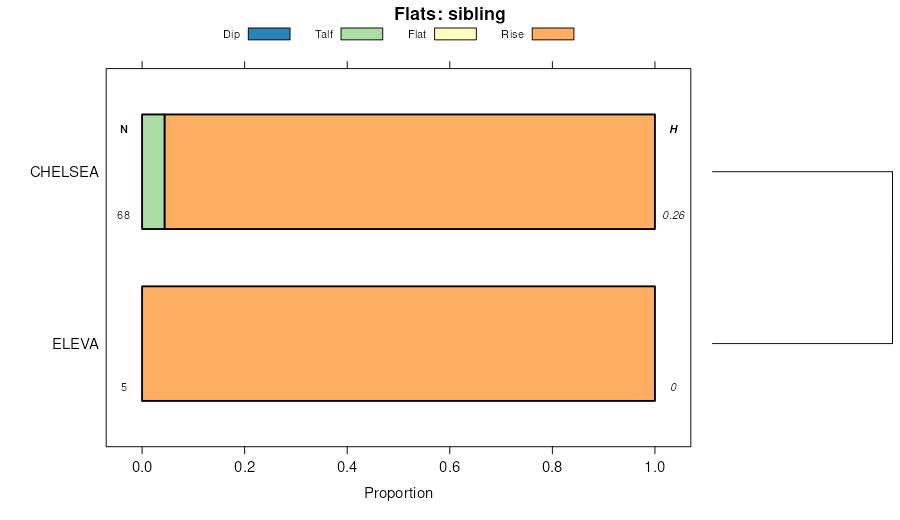
Nordness-Eleva complex, 25 to 40 percent slopes | 999G | 807 | 447261 | h0ds | ia107 | 1998 | 1:12000 |
Nordness-Eleva complex, 18 to 25 percent slopes | 999F | 249 | 447260 | h0dr | ia107 | 1998 | 1:12000 |
Nordness-Rock outcrop complex, 25 to 40 percent slopes | 478G | 1906 | 408473 | 2wbdm | ia111 | 1976 | 1:15840 |
Nordness silt loam, 18 to 30 percent slopes | 499F | 614 | 408477 | fq1p | ia111 | 1976 | 1:15840 |
Nordness silt loam, 9 to 18 percent slopes, moderately eroded | 499D2 | 581 | 408476 | fq1n | ia111 | 1976 | 1:15840 |
Nordness silt loam, 18 to 40 percent slopes | 499G | 621 | 408784 | fqcl | ia115 | 1984 | 1:15840 |
Nordness loam, 15 to 25 percent slopes | 499E | 1751 | 409236 | fqv5 | ia121 | 1968 | 1:15840 |
Nordness silt loam, 18 to 40 percent slopes | 499G | 164 | 411015 | fspk | ia163 | 1989 | 1:15840 |
Nordness-Bentonsport complex, 25 to 40 percent slopes | 699G | 1519 | 413153 | fvxj | ia177 | 1994 | 1:12000 |
Nordness-Munterville complex, 25 to 40 percent slopes | 599G | 792 | 413142 | fvx5 | ia177 | 1994 | 1:12000 |
Nordness silt loam, 14 to 25 percent slopes | 499F | 671 | 412059 | fts7 | ia183 | 1983 | 1:15840 |
Nordness silt loam, 14 to 40 percent slopes | 499G | 6314 | 1401624 | 1j1hp | ia191 | 2005 | 1:12000 |
Nordness silt loam, 5 to 14 percent slopes | 499D | 1946 | 450998 | h49b | ia191 | 2005 | 1:12000 |
Nordness silt loam, 6 to 12 percent slopes | N502C | 173 | 2372360 | 2kmmr | mn045 | 2008 | 1:12000 |
Nordness silt loam, 2 to 6 percent slopes | N502B | 89 | 2372358 | 2kmmp | mn045 | 2008 | 1:12000 |
Nordness variant loam, 2 to 6 percent slopes | 633B | 696 | 400476 | ffql | mn099 | 1986 | 1:15840 |