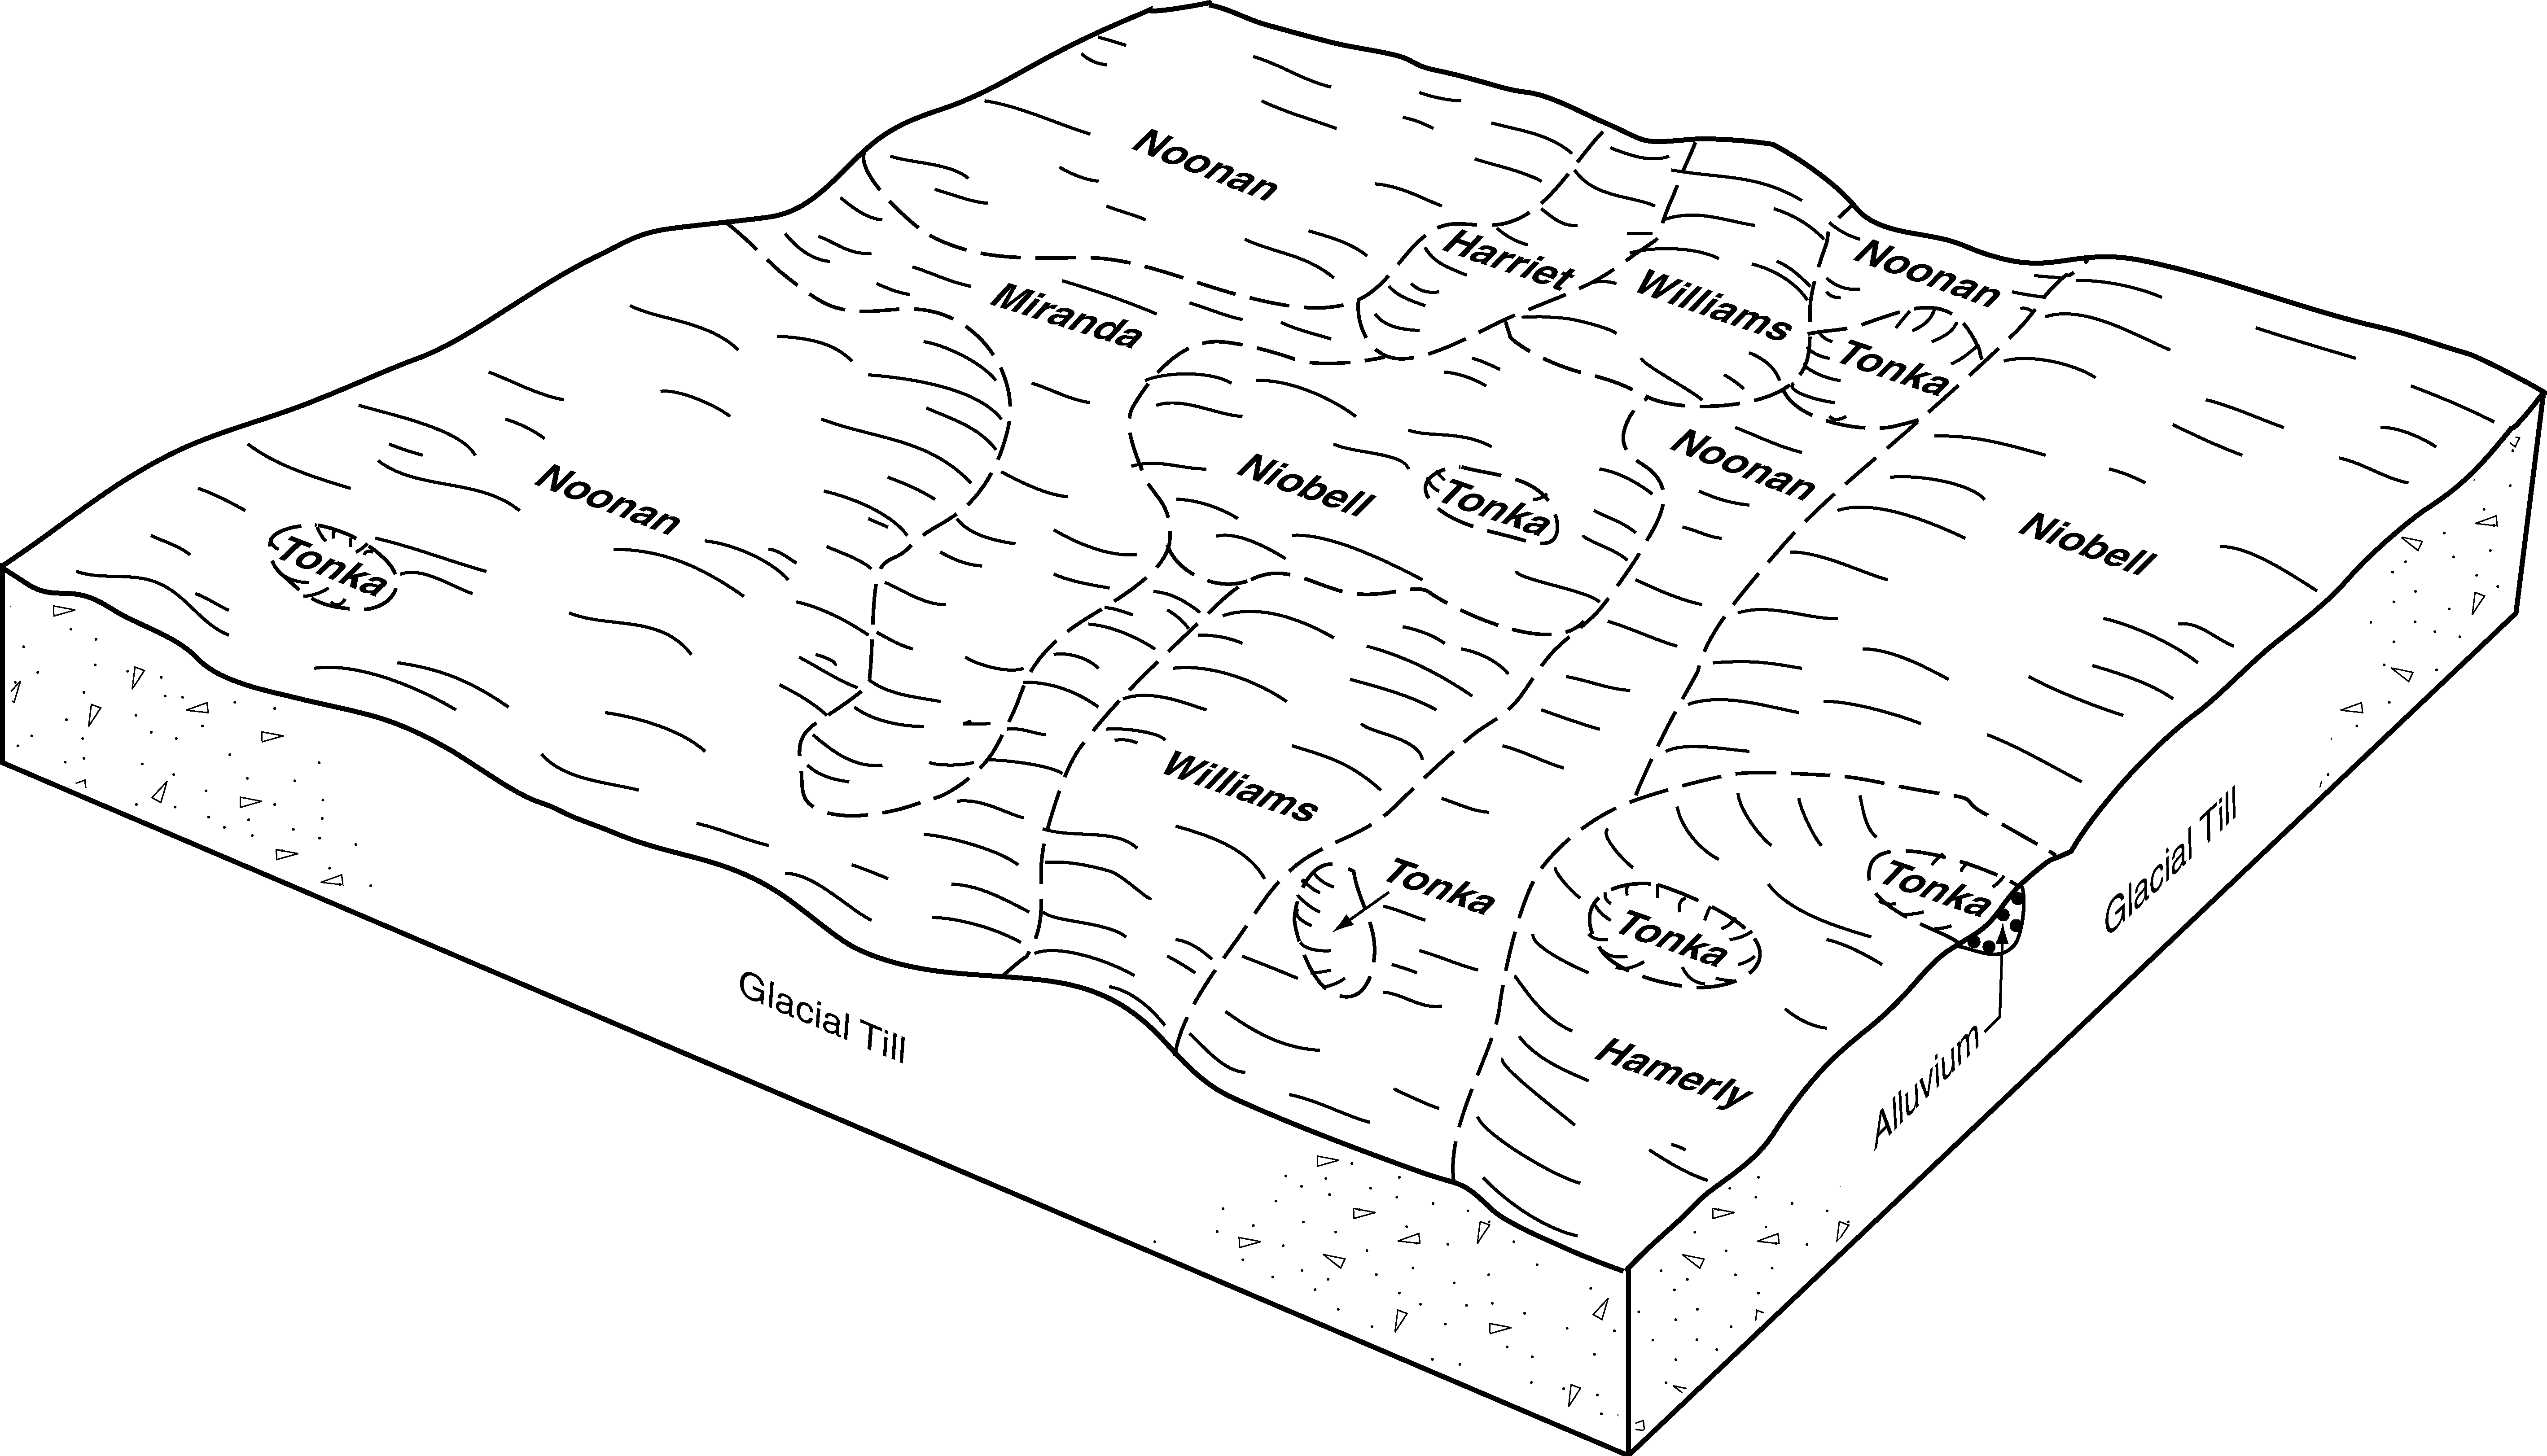
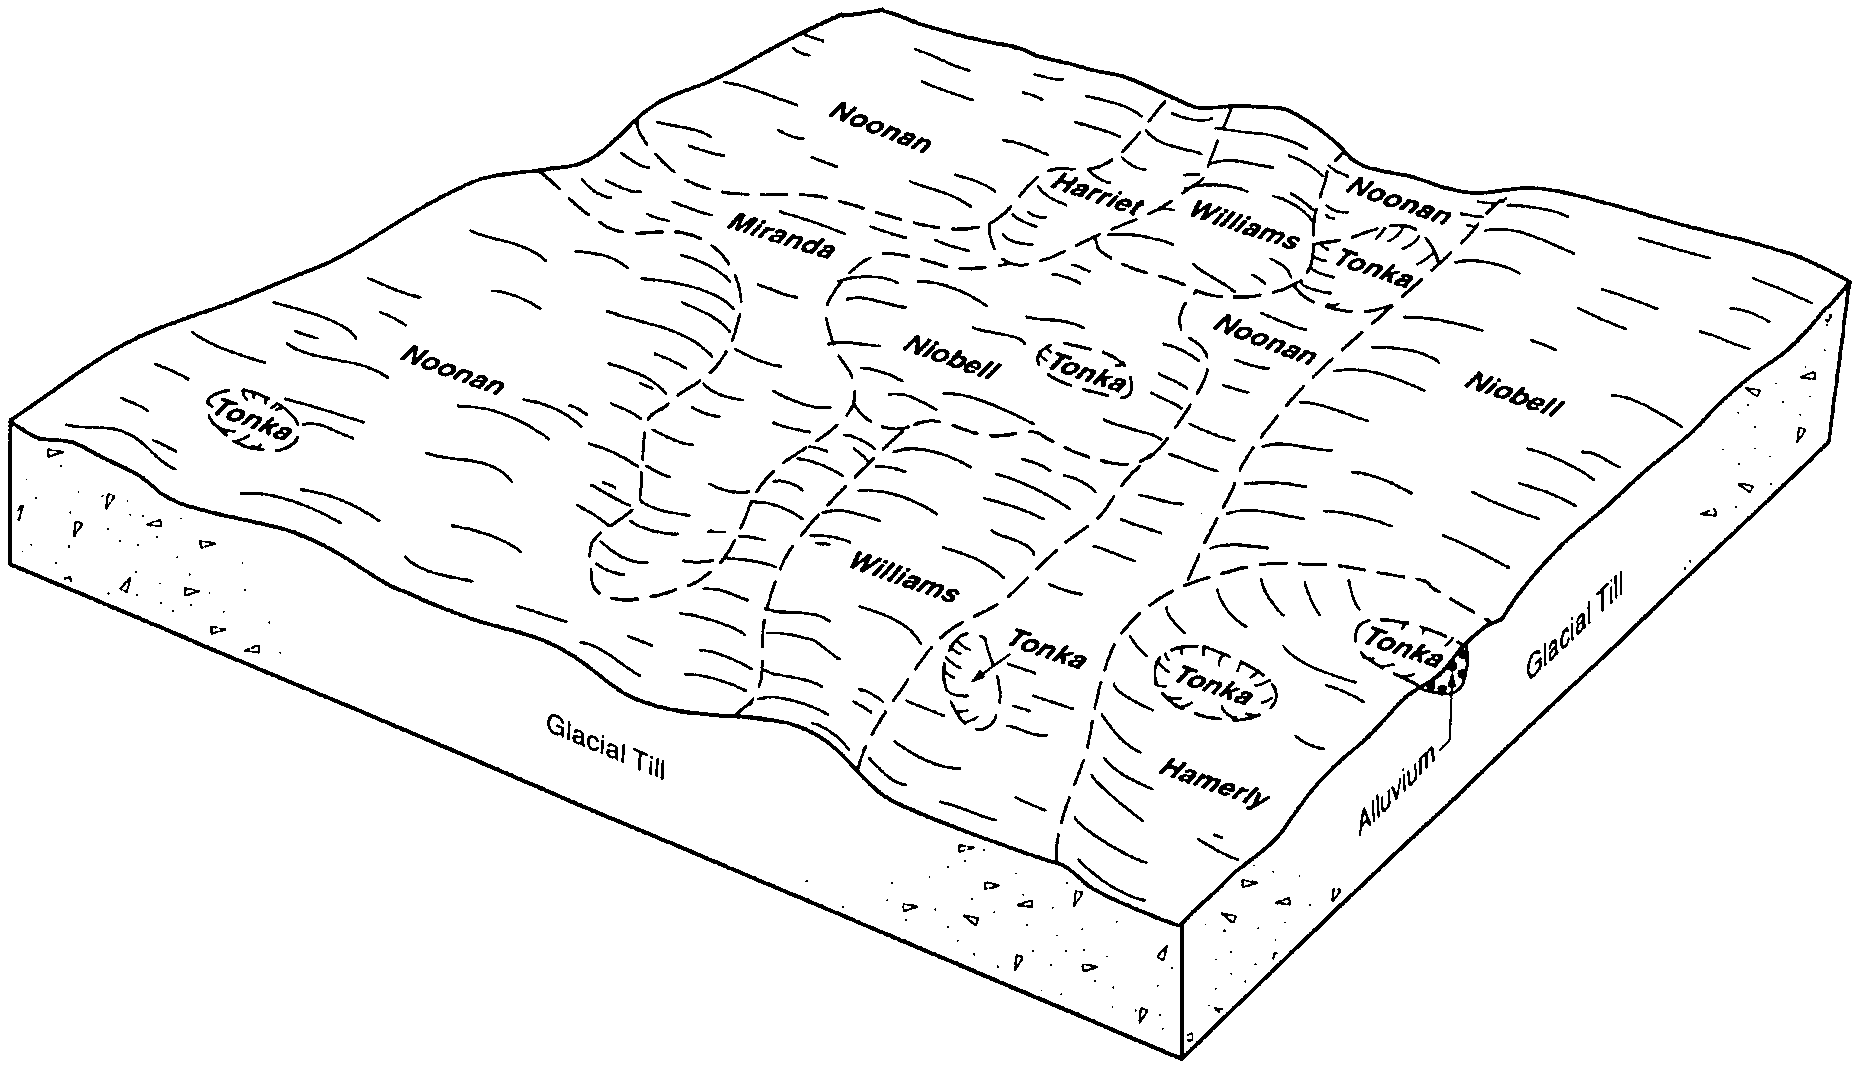
| Miranda-Noonan loams, 0 to 3 percent slopes | 2181 | 34340 | 341122 | cfyy | nd013 | 1991 | 1:24000 |
Miranda-Noonan loams, 0 to 3 percent slopes | C557A | 100 | 2564064 | 2q2kh | nd013 | 1991 | 1:24000 |
Miranda-Noonan loams, 3 to 6 percent slopes | C557B | 9 | 2595623 | 2q2kg | nd013 | 1991 | 1:24000 |
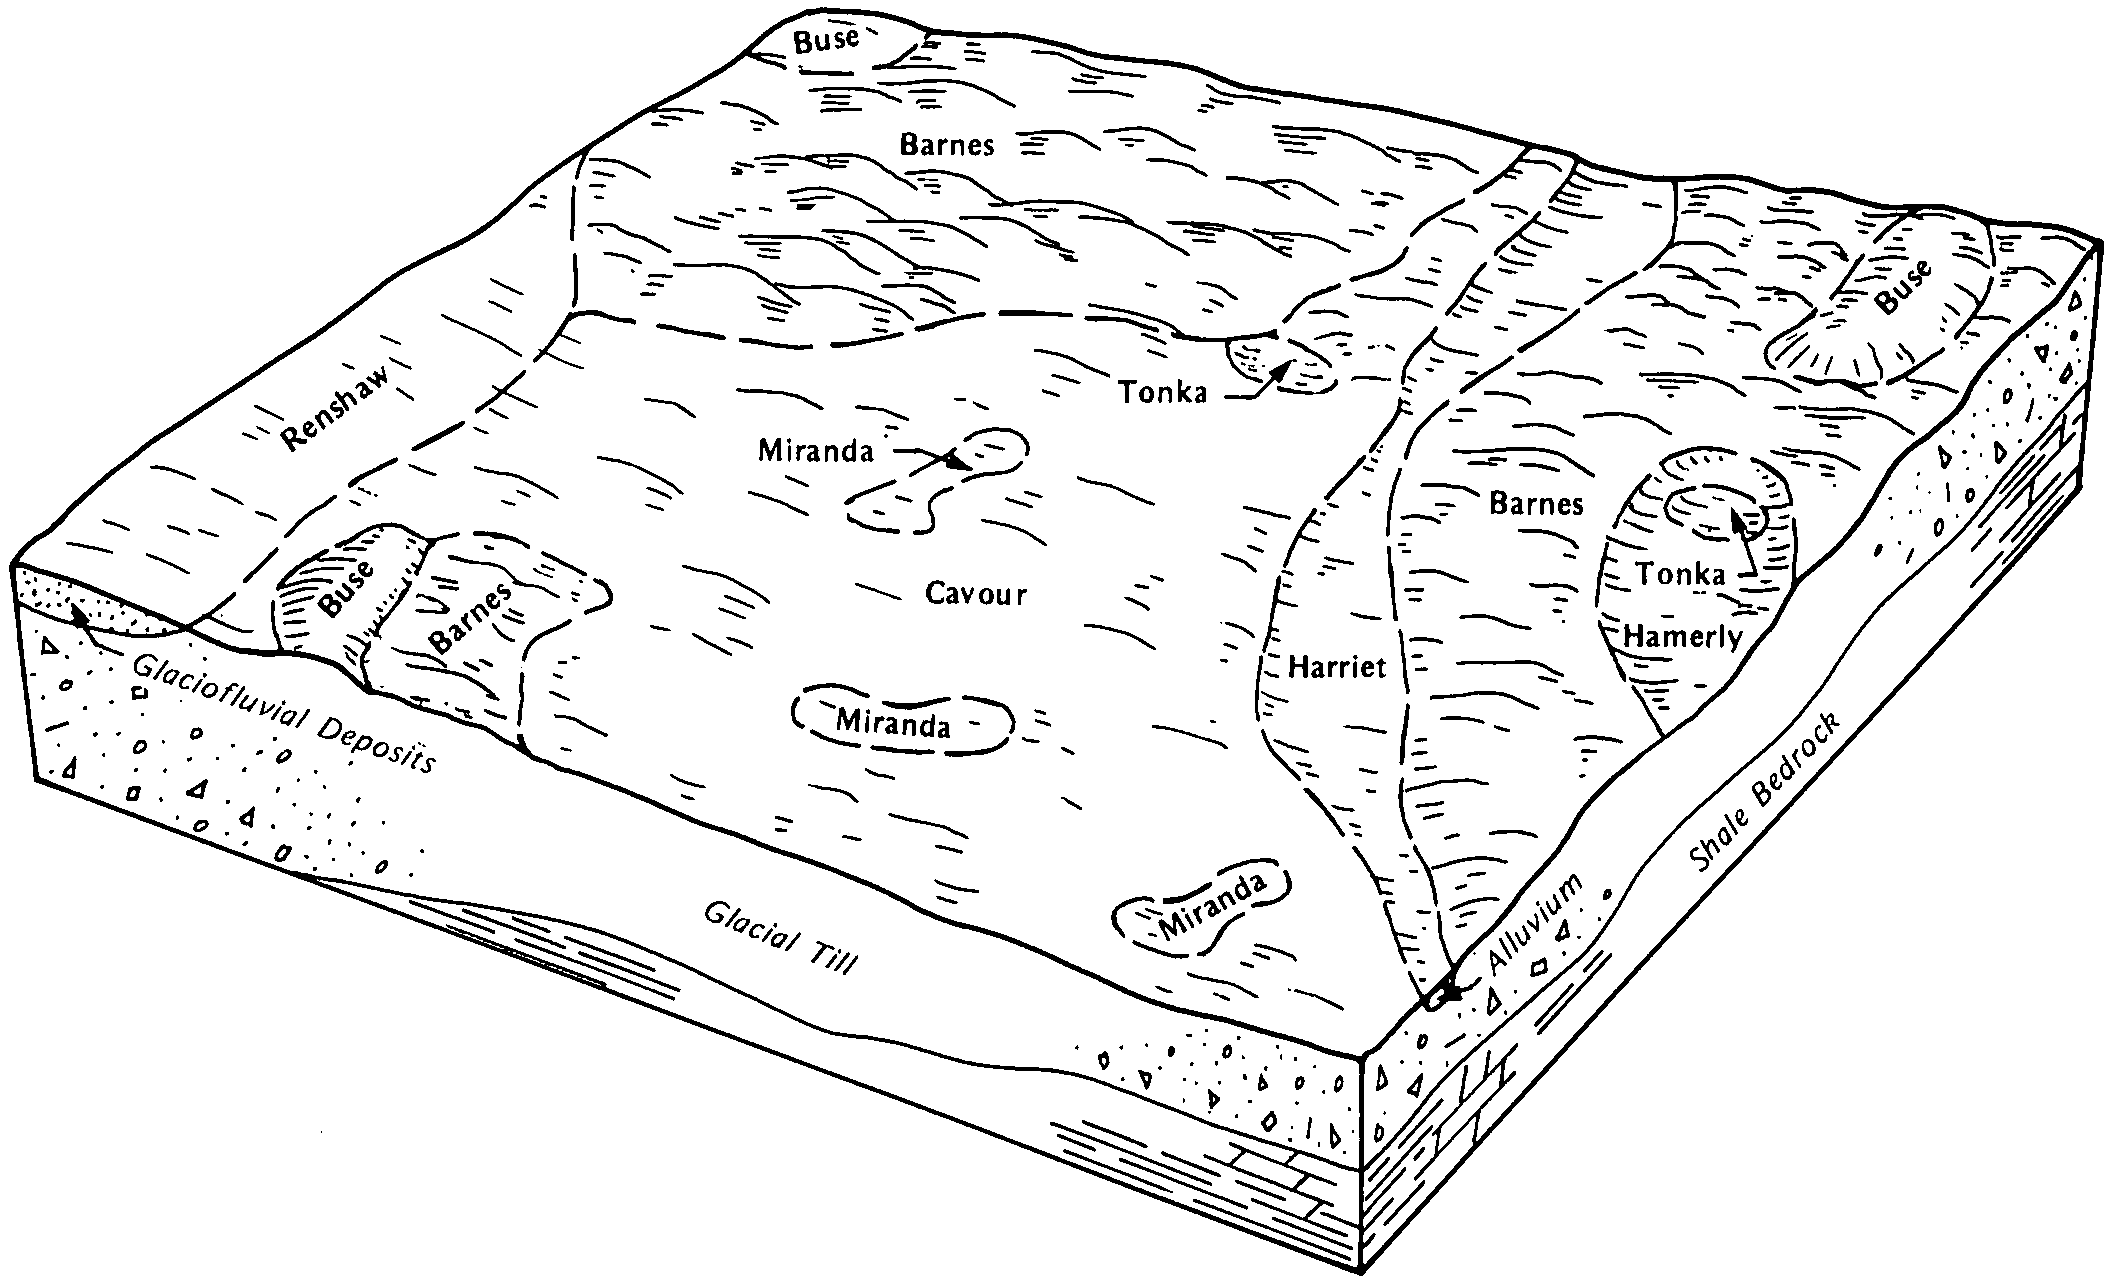
Miranda-Zahl loams, 3 to 25 percent slopes | C559E | 2 | 2595629 | 2q4xb | nd013 | 1991 | 1:24000 |
Miranda-Noonan loams, 3 to 6 percent slopes | C557B | 1008 | 2494660 | 2q2kg | nd015 | 1967 | 1:20000 |
Miranda-Noonan loams, 0 to 3 percent slopes | C557A | 398 | 2567049 | 2q2kh | nd015 | 1967 | 1:20000 |
Miranda-Noonan loams, 0 to 3 percent slopes | 2181 | 9878 | 341321 | cg5c | nd023 | 1992 | 1:24000 |
Miranda-Zahl loams, 3 to 25 percent slopes | 1309 | 984 | 341284 | cg45 | nd023 | 1992 | 1:24000 |
Miranda-Noonan loams, 0 to 3 percent slopes | C557A | 951 | 2564252 | 2q2kh | nd023 | 1992 | 1:24000 |
Miranda-Zahl loams, 3 to 25 percent slopes | C559E | 138 | 2564275 | 2q4xb | nd023 | 1992 | 1:24000 |
Miranda-Noonan loams, 3 to 6 percent slopes | C557B | 79 | 2595803 | 2q2kg | nd029 | 1979 | 1:20000 |
Miranda-Noonan loams, 3 to 6 percent slopes | C557B | 2705 | 2494661 | 2q2kg | nd043 | 1985 | 1:20000 |
Miranda-Noonan loams, 0 to 3 percent slopes | C557A | 2388 | 2595477 | 2q2kh | nd043 | 1985 | 1:20000 |
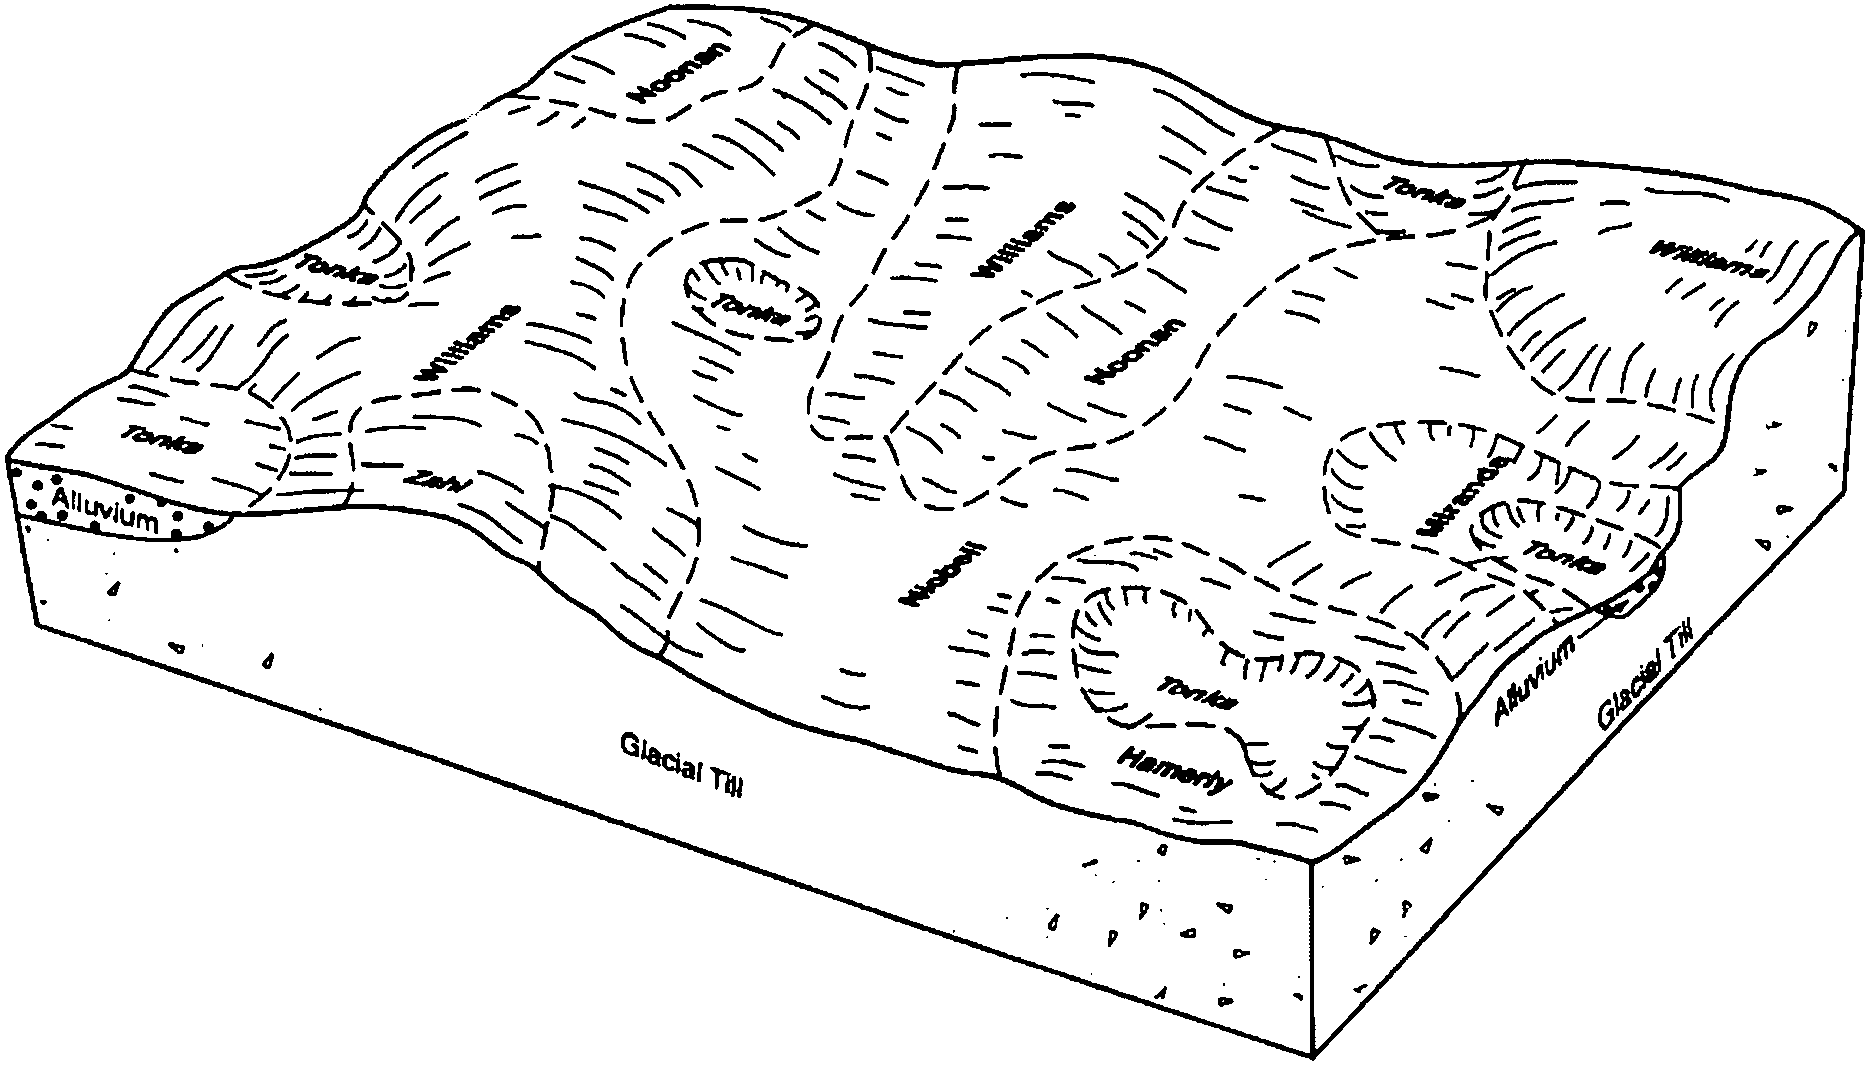
Noonan-Miranda loams, 0 to 6 percent slopes | C556B | 209 | 2566459 | 2q58s | nd045 | 1966 | 1:20000 |
Noonan-Miranda loams, 0 to 6 percent slopes | C556B | 931 | 2566699 | 2q58s | nd055 | 1974 | 1:20000 |
Noonan-Miranda loams, 6 to 15 percent slopes | E3515D | 234 | 2662482 | 2qkx7 | nd055 | 1974 | 1:20000 |
Noonan-Miranda loams, 0 to 6 percent slopes | E3515B | 191 | 2662481 | 2qkx6 | nd055 | 1974 | 1:20000 |
Miranda-Zahl loams, 3 to 25 percent slopes | C559E | 13 | 2567152 | 2q4xb | nd055 | 1974 | 1:20000 |
Miranda-Zahl loams, 3 to 25 percent slopes | C559E | 2640 | 2566761 | 2q4xb | nd061 | 1988 | 1:24000 |
Miranda-Noonan loams, 3 to 6 percent slopes | C557B | 1004 | 2494662 | 2q2kg | nd061 | 1988 | 1:24000 |
Miranda-Noonan loams, 0 to 3 percent slopes | C557A | 292 | 2595556 | 2q2kh | nd061 | 1988 | 1:24000 |
Noonan-Miranda loams, 0 to 6 percent slopes | E3515B | 4 | 2662529 | 2qkx6 | nd061 | 1988 | 1:24000 |
Miranda-Noonan loams, 0 to 3 percent slopes | C557A | 1531 | 2566788 | 2q2kh | nd083 | 1990 | 1:20000 |
Noonan-Miranda loams, 0 to 6 percent slopes | C556B | 349 | 2566862 | 2q58s | nd093 | 1990 | 1:24000 |
Miranda loam, 0 to 2 percent slopes | C534A | 289 | 2566861 | 2q4wz | nd093 | 1990 | 1:24000 |
Miranda-Zahl loams, 3 to 25 percent slopes | C559E | 1491 | 2566924 | 2q4xb | nd101 | 1967 | 1:20000 |
Noonan-Miranda complex | Nm | 276 | 352532 | ctv0 | nd101 | 1967 | 1:20000 |
Noonan-Miranda loams, 0 to 6 percent slopes | C556B | 158 | 2566926 | 2q58s | nd101 | 1967 | 1:20000 |
Miranda-Noonan loams, 0 to 3 percent slopes | C557A | 517 | 2595705 | 2q2kh | nd103 | 1966 | 1:12000 |
Miranda-Noonan loams, 3 to 6 percent slopes | C557B | 1 | 2595704 | 2q2kg | nd103 | 1966 | 1:12000 |
Noonan-Miranda loams, 0 to 6 percent slopes | C556B | 28568 | 2765576 | 2q58s | sd013 | 1987 | 1:20000 |
Portal-Parshall-Miranda complex, 0 to 2 percent slopes | C544A | 3011 | 2765595 | 2rrqv | sd013 | 1987 | 1:20000 |
Miranda-Heil complex, 0 to 3 percent slopes | C558A | 2991 | 2765596 | 2rrqx | sd013 | 1987 | 1:20000 |
Portal-Parshall-Miranda complex, 2 to 6 percent slopes | C544B | 58 | 2765606 | 2rsqw | sd013 | 1987 | 1:20000 |
Noonan-Miranda loams, 0 to 6 percent slopes | C556B | 194 | 2797897 | 2q58s | sd021 | 1978 | 1:20000 |
Noonan-Miranda loams, 0 to 6 percent slopes | C556B | 11787 | 2798572 | 2q58s | sd045 | 1973 | 1:20000 |
Portal-Parshall-Miranda complex, 2 to 6 percent slopes | C544B | 44 | 2798613 | 2rsqw | sd045 | 1973 | 1:20000 |
Noonan-Miranda loams, 0 to 6 percent slopes | C556B | 7293 | 2798642 | 2q58s | sd049 | 1981 | 1:20000 |
Noonan-Miranda loams, 0 to 6 percent slopes | C556B | 20909 | 2798734 | 2q58s | sd089 | 1980 | 1:20000 |
Miranda-Heil complex, 0 to 3 percent slopes | C558A | 4643 | 2798766 | 2rrqx | sd089 | 1980 | 1:20000 |
Portal-Parshall-Miranda complex, 2 to 6 percent slopes | C544B | 4277 | 2798779 | 2rsqw | sd089 | 1980 | 1:20000 |
Portal-Parshall-Miranda complex, 0 to 2 percent slopes | C544A | 90 | 2798764 | 2rrqv | sd089 | 1980 | 1:20000 |
Miranda loam, 0 to 2 percent slopes | C534A | 11 | 2798733 | 2q4wz | sd089 | 1980 | 1:20000 |
Miranda loam, 0 to 2 percent slopes | C534A | 170 | 2799463 | 2q4wz | sd107 | 1983 | 1:20000 |
Noonan-Miranda loams, 0 to 6 percent slopes | C556B | 1054 | 2799501 | 2q58s | sd115 | 1997 | 1:24000 |
Miranda-Heil complex, 0 to 3 percent slopes | C558A | 538 | 2799516 | 2rrqx | sd115 | 1997 | 1:24000 |
Noonan-Miranda loams, 0 to 6 percent slopes | C556B | 927 | 2800105 | 2q58s | sd129 | 1975 | 1:20000 |
Miranda loam, 0 to 2 percent slopes | C534A | 366 | 2800104 | 2q4wz | sd129 | 1975 | 1:20000 |