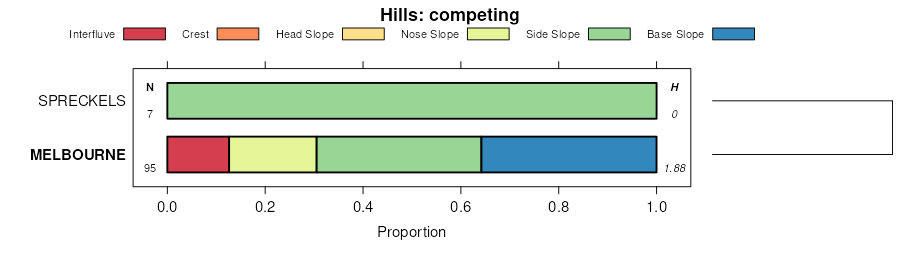
| Melbourne-Holland families association, deep, 35 to 70 percent slopes | 252 | 25716 | 470245 | hsb6 | ca701 | 1984 | 1:24000 |
Clallam family, moderately deep, unstable-Melbourne family, deep association, 35 to 70 percent slopes | 237 | 17270 | 470233 | hs9t | ca701 | 1984 | 1:24000 |
Melbourne-Soulajule families association, deep, 5 to 35 percent slopes | 238 | 5928 | 470234 | hs9v | ca701 | 1984 | 1:24000 |
Clallam family, moderately deep, unstable-Melbourne family, deep association, 35 to 70 percent slopes. | 237sr | 398 | 1868180 | 20pzw | ca707 | 1983 | 1:24000 |
Melbourne-Holland families association, deep, 35 to 70 percent slopes. | 252sr | 171 | 1868186 | 20q02 | ca707 | 1983 | 1:24000 |
Clallam family, moderately deep, unstable-Melbourne family, deep association, 35 to 70 percent slopes | 237sr | 180 | 2747883 | 2q3rs | ca709 | 2010 | 1:24000 |
Melbourne silty clay loam, 12 to 20 percent slopes | 31D | 5218 | 61472 | 21yz | or067 | 1975 | 1:20000 |
Melbourne silty clay loam, 30 to 60 percent slopes | 31F | 3838 | 61474 | 21z1 | or067 | 1975 | 1:20000 |
Melbourne silty clay loam, 7 to 12 percent slopes | 31C | 3377 | 61471 | 21yy | or067 | 1975 | 1:20000 |
Melbourne silty clay loam, 20 to 30 percent slopes | 31E | 2974 | 61473 | 21z0 | or067 | 1975 | 1:20000 |
Melbourne silty clay loam, 2 to 7 percent slopes | 31B | 775 | 61470 | 21yx | or067 | 1975 | 1:20000 |
Melbourne-Goodin silty clay loams, 12 to 20 percent slopes | 2790D | 74 | 2711122 | 1jrw8 | or067 | 1975 | 1:20000 |
Goodin-Melbourne complex, 2 to 12 percent slopes | 2789C | 34 | 2711121 | 1jrw1 | or067 | 1975 | 1:20000 |
Melbourne-Witham complex, hummocky, 2 to 25 percent slopes, | 2769C | 34 | 2711111 | 1j8cg | or067 | 1975 | 1:20000 |
Melbourne-Goodin silty clay loams, 30 to 60 percent slopes | 2790F | 26 | 2711124 | 1jrwb | or067 | 1975 | 1:20000 |
Melbourne-Goodin silty clay loams, 20 to 30 percent slopes | 2790E | 25 | 2711123 | 1jrw9 | or067 | 1975 | 1:20000 |
Melbourne-Goodin silt loams, 12 to 20 percent slopes | 2770D | 18 | 2711113 | 1j8cj | or067 | 1975 | 1:20000 |
Melbourne-Goodin silt loams, 20 to 30 percent slopes | 2770E | 17 | 2711114 | 1j8ck | or067 | 1975 | 1:20000 |
Melbourne-Goodin silt loams, 30 to 60 percent slopes | 2770F | 8 | 2711115 | 1j8cl | or067 | 1975 | 1:20000 |
Melbourne-Goodin silt loams, 2 to 12 percent slopes | 2770C | 7 | 2711112 | 1j8ch | or067 | 1975 | 1:20000 |
Melbourne-Goodin silty clay loams, 12 to 20 percent slopes | 2790D | 5955 | 2731438 | 1jrw8 | or071 | 1967 | 1:24000 |
Melbourne-Goodin silty clay loams, 20 to 30 percent slopes | 2790E | 5059 | 2711283 | 1jrw9 | or071 | 1967 | 1:24000 |
Melbourne-Goodin silt loams, 30 to 60 percent slopes | 2770F | 3787 | 2711275 | 1j8cl | or071 | 1967 | 1:24000 |
Melbourne-Witham complex, hummocky, 2 to 25 percent slopes, | 2769C | 3133 | 2711410 | 1j8cg | or071 | 1967 | 1:24000 |
Goodin-Melbourne complex, 2 to 12 percent slopes | 2789C | 2886 | 2711334 | 1jrw1 | or071 | 1967 | 1:24000 |
Melbourne-Goodin silt loams, 20 to 30 percent slopes | 2770E | 2485 | 2731451 | 1j8ck | or071 | 1967 | 1:24000 |
Goodin-Melbourne complex, 12 to 20 percent slopes | 2767D | 1901 | 2711382 | 1j8cc | or071 | 1967 | 1:24000 |
Melbourne-Goodin silty clay loams, 30 to 60 percent slopes | 2790F | 1742 | 2711368 | 1jrwb | or071 | 1967 | 1:24000 |
Melbourne-Goodin silt loams, 12 to 20 percent slopes | 2770D | 1711 | 2711348 | 1j8cj | or071 | 1967 | 1:24000 |
Goodin-Melbourne complex, 20 to 30 percent slopes | 2767E | 1187 | 2711294 | 1j8cd | or071 | 1967 | 1:24000 |
Goodin-Melbourne complex, 2 to 30 percent slopes | 2771E | 596 | 2711384 | 1j8cm | or071 | 1967 | 1:24000 |
Melbourne-Goodin silt loams, 2 to 12 percent slopes | 2770C | 517 | 2711282 | 1j8ch | or071 | 1967 | 1:24000 |
Melbourne-Witham complex, hummocky, 5 to 25 percent, moist | 2805E | 436 | 2711296 | 2n8r1 | or071 | 1967 | 1:24000 |
Goodin-Melbourne complex, 30 to 60 percent slopes | 2767F | 226 | 2711358 | 1j8cf | or071 | 1967 | 1:24000 |
Melbourne-Witham complex, very hummocky, 2 to 40 percent slopes | 2822E | 76 | 2711360 | 2q3kl | or071 | 1967 | 1:24000 |
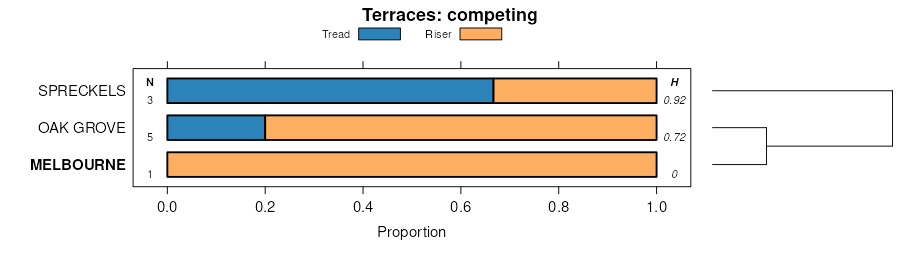
Melbourne loam, 20 to 30 percent slopes | 129 | 1830 | 72162 | 2f2t | wa015 | 1994 | 1:24000 |
Melbourne loam, 8 to 20 percent slopes | 128 | 1105 | 72161 | 2f2s | wa015 | 1994 | 1:24000 |
Melbourne loam, 0 to 8 percent slopes | 266 | 14 | 736629 | sqj7 | wa015 | 1994 | 1:24000 |
Melbourne silt loam, 8 to 30 percent slopes | 77 | 6673 | 73675 | 2gnm | wa627 | 1979 | 1:24000 |
Melbourne silt loam, 1 to 8 percent slopes | 76 | 286 | 73674 | 2gnl | wa627 | 1979 | 1:24000 |
Melbourne silt loam, 30 to 65 percent slopes | 78 | 210 | 73676 | 2gnn | wa627 | 1979 | 1:24000 |
Melbourne silt loam, 4 to 12 percent slopes | 3310 | | 3442402 | 2w95l | wa641 | 1980 | 1:24000 |
Melbourne loam, 15 to 30 percent slopes | 132 | 38579 | 74279 | 2h93 | wa641 | 1980 | 1:24000 |
Melbourne loam, 8 to 15 percent slopes | 131 | 27125 | 74278 | 2h92 | wa641 | 1980 | 1:24000 |
Melbourne loam, 0 to 8 percent slopes | 130 | 9710 | 74277 | 2h91 | wa641 | 1980 | 1:24000 |
Melbourne silty clay loam, 20 to 40 percent slopes | 67 | 8793 | 2454689 | 2nd9j | wa667 | 1983 | 1:24000 |
Melbourne silty clay loam, 5 to 20 percent slopes | 66 | 4918 | 2454688 | 2nd9h | wa667 | 1983 | 1:24000 |
Melbourne silty clay loam, 40 to 65 percent slopes | 68 | 4667 | 2454690 | 2nd9k | wa667 | 1983 | 1:24000 |