| Manzano sandy clay loam, 0 to 3 percent slopes | 36 | 1550 | 54209 | 1tdp | az633 | 1994 | 1:24000 |
Manzano loam | 43 | 5583 | 496480 | jnmh | co627 | 1980 | 1:24000 |
Manzano fine sandy loam, 0 to 2 percent slopes | 90 | 104 | 497539 | jpqn | co641 | 1980 | 1:24000 |
Deacon-La Brier-Manzano association, sloping | DR | 54241 | 507732 | k1bg | nm007 | 1974 | 1:24000 |
Manzano association, gently sloping | MB | 3207 | 507756 | k1c7 | nm007 | 1974 | 1:24000 |
Riverwash-Manzano complex | Rz | 2718 | 507775 | k1cv | nm007 | 1974 | 1:24000 |
Manzano loam | Ma | 2477 | 507760 | k1cc | nm007 | 1974 | 1:24000 |
Manzano loam, 0 to 2 percent slopes, rarely flooded | 70 | 13679 | 375880 | dm45 | nm019 | 1988 | 1:48000 |
Manzano loam, 0 to 2 percent slopes | 105 | 1121 | 375833 | dm2n | nm019 | 1988 | 1:48000 |
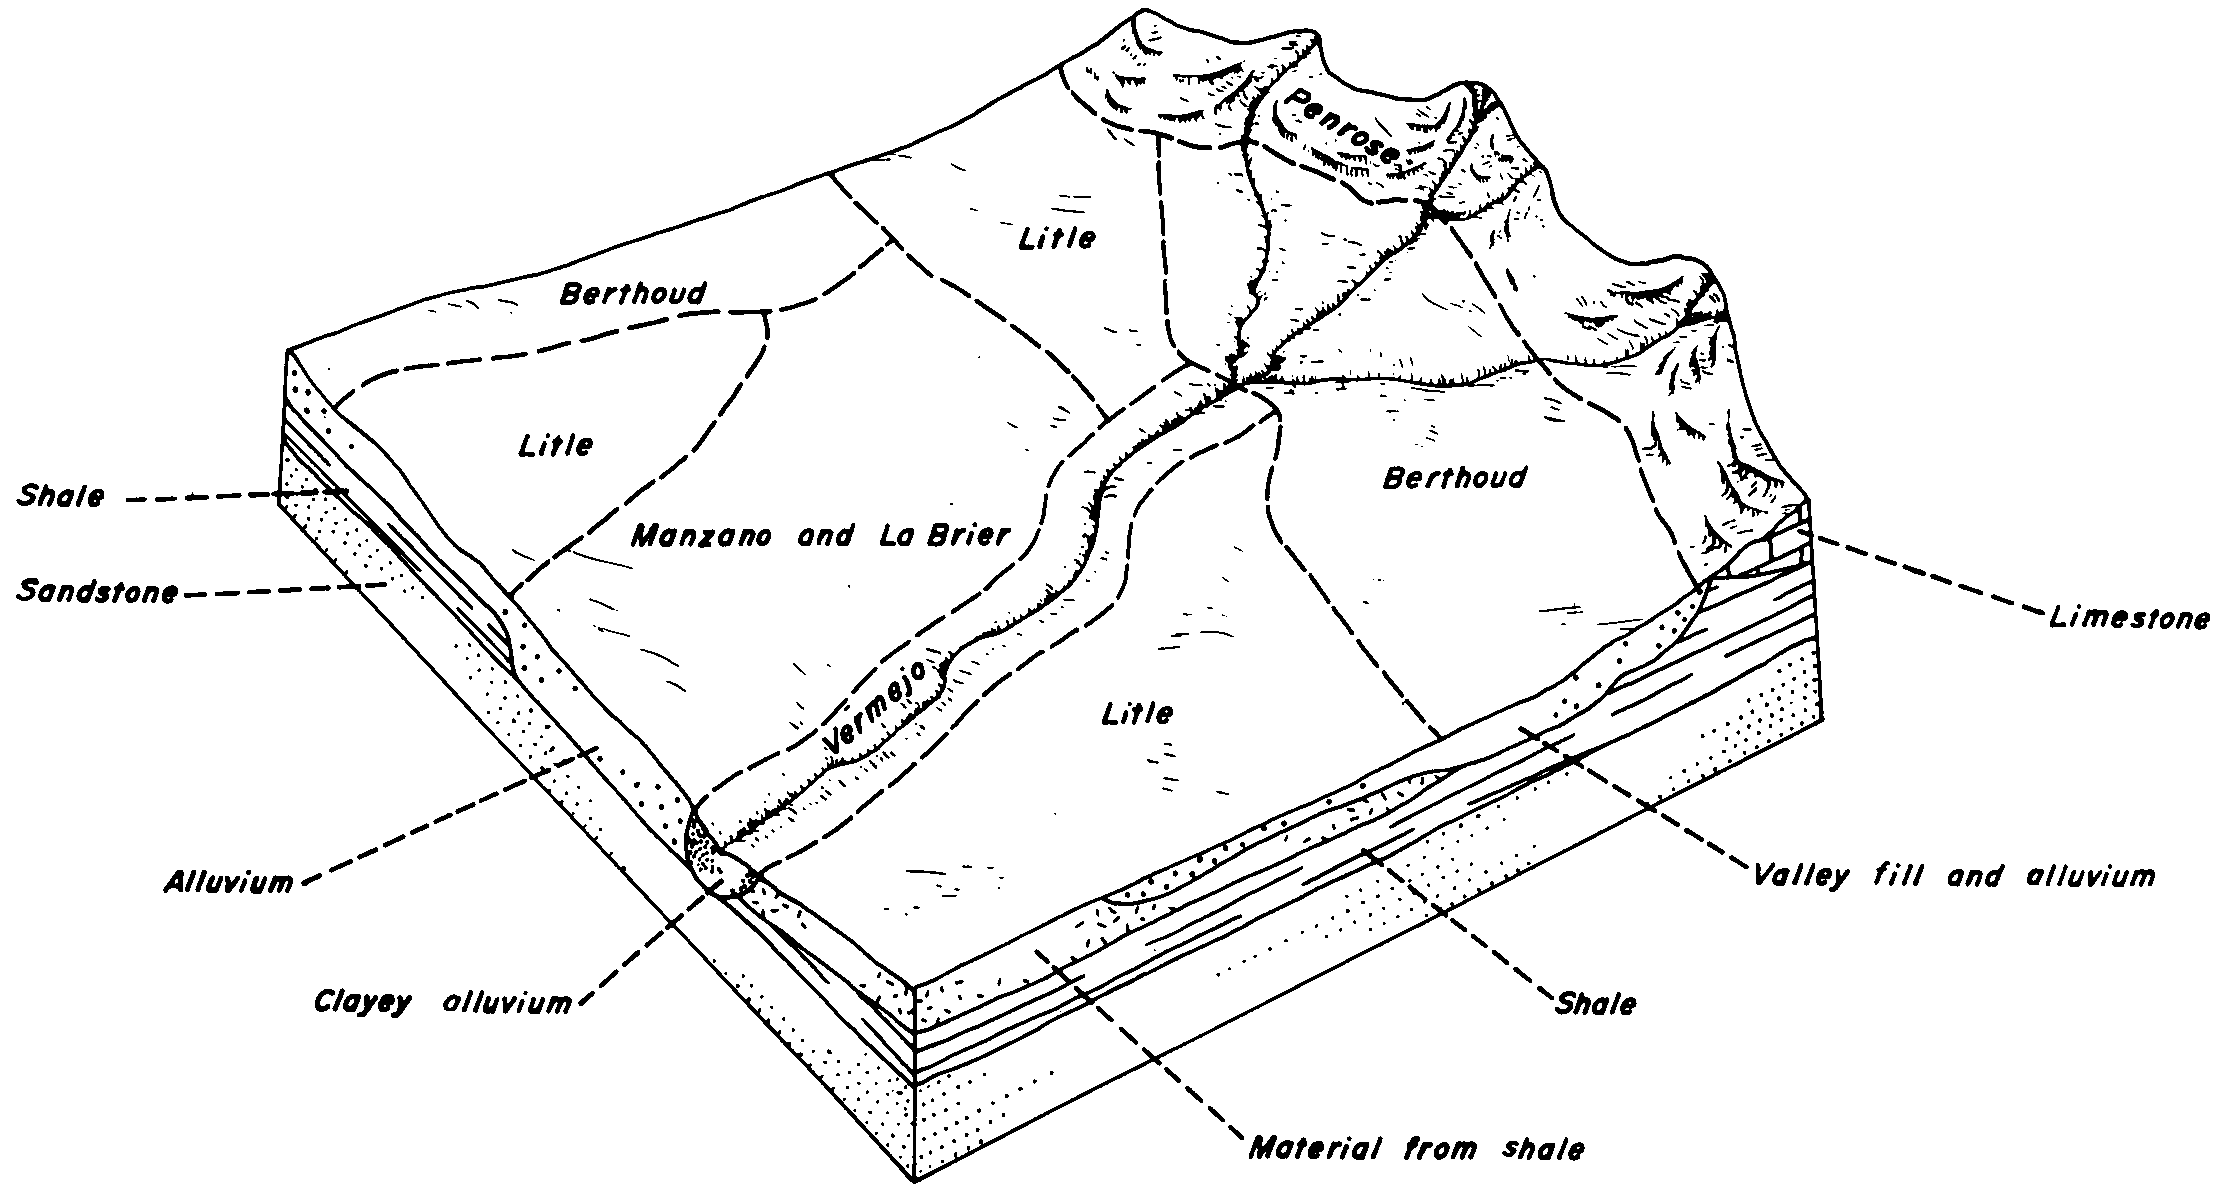
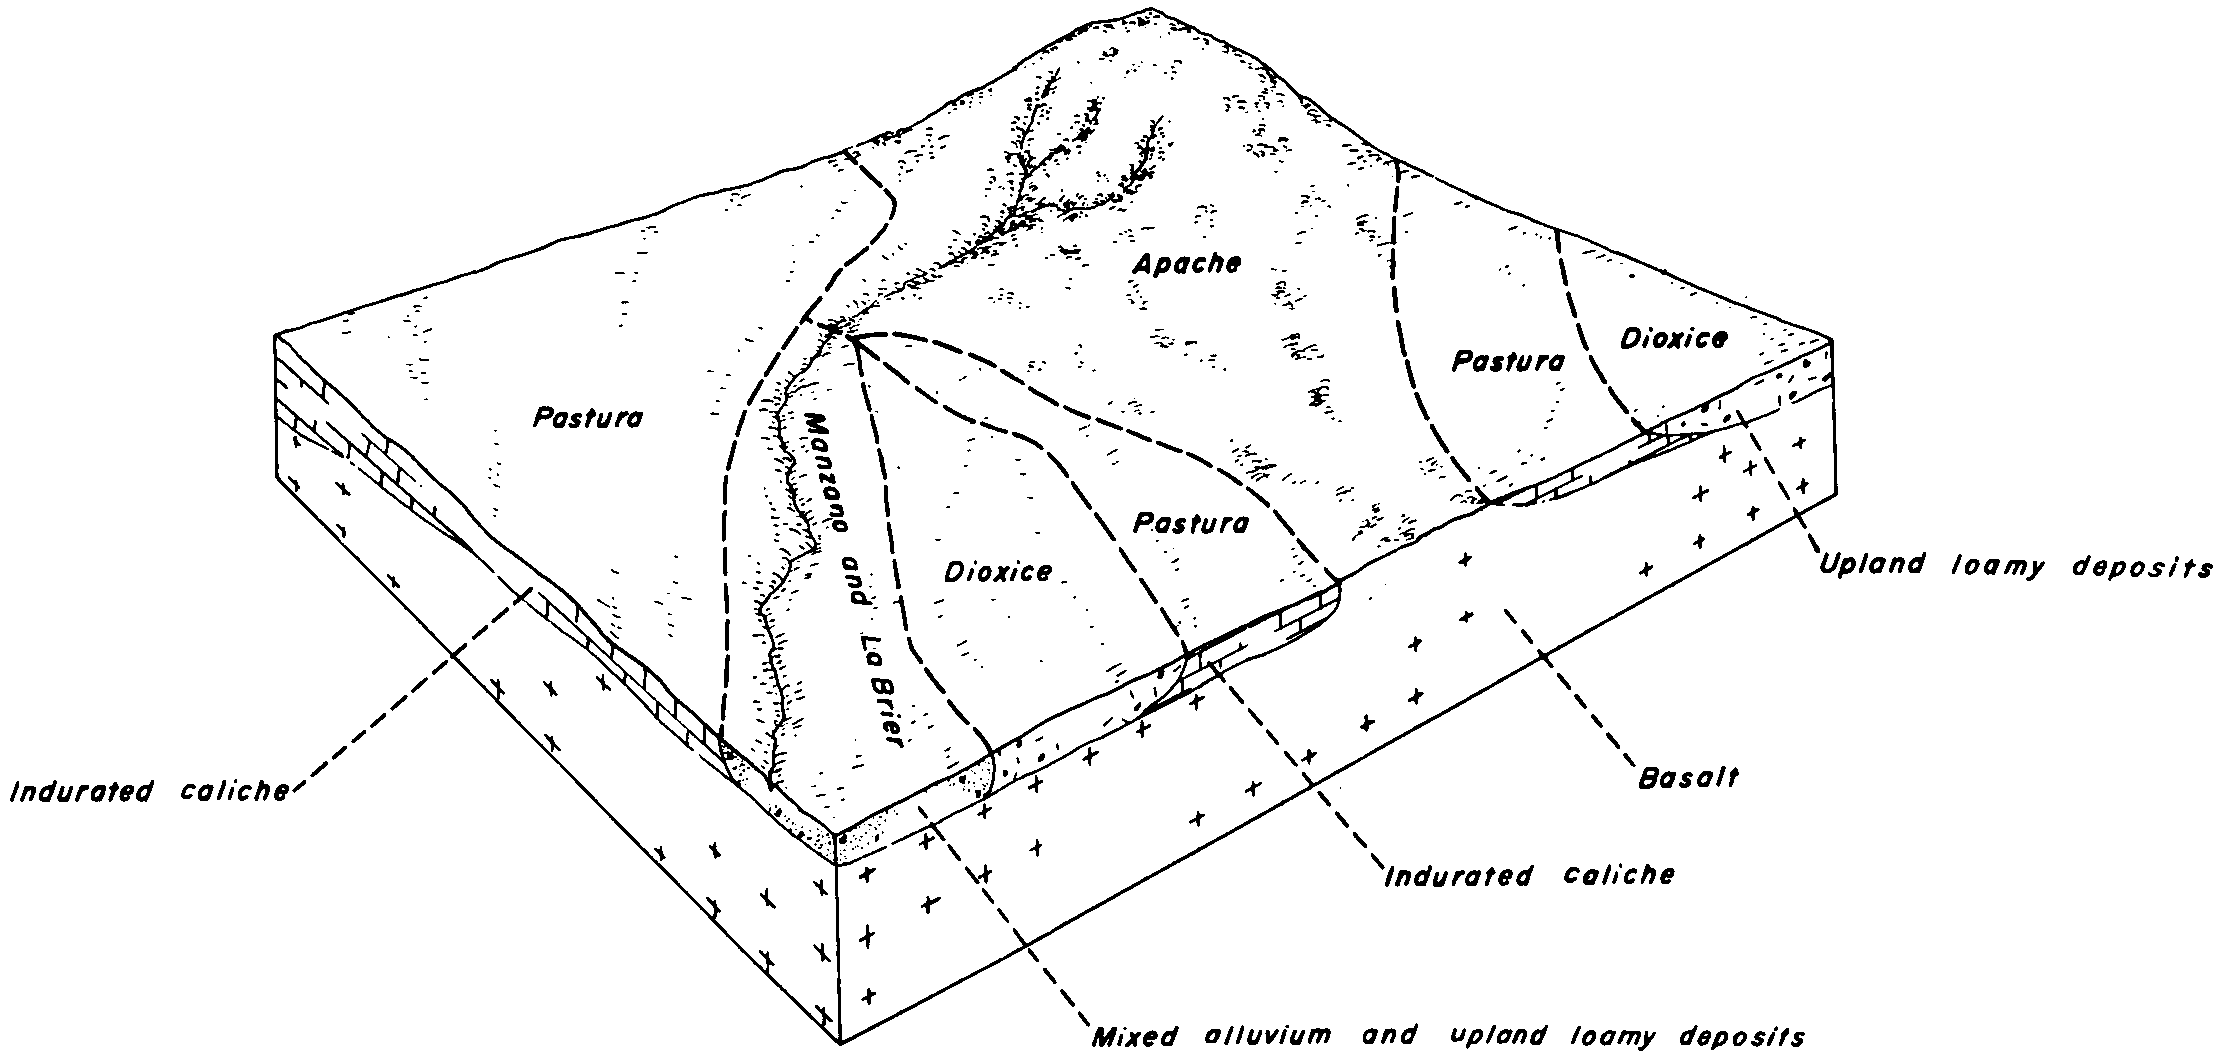
Manzano and La Brier soils | Mo | 9304 | 376366 | dmmv | nm021 | 1968 | 1:31680 |
Manzano loam | Mn | 8917 | 376365 | dmmt | nm021 | 1968 | 1:31680 |
Manzano sandy loam | Mm | 2395 | 376364 | dmms | nm021 | 1968 | 1:31680 |
Manzano loam, wet variant | Mr | 476 | 376367 | dmmw | nm021 | 1968 | 1:31680 |
Kim-Manzano association | Km | 77594 | 3031454 | dmv7 | nm059 | 1972 | 1:24000 |
Manzano loam | Mn | 43464 | 3031458 | dmvc | nm059 | 1972 | 1:24000 |
Kim-Manzano association, moist, 0 to 9 percent slopes | KmmD | 14542 | 3031547 | 2xxtj | nm059 | 1972 | 1:24000 |
Manzano loam, moist, 0 to 3 percent slopes | MnmB | 8736 | 3031552 | 2xxv5 | nm059 | 1972 | 1:24000 |
Manzano loam | Mz | 5525 | 55669 | 1vxs | nm600 | 1973 | 1:24000 |
Manzano loam, gently sloping | MC | 13571 | 375537 | dls3 | nm630 | 1977 | 1:48000 |
Manzano clay loam, 1 to 3 percent slopes | Md | 1925 | 375538 | dls4 | nm630 | 1977 | 1:48000 |
Gullied land-Manzano complex, gently sloping | GB | 1832 | 375520 | dlrk | nm630 | 1977 | 1:48000 |
Manzano fine sandy loam, 1 to 3 percent slopes | Mb | 506 | 375536 | dls2 | nm630 | 1977 | 1:48000 |
Manzano loam, 0 to 3 percent slopes | 35 | 3779 | 375594 | dlty | nm632 | 1981 | 1:63360 |
Manzano loam, 1 to 3 percent slopes | Mc | 2021 | 375705 | dlyj | nm638 | 1981 | 1:31680 |
Manzano clay loam, 0 to 2 percent slopes | 424 | 56960 | 56803 | 2tjg6 | nm648 | 1982 | 1:48000 |
Loarc-Flugle-Manzano association, 1 to 9 percent slopes | 675 | 54267 | 56844 | 1x4p | nm648 | 1982 | 1:48000 |
Maia-Manzano complex, 0 to 5 percent slopes | 245 | 7360 | 56239 | 1wj5 | nm650 | 1989 | 1:24000 |
Manzano loam, gently sloping | 54 | 2369 | 56537 | 1wts | nm660 | 1981 | 1:48000 |
Lonti-Manzano association, 1 to 25 percent slopes | 28 | 113547 | 59295 | 1zpr | nm662 | 1979 | 1:48000 |
Judd-Manzano association, 1 to 15 percent slopes | 22 | 15670 | 59289 | 1zpk | nm662 | 1979 | 1:48000 |
Manzano-Ruidoso association, 0 to 5 percent slopes | 34 | 12810 | 59302 | 1zpz | nm662 | 1979 | 1:48000 |
Paymaster-Ellicott-Manzano association, 0 to 5 percent slopes | 45 | 12322 | 59314 | 1zqc | nm662 | 1979 | 1:48000 |
Manzano loam, 1 to 3 percent slopes | 33 | 10634 | 59301 | 1zpy | nm662 | 1979 | 1:48000 |
Manzano loam, 0 to 1 percent slopes | 32 | 1683 | 59300 | 1zpx | nm662 | 1979 | 1:48000 |
Tesajo-Manzano complex, 1 to 3 percent slopes | 69 | 539 | 59340 | 1zr6 | nm662 | 1979 | 1:48000 |
Manzano silt loam, 1 to 3 percent slopes | 424 | 16133 | 57106 | 1xf4 | nm664 | 1984 | 1:24000 |
Amalia-Manzano association, 3 to 50 percent slopes | AMF | 32071 | 507799 | k1dm | nm670 | 1976 | 1:24000 |
Manzano clay loam, 3 to 5 percent slopes | MnC | 5540 | 507843 | k1g1 | nm670 | 1976 | 1:24000 |
Manzano clay loam, 0 to 5 percent slopes | MNC | 3644 | 507832 | k1fp | nm670 | 1976 | 1:24000 |
Manzano clay loam, 1 to 3 percent slopes | MnB | 2379 | 507842 | k1g0 | nm670 | 1976 | 1:24000 |
Manzano clay loam, 0 to 1 percent slopes | MnA | 2056 | 507841 | k1fz | nm670 | 1976 | 1:24000 |
Maia-Manzano, occasionally flooded complex, 0 to 5 percent slopes | MmC | 62 | 2770189 | 2tl9z | nm672 | | 1:24000 |
Manzano loam, 0 to 1 percent slopes | Ma | 34042 | 1473936 | 1lgrb | nm674 | 1965 | 1:24000 |
Manzano loam, saline substratum, 0 to 1 percent slopes | Mc | 25427 | 1473938 | 1lgrd | nm674 | 1965 | 1:24000 |
Prewitt and Manzano soils | Pz | 22483 | 1473964 | 1lgs7 | nm674 | 1965 | 1:24000 |
Manzano loam, 1 to 5 percent slopes | Mb | 8497 | 1473937 | 1lgrc | nm674 | 1965 | 1:24000 |
Maia-Manzano, occasionally flooded complex, 0 to 5 percent slopes | MmC | 2085 | 2934559 | 2tl9z | nm678 | | 1:24000 |
Manzano loam, 1 to 5 percent slopes | MMB | 43 | 2934560 | 2wl1f | nm678 | | 1:24000 |
Manzano loam, 1 to 5 percent slopes | 100 | 2194 | 56854 | 1x50 | nm682 | 1985 | 1:24000 |
Lazarus-Manzano complex, 0 to 8 percent slopes, flooded | 605 | 3830 | 1453778 | 1kss2 | nm687 | 2008 | 1:24000 |