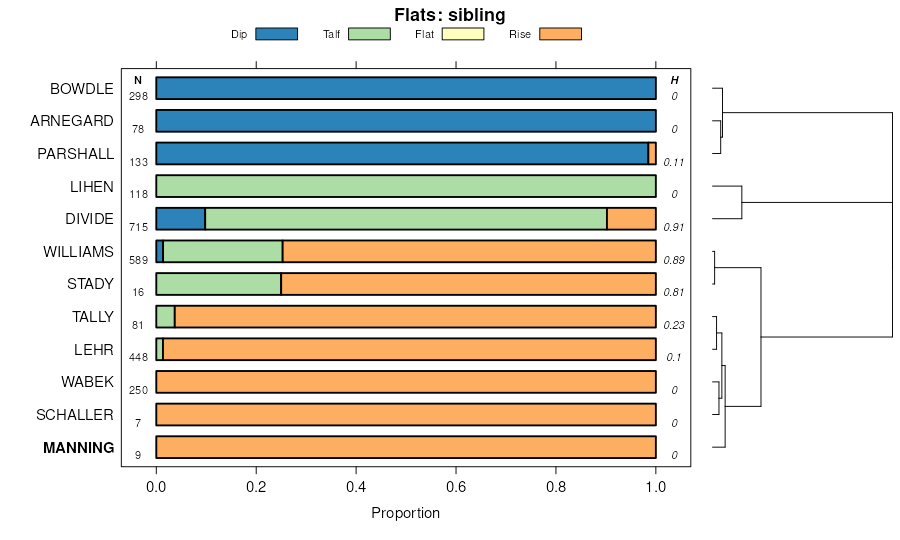
| Manning coarse sandy loam, 0 to 6 percent slopes | MaB | 26336 | 348860 | cq0k | mt091 | 1971 | 1:24000 |
Parshall, gravelly substratum-Manning fine sandy loams, 0 to 2 percent slopes | E4581A | 3957 | 2755669 | 2qz8v | nd001 | 1983 | 1:20000 |
Manning fine sandy loam, 0 to 2 percent slopes | E4585A | 3782 | 2525760 | 1vzwd | nd001 | 1983 | 1:20000 |
Parshall, gravelly substratum-Manning fine sandy loams, 2 to 6 percent slopes | E4581B | 3452 | 2755670 | 2r4fn | nd001 | 1983 | 1:20000 |
Manning fine sandy loam, 2 to 6 percent slopes | E4585B | 2259 | 2525761 | 1vzwf | nd001 | 1983 | 1:20000 |
Manning-Schaller-Wabek complex, 6 to 35 percent slopes | E4561F | 145 | 2525773 | 2r4ff | nd001 | 1983 | 1:20000 |
Manning-Wabek complex, 6 to 9 percent slopes | E4559C | 104 | 2755665 | 2r4fd | nd001 | 1983 | 1:20000 |
Manning-Schaller-Wabek complex, 6 to 35 percent slopes | E4561F | 2265 | 2707110 | 2r4ff | nd007 | 1998 | 1:24000 |
Manning fine sandy loam, 2 to 6 percent slopes | E4585B | 1735 | 2707111 | 1vzwf | nd007 | 1998 | 1:24000 |
Manning fine sandy loam, 0 to 2 percent slopes | E4585A | 318 | 1715194 | 1vzwd | nd007 | 1998 | 1:24000 |
Parshall, gravelly substratum-Manning fine sandy loams, 2 to 6 percent slopes | E4581B | 28 | 2758437 | 2r4fn | nd007 | 1998 | 1:24000 |
Manning-Schaller-Wabek complex, 6 to 35 percent slopes | E4561F | 2966 | 2563580 | 2r4ff | nd011 | 1969 | 1:20000 |
Manning fine sandy loam, 0 to 2 percent slopes | E4585A | 2208 | 2563578 | 1vzwd | nd011 | 1969 | 1:20000 |
Manning fine sandy loam, 2 to 6 percent slopes | E4585B | 1612 | 2563579 | 1vzwf | nd011 | 1969 | 1:20000 |
Manning-Wabek complex, 6 to 9 percent slopes | E4559C | 915 | 2563581 | 2r4fd | nd011 | 1969 | 1:20000 |
Parshall, gravelly substratum-Manning fine sandy loams, 0 to 2 percent slopes | E4581A | 195 | 2758459 | 2qz8v | nd011 | 1969 | 1:20000 |
Manning fine sandy loam, 2 to 6 percent slopes | MaB | 131 | 992857 | 12b4n | nd011 | 1969 | 1:20000 |
Lehr, Manning, and Wabek soils, 6 to 9 percent slopes | LmC | 103 | 992855 | 12b4l | nd011 | 1969 | 1:20000 |
Manning fine sandy loam, 0 to 2 percent slopes | MaA | 99 | 992856 | 12b4m | nd011 | 1969 | 1:20000 |
Manning-Schaller-Wabek complex, 6 to 35 percent slopes | E4561F | 3958 | 2707258 | 2r4ff | nd025 | 1981 | 1:20000 |
Manning fine sandy loam, 2 to 6 percent slopes | E4585B | 2808 | 1714661 | 1vzwf | nd025 | 1981 | 1:20000 |
Manning-Wabek complex, 6 to 9 percent slopes | E4559C | 1422 | 2707257 | 2r4fd | nd025 | 1981 | 1:20000 |
Parshall, gravelly substratum-Manning fine sandy loams, 2 to 6 percent slopes | E4581B | 330 | 2758475 | 2r4fn | nd025 | 1981 | 1:20000 |
Manning fine sandy loam, 0 to 2 percent slopes | E4585A | 216 | 2707259 | 1vzwd | nd025 | 1981 | 1:20000 |
Parshall, gravelly substratum-Manning fine sandy loams, 0 to 2 percent slopes | E4581A | 170 | 2758474 | 2qz8v | nd025 | 1981 | 1:20000 |
Manning fine sandy loam, 0 to 6 percent slopes | C840B | 536 | 2564331 | 2q536 | nd029 | 1979 | 1:20000 |
Manning fine sandy loam, 2 to 6 percent slopes | E4585B | 344 | 2661789 | 1vzwf | nd029 | 1979 | 1:20000 |
Manning-Schaller-Wabek complex, 6 to 35 percent slopes | E4561F | 18026 | 2525893 | 2r4ff | nd037 | 1985 | 1:20000 |
Manning fine sandy loam, 2 to 6 percent slopes | E4585B | 6570 | 2525894 | 1vzwf | nd037 | 1985 | 1:20000 |
Manning fine sandy loam, 0 to 2 percent slopes | E4585A | 4550 | 1715509 | 1vzwd | nd037 | 1985 | 1:20000 |
Parshall, gravelly substratum-Manning fine sandy loams, 0 to 2 percent slopes | E4581A | 1665 | 2759660 | 2qz8v | nd037 | 1985 | 1:20000 |
Parshall, gravelly substratum-Manning fine sandy loams, 2 to 6 percent slopes | E4581B | 1517 | 2759661 | 2r4fn | nd037 | 1985 | 1:20000 |
Manning-Wabek complex, 6 to 9 percent slopes | E4559C | 15 | 2759656 | 2r4fd | nd037 | 1985 | 1:20000 |
Manning-Schaller-Wabek complex, 6 to 35 percent slopes | E4561F | 6875 | 2525824 | 2r4ff | nd041 | 1986 | 1:20000 |
Parshall, gravelly substratum-Manning fine sandy loams, 2 to 6 percent slopes | E4581B | 5635 | 2525826 | 2r4fn | nd041 | 1986 | 1:20000 |
Manning fine sandy loam, 2 to 6 percent slopes | E4585B | 4512 | 2525827 | 1vzwf | nd041 | 1986 | 1:20000 |
Manning fine sandy loam, 0 to 2 percent slopes | E4585A | 4181 | 1718611 | 1vzwd | nd041 | 1986 | 1:20000 |
Parshall, gravelly substratum-Manning fine sandy loams, 0 to 2 percent slopes | E4581A | 2675 | 2525825 | 2qz8v | nd041 | 1986 | 1:20000 |
Manning-Wabek complex, 6 to 9 percent slopes | E4559C | 21 | 2755691 | 2r4fd | nd041 | 1986 | 1:20000 |
Manning fine sandy loam, 0 to 6 percent slopes | C840B | 124 | 2596709 | 2q536 | nd047 | 1992 | 1:20000 |
Manning fine sandy loam, 0 to 6 percent slopes | C840B | 294 | 2596749 | 2q536 | nd051 | 1992 | 1:24000 |
Manning-Schaller-Wabek complex, 6 to 35 percent slopes | E4561F | 4383 | 2699359 | 2r4ff | nd053 | 2003 | 1:24000 |
Manning fine sandy loam, 2 to 6 percent slopes | E4585B | 1733 | 2699361 | 1vzwf | nd053 | 2003 | 1:24000 |
Manning fine sandy loam, 0 to 2 percent slopes | E4585A | 113 | 2699360 | 1vzwd | nd053 | 2003 | 1:24000 |
Parshall, gravelly substratum-Manning fine sandy loams, 2 to 6 percent slopes | E4581B | 250 | 2755735 | 2r4fn | nd057 | 1976 | 1:20000 |
Parshall, gravelly substratum-Manning fine sandy loams, 0 to 2 percent slopes | E4581A | 67 | 2755734 | 2qz8v | nd057 | 1976 | 1:20000 |
Manning fine sandy loam, 2 to 6 percent slopes | E4585B | 4099 | 2699186 | 1vzwf | nd059 | 1998 | 1:20000 |
Wabek-Manning complex, 6 to 15 percent slopes | E4555D | 3319 | 2699227 | cdph | nd059 | 1998 | 1:20000 |
Manning fine sandy loam, 0 to 2 percent slopes | E4585A | 623 | 2699185 | 1vzwd | nd059 | 1998 | 1:20000 |
Manning-Wabek complex, 6 to 9 percent slopes | E4559C | 379 | 2759682 | 2r4fd | nd059 | 1998 | 1:20000 |
Parshall, gravelly substratum-Manning fine sandy loams, 0 to 2 percent slopes | E4581A | 369 | 2759686 | 2qz8v | nd059 | 1998 | 1:20000 |
Manning-Schaller-Wabek complex, 6 to 35 percent slopes | E4561F | 86 | 2759683 | 2r4ff | nd059 | 1998 | 1:20000 |
Parshall, gravelly substratum-Manning fine sandy loams, 2 to 6 percent slopes | E4581B | 470 | 2755719 | 2r4fn | nd065 | 1971 | 1:20000 |
Parshall, gravelly substratum-Manning fine sandy loams, 0 to 2 percent slopes | E4581A | 31 | 2755718 | 2qz8v | nd065 | 1971 | 1:20000 |
Manning-Schaller-Wabek complex, 6 to 35 percent slopes | E4561F | 6924 | 2699106 | 2r4ff | nd085 | 1992 | 1:24000 |
Manning fine sandy loam, 0 to 2 percent slopes | E4585A | 2629 | 2699104 | 1vzwd | nd085 | 1992 | 1:24000 |
Manning fine sandy loam, 2 to 6 percent slopes | E4585B | 2206 | 2699105 | 1vzwf | nd085 | 1992 | 1:24000 |
Manning-Wabek complex, 6 to 9 percent slopes | E4559C | 991 | 2699107 | 2r4fd | nd085 | 1992 | 1:24000 |
Parshall, gravelly substratum-Manning fine sandy loams, 0 to 2 percent slopes | E4581A | 837 | 2759708 | 2qz8v | nd085 | 1992 | 1:24000 |
Parshall, gravelly substratum-Manning fine sandy loams, 2 to 6 percent slopes | E4581B | 784 | 2759709 | 2r4fn | nd085 | 1992 | 1:24000 |
Manning-Schaller-Wabek complex, 6 to 35 percent slopes | E4561F | 9079 | 2715868 | 2r4ff | nd087 | 1974 | 1:20000 |
Manning-Wabek complex, 6 to 9 percent slopes | E4559C | 2732 | 2715867 | 2r4fd | nd087 | 1974 | 1:20000 |
Manning fine sandy loam, 2 to 6 percent slopes | E4585B | 2046 | 2715872 | 1vzwf | nd087 | 1974 | 1:20000 |
Manning fine sandy loam, 0 to 2 percent slopes | E4585A | 1430 | 2715871 | 1vzwd | nd087 | 1974 | 1:20000 |
Parshall, gravelly substratum-Manning fine sandy loams, 2 to 6 percent slopes | E4581B | 291 | 2758511 | 2r4fn | nd087 | 1974 | 1:20000 |
Parshall, gravelly substratum-Manning fine sandy loams, 0 to 2 percent slopes | E4581A | 55 | 2758510 | 2qz8v | nd087 | 1974 | 1:20000 |
Manning-Schaller-Wabek complex, 6 to 35 percent slopes | E4561F | 8255 | 2716021 | 2r4ff | nd089 | 1965 | 1:20000 |
Manning fine sandy loam, 0 to 2 percent slopes | E4585A | 5145 | 1713579 | 1vzwd | nd089 | 1965 | 1:20000 |
Manning fine sandy loam, 2 to 6 percent slopes | E4585B | 4701 | 1713580 | 1vzwf | nd089 | 1965 | 1:20000 |
Parshall, gravelly substratum-Manning fine sandy loams, 0 to 2 percent slopes | E4581A | 238 | 2759690 | 2qz8v | nd089 | 1965 | 1:20000 |
Parshall, gravelly substratum-Manning fine sandy loams, 2 to 6 percent slopes | E4581B | 38 | 2759691 | 2r4fn | nd089 | 1965 | 1:20000 |
Manning sandy loam, nearly level | MgA | 84 | 352522 | cttp | nd101 | 1967 | 1:20000 |
Manning sandy loam, undulating | MgB | 54 | 352523 | cttq | nd101 | 1967 | 1:20000 |
Manning fine sandy loam, 0 to 6 percent slopes | MaB | 7729 | 354636 | cx0w | sd105 | 1977 | 1:24000 |