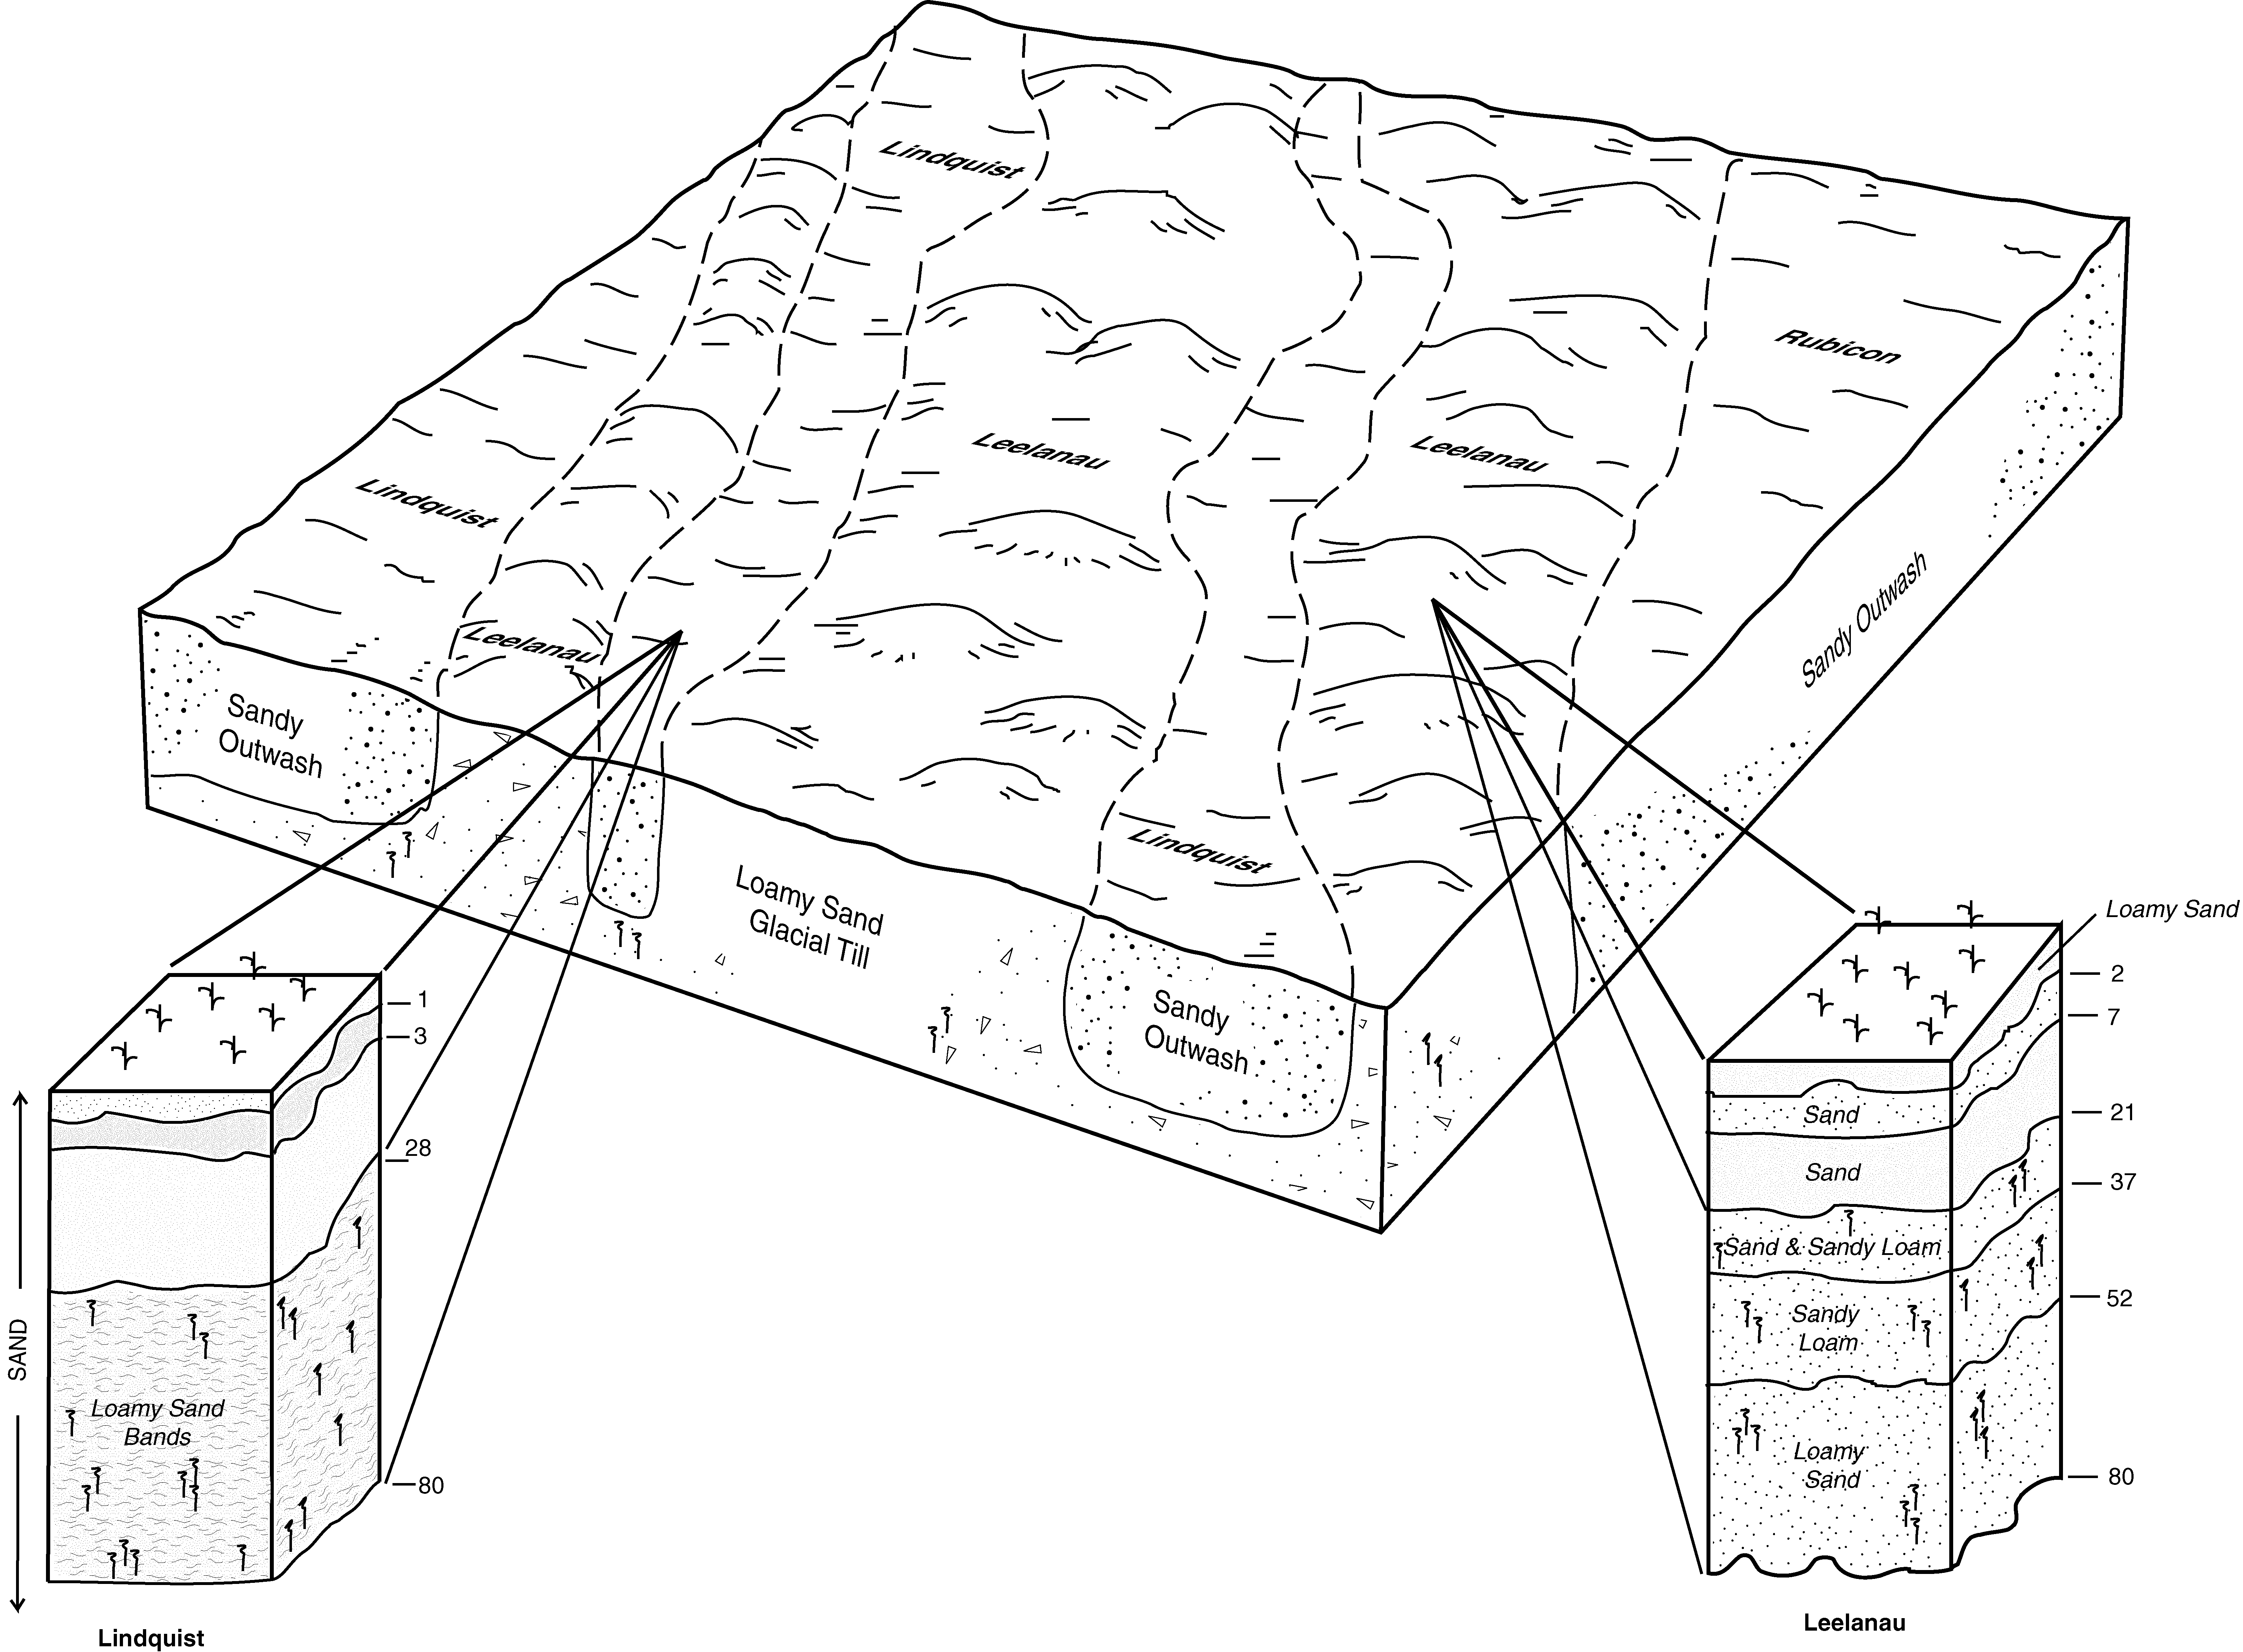
| Lindquist sand, 0 to 6 percent slopes | 147B | 545 | 2440653 | 2mxpr | mi039 | 1993 | 1:15840 |
Linquist sand, 18 to 35 percent slopes | 147E | 227 | 2440654 | 2mxps | mi039 | 1993 | 1:15840 |
Lindquist sand, 6 to 18 percent slopes | 385D | 189 | 2440663 | 2mxq2 | mi039 | 1993 | 1:15840 |
Lindquist sand, 0 to 6 percent slopes | 147B | 4235 | 190628 | 6dc9 | mi079 | 1998 | 1:12000 |
Lindquist sand, 6 to 12 percent slopes | 147C | 1652 | 190682 | 6df1 | mi079 | 1998 | 1:12000 |
Lindquist sand, 12 to 18 percent slopes | 147D | 1312 | 190687 | 6df6 | mi079 | 1998 | 1:12000 |
Lindquist sand, 18 to 35 percent slopes | 147E | 624 | 190719 | 6dg7 | mi079 | 1998 | 1:12000 |
Lindquist sand, 0 to 6 percent slopes | 147B | 2426 | 192192 | 6fzr | mi119 | 1997 | 1:12000 |
Lindquist sand, 6 to 18 percent slopes | 385D | 917 | 192267 | 6g25 | mi119 | 1997 | 1:12000 |
Lindquist sand, 18 to 35 percent slopes | 147E | 468 | 192193 | 6fzs | mi119 | 1997 | 1:12000 |
Lindquist sand, 0 to 6 percent slopes | 147B | 19213 | 191447 | 6f6q | mi137 | 1998 | 1:12000 |
Lindquist sand, 8 to 50 percent slopes, dissected | 401F | 3622 | 191494 | 6f87 | mi137 | 1998 | 1:12000 |
Lindquist sand, 6 to 12 percent slopes | 147C | 3282 | 191448 | 6f6r | mi137 | 1998 | 1:12000 |
Lindquist sand, 12 to 18 percent slopes | 147D | 2495 | 191449 | 6f6s | mi137 | 1998 | 1:12000 |
Lindquist sand, 18 to 35 percent slopes | 147E | 352 | 191450 | 6f6t | mi137 | 1998 | 1:12000 |
Lindquist sand, 6 to 18 percent slopes | 385D | 968 | 2440689 | 2mxqx | mi143 | 1999 | 1:12000 |
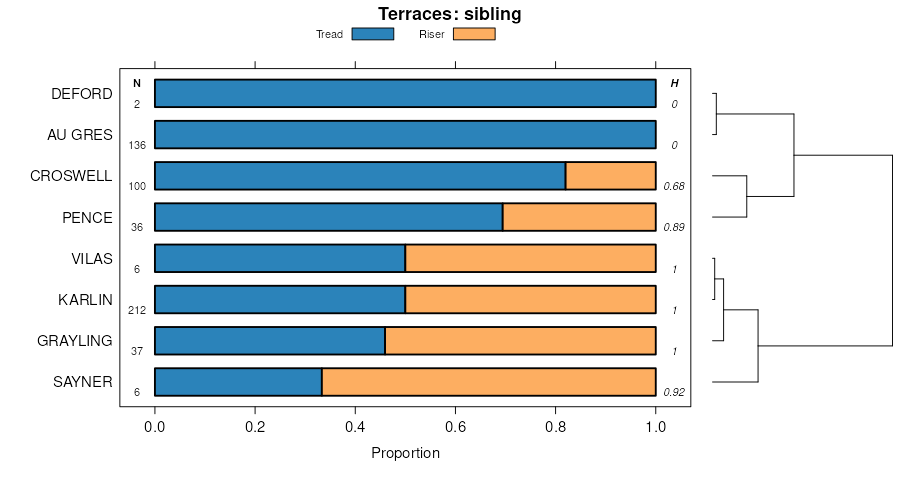
Sayner-Lindquist complex, 6 to 15 percent slopes | 9012C | 693 | 1444552 | 1kh5g | wi003 | 2006 | 1:12000 |
Sayner-Lindquist complex, 0 to 6 percent slopes | 9012B | 336 | 1444551 | 1kh5f | wi003 | 2006 | 1:12000 |
Vilas-Lindquist complex, 6 to 15 percent slopes | 3594C | 269 | 1444455 | 1kh2b | wi003 | 2006 | 1:12000 |
Vilas-Lindquist complex, 0 to 6 percent slopes | 3594B | 239 | 1444454 | 1kh29 | wi003 | 2006 | 1:12000 |
Vilas-Lindquist complex, 15 to 30 percent slopes | 3594E | 15 | 1444456 | 1kh2c | wi003 | 2006 | 1:12000 |
Sayner-Lindquist complex, 15 to 30 percent slopes | 9012E | 13 | 1444553 | 1kh5h | wi003 | 2006 | 1:12000 |
Sayner-Lindquist complex, 6 to 15 percent slopes | 9012C | 2354 | 1383944 | 1hg3c | wi007 | 2005 | 1:12000 |
Sayner-Lindquist complex, 15 to 30 percent slopes | 9012E | 2231 | 1383945 | 1hg3d | wi007 | 2005 | 1:12000 |
Sayner-Lindquist complex, 0 to 6 percent slopes | 9012B | 1868 | 1383943 | 1hg3b | wi007 | 2005 | 1:12000 |
Vilas-Lindquist complex, 6 to 15 percent slopes | 3594C | 872 | 1147412 | 17hz9 | wi007 | 2005 | 1:12000 |
Vilas-Lindquist complex, 15 to 30 percent slopes | 3594E | 158 | 1147411 | 17hz8 | wi007 | 2005 | 1:12000 |
Vilas-Lindquist complex, 0 to 6 percent slopes | 3594B | 1652 | 1701243 | 1v38t | wi051 | 2006 | 1:12000 |
Vilas-Lindquist complex, 6 to 15 percent slopes | 3594C | 517 | 1701244 | 1v38v | wi051 | 2006 | 1:12000 |
Vilas-Lindquist complex, 15 to 30 percent slopes | 3594E | 83 | 1701245 | 1v38w | wi051 | 2006 | 1:12000 |
Vilas-Lindquist complex, 6 to 15 percent slopes | 3594C | 3774 | 1598810 | 1qnpj | wi099 | 2006 | 1:12000 |
Vilas-Lindquist complex, 0 to 6 percent slopes | 3594B | 2955 | 1292271 | 1dcq5 | wi099 | 2006 | 1:12000 |
Sayner-Lindquist complex, 6 to 15 percent slopes | 9012C | 2018 | 1395743 | 1hvcz | wi099 | 2006 | 1:12000 |
Sayner-Lindquist complex, 0 to 6 percent slopes | 9012B | 1736 | 1395744 | 1hvd0 | wi099 | 2006 | 1:12000 |
Vilas-Lindquist complex, 15 to 30 percent slopes | 3594E | 838 | 1598811 | 1qnpk | wi099 | 2006 | 1:12000 |
Sayner-Lindquist complex, 15 to 30 percent slopes | 9012E | 232 | 1395742 | 1hvcy | wi099 | 2006 | 1:12000 |
Vilas-Lindquist complex, 0 to 6 percent slopes | 3594B | 193 | 1145158 | 17fml | wi107 | 2006 | 1:12000 |
Vilas-Lindquist complex, 6 to 15 percent slopes | 3594C | 88 | 1145160 | 17fmn | wi107 | 2006 | 1:12000 |
Vilas-Lindquist complex, 0 to 6 percent slopes | 3594B | 7079 | 1017816 | 1353s | wi113 | 2006 | 1:12000 |
Vilas-Lindquist complex, 6 to 15 percent slopes | 3594C | 7014 | 1017820 | 1353x | wi113 | 2006 | 1:12000 |
Vilas-Lindquist complex, 15 to 30 percent slopes | 3594E | 2257 | 1017819 | 1353w | wi113 | 2006 | 1:12000 |
Sayner-Lindquist complex, 6 to 15 percent slopes | 9012C | 1662 | 1386111 | 1hjc8 | wi113 | 2006 | 1:12000 |
Sayner-Lindquist complex, 15 to 30 percent slopes | 9012E | 653 | 1386110 | 1hjc7 | wi113 | 2006 | 1:12000 |
Sayner-Lindquist complex, 0 to 6 percent slopes | 9012B | 207 | 1386112 | 1hjc9 | wi113 | 2006 | 1:12000 |


