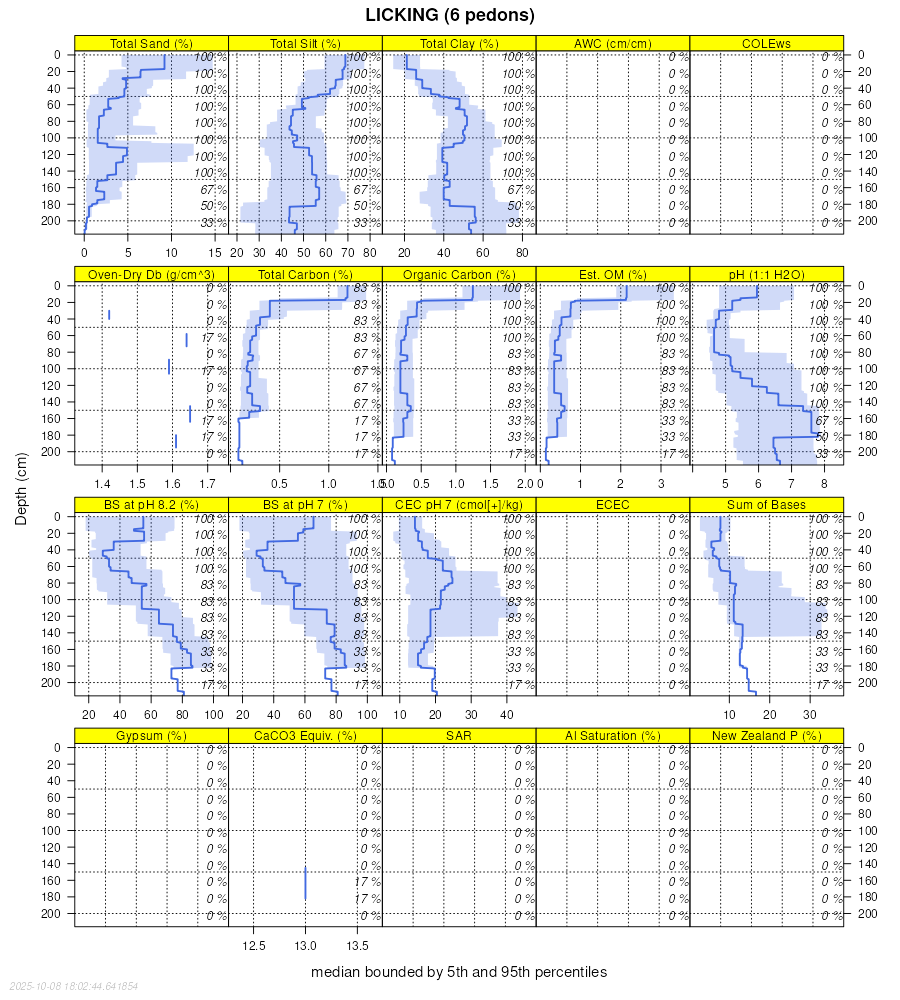
Official Series Description


Lab Data Summary

Aggregate lab data for the LICKING soil series. This aggregation is based on all pedons with a current taxon name of LICKING, and applied along 1-cm thick depth slices. Solid lines are the slice-wise median, bounded on either side by the interval defined by the slice-wise 5th and 95th percentiles. The median is the value that splits the data in half. Five percent of the data are less than the 5th percentile, and five percent of the data are greater than the 95th percentile. Values along the right hand side y-axis describe the proportion of pedon data that contribute to aggregate values at this depth. For example, a value of "90%" at 25cm means that 90% of the pedons correlated to LICKING were used in the calculation. Source: KSSL snapshot . Methods used to assemble the KSSL snapshot used by SoilWeb / SDE

Click the image to view it full size.

Pedons used in the lab summary:

MLRALab IDPedon IDTaxonnameCINSSL / NASIS ReportsLink To SoilWeb GMap
120A86KY-139-00986KY-139-009Licking4Primary | Supplementary | Taxonomy | Pedon | Water Retention | Correlation | Andic Soil Properties37.3784027,-88.3125381
n/aSK-0291965-OH151-029Licking4Primary | Supplementary | Taxonomy | Pedon | Water Retention | Correlation | Andic Soil Propertiesn/a
n/aWS-0021966-OH167-002Licking4Primary | Supplementary | Taxonomy | Pedon | Water Retention | Correlation | Andic Soil Propertiesn/a
n/aWS-0311971-OH167-031Licking3Primary | Supplementary | Taxonomy | Pedon | Water Retention | Correlation | Andic Soil Propertiesn/a
n/aMS-0141977-OH119-014Licking4Primary | Supplementary | Taxonomy | Pedon | Water Retention | Correlation | Andic Soil Propertiesn/a
n/aPK-0051980-OH131-005Licking5Primary | Supplementary | Taxonomy | Pedon | Water Retention | Correlation | Andic Soil Propertiesn/a

Water Balance

Monthly water balance estimated using a leaky-bucket style model for the LICKING soil series. Monthly precipitation (PPT) and potential evapotranspiration (PET) have been estimated from the 50th percentile of gridded values (PRISM 1981-2010) overlapping with the extent of SSURGO map units containing each series as a major component. Monthly PET values were estimated using the method of Thornthwaite (1948). These (and other) climatic parameters are calculated with each SSURGO refresh and provided by the fetchOSD function of the soilDB package. Representative water storage values (“AWC” in the figures) were derived from SSURGO by taking the 50th percentile of profile-total water storage (sum[awc_r * horizon thickness]) for each soil series. Note that this representation of “water storage” is based on the average ability of most plants to extract soil water between 15 bar (“permanent wilting point”) and 1/3 bar (“field capacity”) matric potential. Soil moisture state can be roughly interpreted as “dry” when storage is depleted, “moist” when storage is between 0mm and AWC, and “wet” when there is a surplus. Clearly there are a lot of assumptions baked into this kind of monthly water balance. This is still a work in progress.

Click the image to view it full size.


Click the image to view it full size.

Sibling Summary

Siblings are those soil series that occur together in map units, in this case with the LICKING series. Sketches are arranged according to their subgroup-level taxonomic structure. Source: SSURGO snapshot , parsed OSD records and snapshot of SC database .

Click the image to view it full size.

Select annual climate data summaries for the LICKING series and siblings. Series are sorted according to hierarchical clustering of median values. Source: SSURGO map unit geometry and 1981-2010, 800m PRISM data .

Click the image to view it full size.

Geomorphic description summaries for the LICKING series and siblings. Series are sorted according to hierarchical clustering of proportions and relative hydrologic position within an idealized landform (e.g. top to bottom). Most soil series (SSURGO components) are associated with a hillslope position and one or more landform-specific positions: hills, mountain slopes, terraces, and/or flats. Proportions can be interpreted as an aggregate representation of geomorphic membership. The values printed to the left (number of component records) and right (Shannon entropy) of stacked bars can be used to judge the reliability of trends. Small Shannon entropy values suggest relatively consistent geomorphic association, while larger values suggest lack thereof. Source: SSURGO component records .

Click the image to view it full size.

Click the image to view it full size.

Click the image to view it full size.

Click the image to view it full size.

Click the image to view it full size.

Competing Series

Soil series competing with LICKING share the same family level classification in Soil Taxonomy. Source: parsed OSD records and snapshot of the SC database .

Click the image to view it full size.

Select annual climate data summaries for the LICKING series and competing. Series are sorted according to hierarchical clustering of median values. Source: SSURGO map unit geometry and 1981-2010, 800m PRISM data .

Click the image to view it full size.

Geomorphic description summaries for the LICKING series and competing. Series are sorted according to hierarchical clustering of proportions and relative hydrologic position within an idealized landform (e.g. top to bottom). Proportions can be interpreted as an aggregate representation of geomorphic membership. Most soil series (SSURGO components) are associated with a hillslope position and one or more landform-specific positions: hills, mountain slopes, terraces, and/or flats. The values printed to the left (number of component records) and right (Shannon entropy) of stacked bars can be used to judge the reliability of trends. Shannon entropy values close to 0 represent soil series with relatively consistent geomorphic association, while values close to 1 suggest lack thereof. Source: SSURGO component records .

Click the image to view it full size.

Click the image to view it full size.

There are insufficient data to create the 3D mountains figure.

Click the image to view it full size.

Click the image to view it full size.

Soil series sharing subgroup-level classification with LICKING, arranged according to family differentiae. Hovering over a series name will print full classification and a small sketch from the OSD. Source: snapshot of SC database .

Block Diagrams

Click a link below to display the diagram. Note that these diagrams may be from multiple survey areas.

  1. KY-2012-02-01-01 | Livingston County - September 1993

    Relationship of soils to topography and underlying material in the Huntington-Otwell-Lindside-Wheeling general soil map unit (Soil Survey of Livingston County, Kentucky; September 1993).

  2. OH-2010-09-29-25 | Vinton County - 2004

    Typical pattern of soils and parent material in the Omulga-Philo general soil map unit (Soil Survey of Vinton County, Ohio; 2004).

Map Units

Map units containing LICKING as a major component. Limited to 250 records.

Map Unit Name Symbol Map Unit Area (ac) Map Unit Key National Map Unit Symbol Soil Survey Area Publication Date Map Scale
Licking silt loam, 2 to 6 percent slopesLcB1348549325lfm5ky13919891:20000
Licking silty clay loam, 6 to 12 percent slopes, severely erodedLkC3635549326lfm6ky13919891:20000
Licking silty clay loam, 12 to 20 percent slopesLlD2769552051ljg3ky60319681:15840
Licking silty clay loam, 6 to 12 percent slopesLlC2573552050ljg2ky60319681:15840
Licking silt loam, 2 to 6 percent slopesLkB1143552049ljg1ky60319681:15840
Licking silt loam, 0 to 2 percent slopesLkA499552048ljg0ky60319681:15840
Licking silt loam, 0 to 2 percent slopesLtA454550404lgqzky60519751:20000
Licking silt loam, 6 to 12 percent slopesLcC3220551962ljc7ky61919781:15840
Licking silt loam, 12 to 20 percent slopesLcD1660551963ljc8ky61919781:15840
Licking silt loam, 2 to 6 percent slopesLcB1045551961ljc6ky61919781:15840
Licking silt loam, 1 to 6 percent slopesLkB24251700935pzwoh00119871:15840
Licking silt loam, 6 to 15 percent slopes, erodedLkC213591700945pzxoh00119871:15840
Licking silt loam, 15 to 25 percent slopes, erodedLkD23491700955pzyoh00119871:15840
Licking silt loam, 2 to 6 percent slopesLic1B1128024418432myy4oh00919811:15840
Licking silt loam, 6 to 12 percent slopes, erodedLic1C276024418442myy5oh00919811:15840
Licking silt loam, 1 to 4 percent slopes, occasionally floodedLck1BO3324418452myy6oh00919811:15840
Licking silt loam, 6 to 12 percent slopes, erodedLic1C2111124504332n7w7oh05319881:15840
Licking silt loam, 2 to 6 percent slopesLic1B189424504322n7w6oh05319881:15840
Licking silt loam, 12 to 18 percent slopes, erodedLic1D287124504342n7w8oh05319881:15840
Licking silt loam, 6 to 12 percent slopes, erodedLic1C272124506612n83loh07319861:15840
Licking silt loam, 2 to 6 percent slopesLic1B137224506602n83koh07319861:15840
Licking silt loam, 12 to 18 percent slopes, erodedLic1D237224506622n83moh07319861:15840
Licking silt loam, 2 to 6 percent slopesLic1B177824510992n8kqoh08719891:15840
Licking silt loam, 6 to 12 percent slopes, erodedLic1C243324511002n8kroh08719891:15840
Licking silt loam, 6 to 12 percent slopes, erodedLic1C2140724512772n8rgoh10519911:15840
Licking silt loam, 2 to 6 percent slopesLic1B152024512762n8rfoh10519911:15840
Licking silt loam, 12 to 18 percent slopes, erodedLic1D244324512782n8rhoh10519911:15840
Licking silt loam, 2 to 6 percent slopesLic1B145324524872nb0hoh11519921:15840
Licking silt loam, 1 to 4 percent slopes, occasionally floodedLck1BO31424524862nb0goh11519921:15840
Licking silt loam, 6 to 12 percent slopes, erodedLic1C231424524882nb0joh11519921:15840
Licking silt loam, 2 to 6 percent slopesLcB4602880239nq2oh15119671:15840
Licking silt loam, 12 to 25 percent slopes, moderately erodedLcE22682880269nq5oh15119671:15840
Licking silt loam, 6 to 12 percent slopesLcC2352880249nq3oh15119671:15840
Licking silt loam, 6 to 12 percent slopes, moderately erodedLcC21272880259nq4oh15119671:15840
Licking silt loam, 0 to 2 percent slopesLcA732880229nq1oh15119671:15840
Licking silt loam, 12 to 25 percent slopes, moderately erodedLcE2115894311qbxzoh15719811:15840
Licking silt loam, 6 to 12 percent slopes, erodedLic1C28324533622nbxqoh16319981:15840
Licking silt loam, 2 to 6 percent slopesLic1B11724533612nbxpoh16319981:15840
Licking silt loam, 12 to 18 percent slopes, erodedLic1D2624533632nbxroh16319981:15840
Licking silt loam, 6 to 12 percent slopes, erodedLic1C223323960942lfbcoh16719731:15840
Licking silt loam, 2 to 6 percent slopesLic1B113723960932lfbboh16719731:15840
Licking silt loam, 12 to 18 percent slopes, erodedLic1D26723960952lfbdoh16719731:15840
Licking silt loam, 8 to 15 percent slopesLkC187514703k8lbwv61219841:20000

Map of Series Extent

Approximate geographic distribution of the LICKING soil series. To learn more about how this distribution was mapped, or to compare this soil series extent to others, use the Series Extent Explorer (SEE) application. Source: generalization of SSURGO geometry .