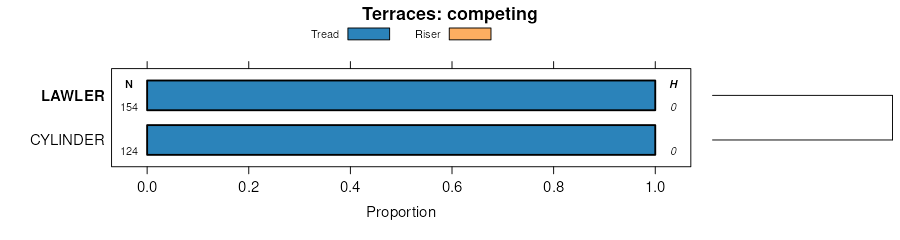
| Lawler loam, 0 to 2 percent slopes, rarely flooded | 1226 | 1301 | 2407079 | 2tgsc | ia011 | 1977 | 1:15840 |
Lawler loam, 0 to 2 percent slopes, rarely flooded | 1226 | 4400 | 611917 | 2tgsc | ia013 | 2001 | 1:12000 |
Lawler-Urban land complex, 0 to 2 percent slopes | 4226 | 339 | 413314 | fw2q | ia013 | 2001 | 1:12000 |
Lawler loam, 0 to 2 percent slopes, rarely flooded | 1226 | 5130 | 1859803 | 2tgsc | ia017 | 2008 | 1:12000 |
Lawler loam, 0 to 2 percent slopes, rarely flooded | 1226 | 3309 | 2407081 | 2tgsc | ia019 | 1978 | 1:15840 |
Lawler loam, 0 to 2 percent slopes, rarely flooded | 1226 | 12386 | 2407082 | 2tgsc | ia023 | 1978 | 1:15840 |
Lawler loam, 0 to 2 percent slopes, rarely flooded | 1226 | 6948 | 2407084 | 2tgsc | ia033 | 1978 | 1:15840 |
Lawler loam, 0 to 2 percent slopes, rarely flooded | 1226 | 6311 | 2407092 | 2tgsc | ia037 | 1989 | 1:15840 |
Lawler loam, 0 to 2 percent slopes, rarely flooded | 1226 | 143 | 2407085 | 2tgsc | ia043 | 1979 | 1:15840 |
Lawler loam, 0 to 2 percent slopes, rarely flooded | 1226 | 1701 | 2407080 | 2tgsc | ia045 | 1978 | 1:15840 |
Lawler loam, 0 to 2 percent slopes, rarely flooded | 1226 | 4404 | 2407088 | 2tgsc | ia055 | 1984 | 1:15840 |
Lawler loam, 0 to 2 percent slopes, rarely flooded | 1226 | 4877 | 2407077 | 2tgsc | ia065 | 1975 | 1:15840 |
Lawler loam, 0 to 2 percent slopes, rarely flooded | 1226 | 4673 | 2407091 | 2tgsc | ia067 | 1989 | 1:15840 |
Lawler loam, 0 to 2 percent slopes, rarely flooded | 1226 | 8429 | 2407078 | 2tgsc | ia069 | 1977 | 1:15840 |
Lawler loam, 0 to 2 percent slopes, rarely flooded | 1226 | 4089 | 2407076 | 2tgsc | ia075 | 1973 | 1:15840 |
Lawler loam, 0 to 2 percent slopes, rarely flooded | 1226 | 2387 | 2407087 | 2tgsc | ia083 | 1982 | 1:15840 |
Lawler loam, 0 to 2 percent slopes, rarely flooded | 1226 | 3718 | 2407074 | 2tgsc | ia089 | 1969 | 1:15840 |
Lawler loam, 0 to 2 percent slopes, rarely flooded | 1226 | 2692 | 2424464 | 2tgsc | ia099 | 1975 | 1:15840 |
Lawler loam, 32 to 40 inches to sand and gravel, 0 to 2 percent slopes | 226 | 1168 | 407982 | fpjq | ia103 | 1979 | 1:15840 |
Lawler loam, 0 to 2 percent slopes, rarely flooded | 1226 | 426 | 2407086 | 2tgsc | ia103 | 1979 | 1:15840 |
Lawler loam, 0 to 2 percent slopes, rarely flooded | 1226 | 1034 | 2407089 | 2tgsc | ia105 | 1988 | 1:15840 |
Lawler loam, 0 to 2 percent slopes, rarely flooded | 1226 | 1668 | 2424465 | 2tgsc | ia111 | 1976 | 1:15840 |
Lawler loam, 0 to 2 percent slopes, rarely flooded | 1226 | 4360 | 2407071 | 2tgsc | ia113 | 1970 | 1:15840 |
Lawler-Urban land complex, 0 to 2 % slopes, rarely flooded | 4226 | 46 | 2606458 | 2qcrp | ia113 | 1970 | 1:15840 |
Lawler loam, 0 to 2 percent slopes, rarely flooded | 1226 | 1876 | 2407083 | 2tgsc | ia127 | 1978 | 1:15840 |
Lawler loam, 0 to 2 percent slopes, rarely flooded | 1226 | 3878 | 2407073 | 2tgsc | ia131 | 1971 | 1:15840 |
Lawler loam, 0 to 2 percent slopes, rarely flooded | 1226 | 1410 | 2424466 | 2tgsc | ia163 | 1989 | 1:15840 |
Lawler loam, 0 to 2 percent slopes, rarely flooded | 1226 | 237 | 2407090 | 2tgsc | ia171 | 1989 | 1:15840 |
Lawler loam, 0 to 2 percent slopes, rarely flooded | 1226 | 6987 | 2478714 | 2tgsc | ia195 | 2012 | 1:12000 |
Lawler loam, 0 to 2 percent slopes | 647A | 2727 | 1862771 | 20jcd | il011 | 2007 | 1:12000 |
Lawler clay loam, bedrock substratum, 0 to 2 percent slopes | 645A | 254 | 175209 | 5w9x | il067 | 1993 | 1:15840 |
Lawler loam, 0 to 2 percent slopes | 647A | 86 | 1412391 | 1jdq0 | il103 | 2004 | 1:12000 |
Lawler loam, 0 to 2 percent slopes | 647A | 594 | 198747 | 6nt6 | il161 | 2002 | 1:12000 |
Lawler loam, 0 to 2 percent slopes | 647A | 8209 | 793086 | vm8f | il195 | 2003 | 1:12000 |
Lawler-Marshan complex, 0 to 2 percent slopes | M514A | 1684 | 1384958 | 1hh52 | mn039 | 2005 | 1:12000 |
Lawler silt loam | 485 | 5000 | 400469 | ffqc | mn099 | 1986 | 1:15840 |
Lawler loam | 485 | 2434 | 400798 | fg1z | mn109 | 1977 | 1:15840 |
Lawler loam, bedrock substratum | 1937 | 577 | 429003 | gddt | mn169 | 1987 | 1:20000 |
Lawler silt loam, 0 to 3 percent slopes | 488A | 1149 | 425291 | g8k2 | wi045 | 1969 | 1:12000 |
Lawler loam, 0 to 2 percent slopes | 478A | 936 | 425290 | g8k1 | wi045 | 1969 | 1:12000 |
Lawler silt loam, 0 to 3 percent slopes | 488A | 1481 | 1698618 | 1v0k4 | wi093 | 2006 | 1:12000 |
Lawler silt loam, 0 to 3 percent slopes | 488A | 1341 | 422159 | g591 | wi109 | 1975 | 1:15840 |