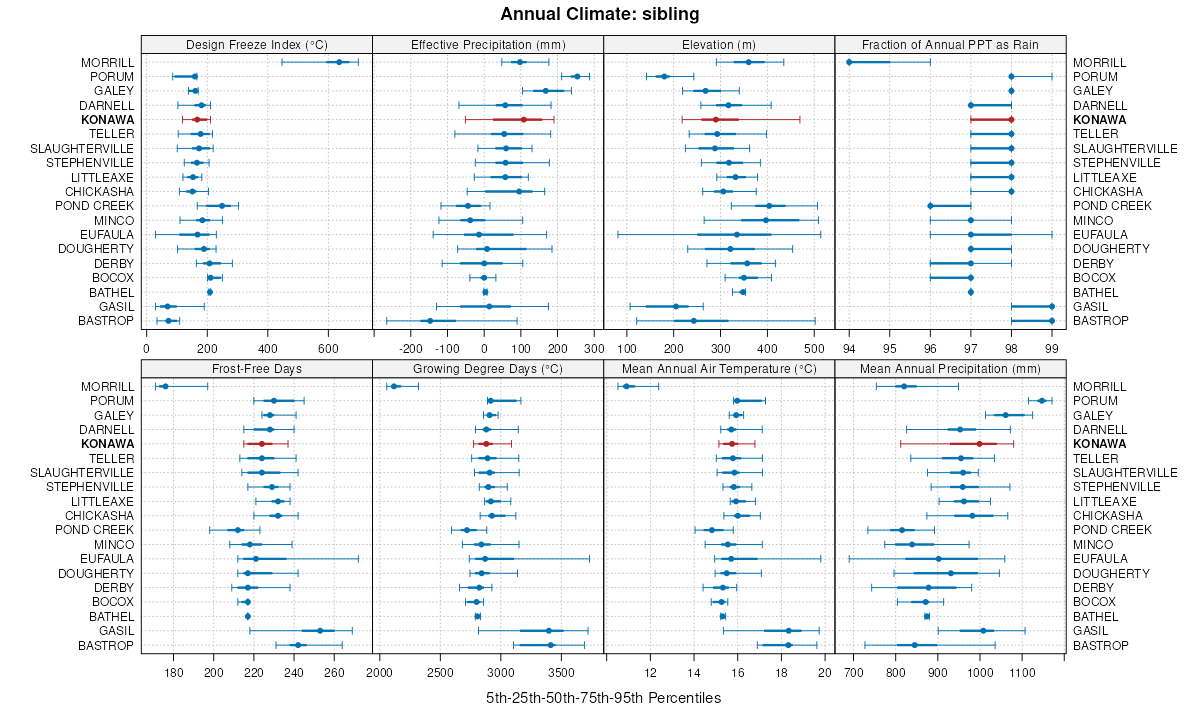
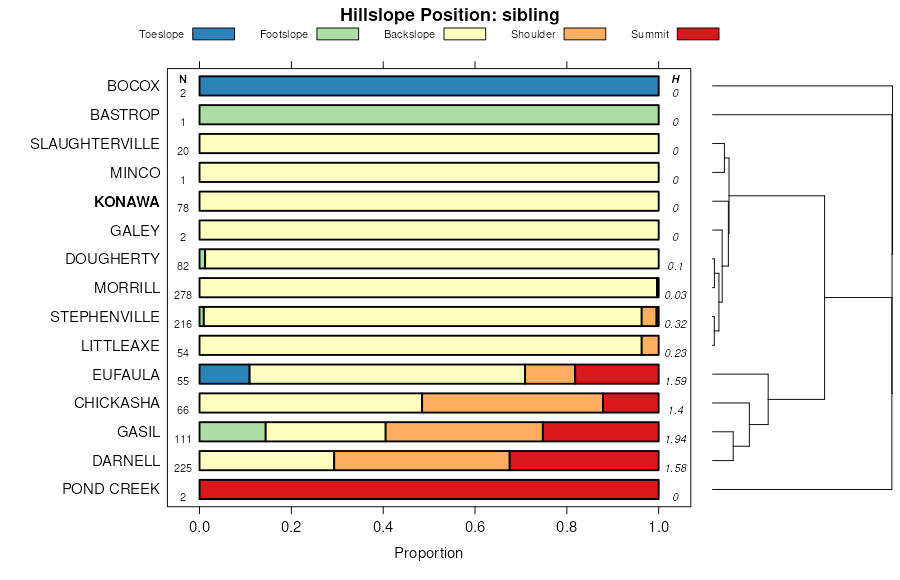
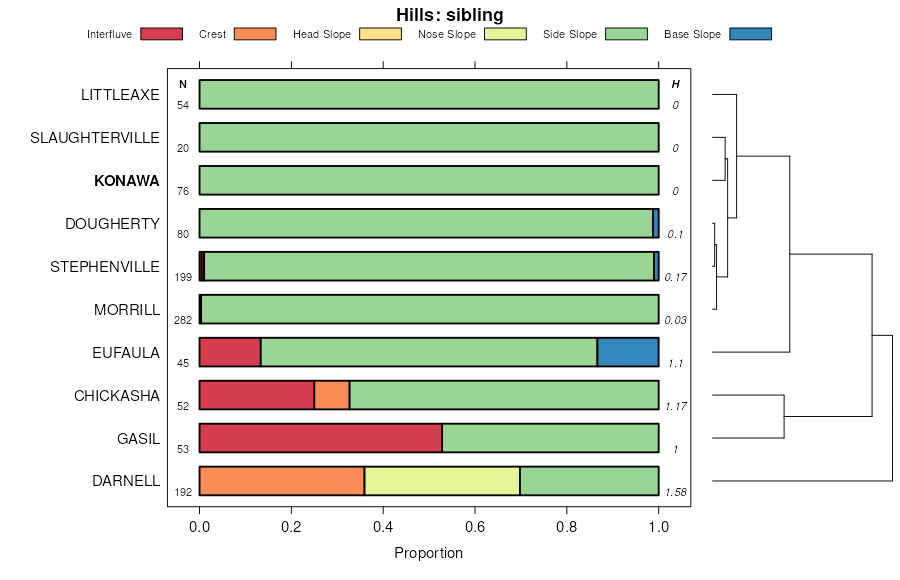
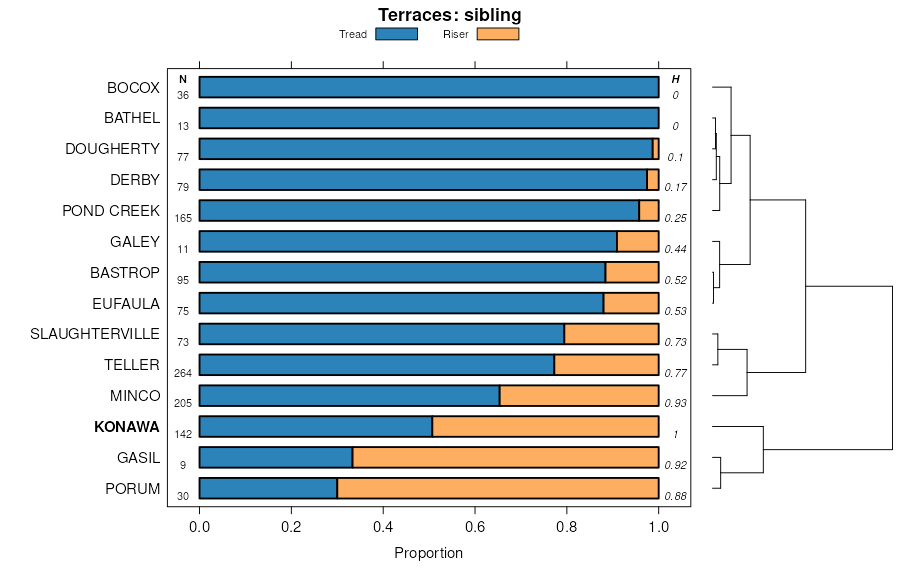
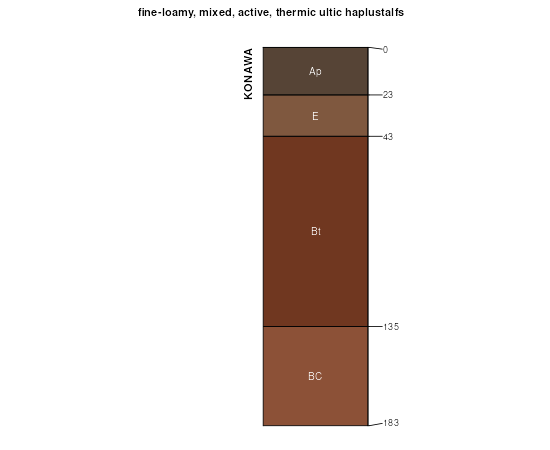
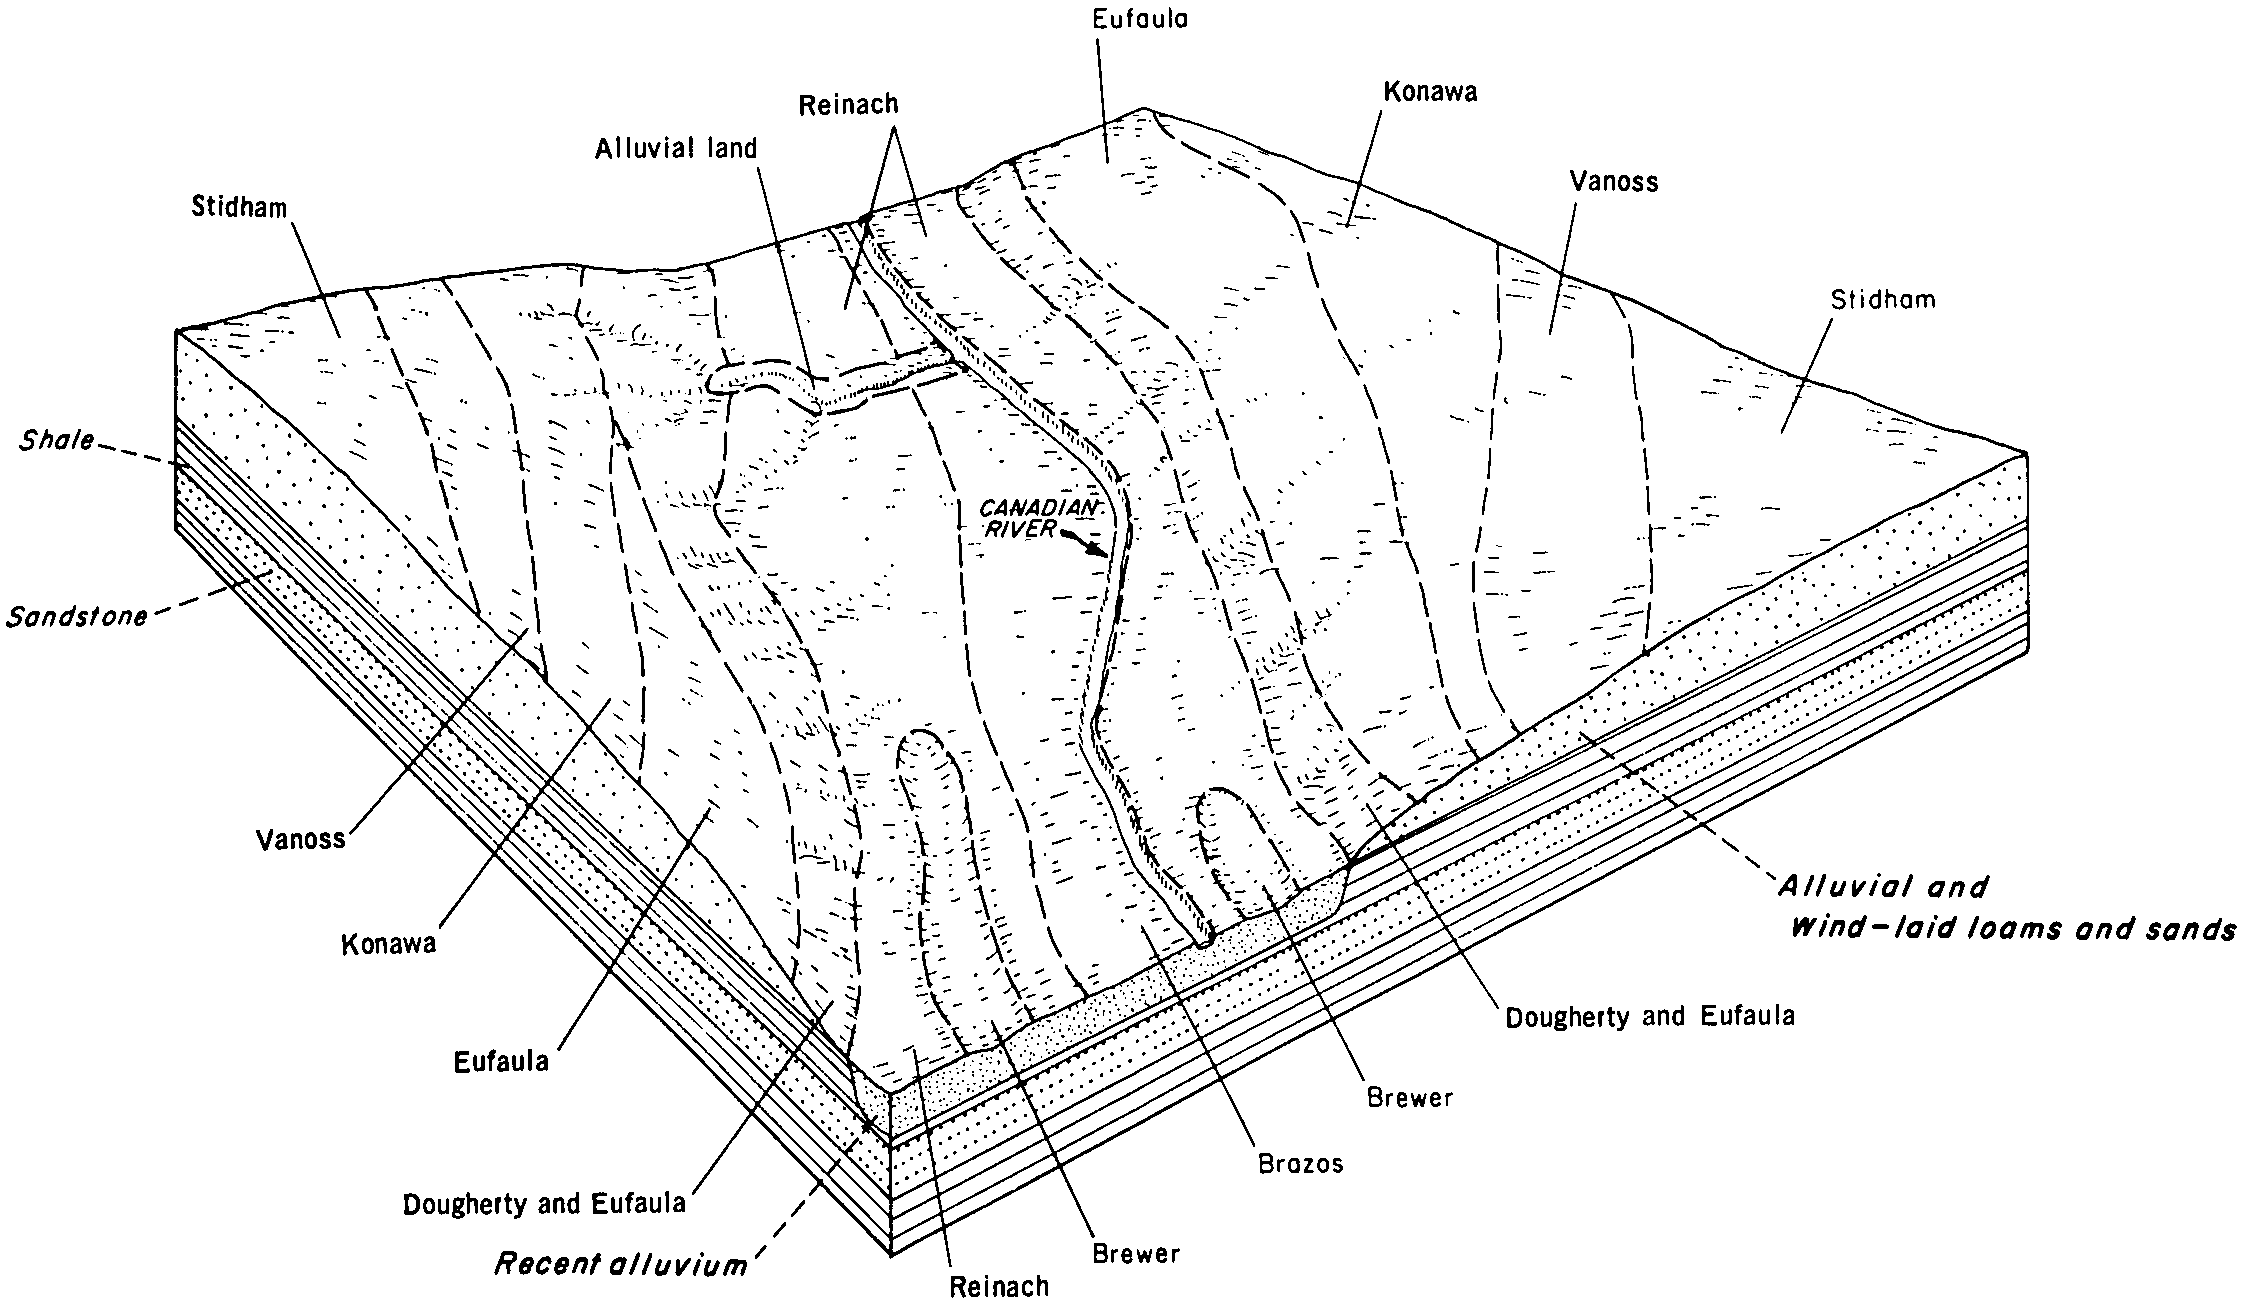
| Konawa fine sandy loam, 8 to 12 percent slopes | 7282 | 339 | 1473495 | 1lg93 | ks177 | 1966 | 1:24000 |
Konawa loamy fine sand, 3 to 8 percent slopes | KoC | 10796 | 381735 | 2tq7g | ok011 | 1965 | 1:24000 |
Konawa loamy fine sand, 0 to 3 percent slopes | KoB | 5847 | 381734 | 2tq7f | ok011 | 1965 | 1:24000 |
Dougherty-Konawa loamy fine sands association, 0 to 3 percent slopes | DoB | 11666 | 381881 | 30g72 | ok015 | 1967 | 1:24000 |
Konawa loamy fine sand, 1 to 5 percent slopes, eroded | KoC2 | 6538 | 381894 | dtd5 | ok015 | 1967 | 1:24000 |
Konawa loamy fine sand, 3 to 8 percent slopes, severely eroded | KsD3 | 1470 | 381895 | 2tq7j | ok015 | 1967 | 1:24000 |
Konawa loamy fine sand, 3 to 8 percent slopes | KwD | 6814 | 381956 | 2tq7g | ok017 | 1972 | 1:24000 |
Konawa fine sandy loam, 3 to 5 percent slopes | GdC | 3412 | 381943 | 2tq7d | ok017 | 1972 | 1:24000 |
Konawa fine sandy loam, 3 to 8 percent slopes, severely eroded | GdD3 | 2531 | 381946 | 2tq7n | ok017 | 1972 | 1:24000 |
Konawa fine sandy loam, 5 to 8 percent slopes | GdD | 2153 | 381945 | dtft | ok017 | 1972 | 1:24000 |
Konawa fine sandy loam, 3 to 8 percent slopes, eroded | GdC2 | 1451 | 381944 | 2tq7l | ok017 | 1972 | 1:24000 |
Konawa fine sandy loam, 1 to 3 percent slopes | GdB | 1195 | 381942 | 2tq7c | ok017 | 1972 | 1:24000 |
Konawa fine sandy loam, 0 to 1 percent slopes | 21 | 3590 | 382004 | dthq | ok019 | 1977 | 1:24000 |
Konawa fine sandy loam, 1 to 3 percent slopes | 22 | 2039 | 382005 | 2tq7c | ok019 | 1977 | 1:24000 |
Konawa fine sandy loam, 8 to 20 percent slopes | 23 | 1257 | 382006 | dths | ok019 | 1977 | 1:24000 |
Dougherty-Konawa complex, 3 to 8 percent slopes | 11 | 779 | 382084 | dtl9 | ok027 | 1984 | 1:24000 |
Konawa loamy fine sand, 3 to 8 percent slopes | KoC | 6046 | 382183 | 2tq7g | ok031 | 1965 | 1:24000 |
Konawa loamy fine sand, 3 to 8 percent slopes, severely eroded | KnB3 | 4340 | 382181 | 2tq7j | ok031 | 1965 | 1:24000 |
Konawa loamy fine sand, 3 to 8 percent slopes, eroded | KoC2 | 3981 | 382184 | 2tq7h | ok031 | 1965 | 1:24000 |
Konawa loamy fine sand, 0 to 3 percent slopes | KoB | 1754 | 382182 | 2tq7f | ok031 | 1965 | 1:24000 |
Konawa and Gasil soils, 5 to 8 percent slopes | Dh | 7791 | 382281 | dtsn | ok037 | 1952 | 1:24000 |
Konawa-Gullied land complex, 3 to 8 percent slopes | Bd | 6892 | 382267 | 2tq7k | ok037 | 1952 | 1:24000 |
Konawa and Gasil soils, 3 to 5 percent slopes | Df | 6571 | 382279 | dtsl | ok037 | 1952 | 1:24000 |
Konawa and Gasil soils, 1 to 3 percent slopes | Dg | 1108 | 382280 | dtsm | ok037 | 1952 | 1:24000 |
Konawa fine sandy loam, 3 to 8 percent slopes, eroded | 39 | 3821 | 382571 | 2tq7l | ok049 | 1982 | 1:24000 |
Konawa loamy fine sand, 3 to 8 percent slopes, gullied | 36 | 1789 | 382568 | dv2x | ok049 | 1982 | 1:24000 |
Konawa loamy fine sand, 3 to 8 percent slopes | 34 | 1714 | 382566 | 2tq7g | ok049 | 1982 | 1:24000 |
Konawa loamy fine sand, 3 to 8 percent slopes, eroded | 35 | 1508 | 382567 | 2tq7h | ok049 | 1982 | 1:24000 |
Konawa fine sandy loam, 5 to 8 percent slopes | 40 | 970 | 382573 | dv32 | ok049 | 1982 | 1:24000 |
Konawa fine sandy loam, 1 to 3 percent slopes | 38 | 931 | 382570 | 2tq7c | ok049 | 1982 | 1:24000 |
Konawa loamy fine sand, 8 to 20 percent slopes | 37 | 542 | 382569 | dv2y | ok049 | 1982 | 1:24000 |
Konawa loamy fine sand, 0 to 3 percent slopes | 18 | 11754 | 382636 | 2tq7f | ok051 | 1975 | 1:24000 |
Konawa-Stephenville complex, 3 to 8 percent slopes, severely eroded | 19 | 9669 | 382637 | dv54 | ok051 | 1975 | 1:24000 |
Konawa fine sandy loam, 1 to 3 percent slopes | 33 | 5086 | 383297 | dvvf | ok069 | 1976 | 1:24000 |
Konawa fine sandy loam, 0 to 1 percent slopes | 32 | 2719 | 383296 | dvvd | ok069 | 1976 | 1:24000 |
Konawa loamy fine sand, 3 to 8 percent slopes, severely eroded | KoD3 | 5826 | 383514 | 2tq7j | ok081 | 1966 | 1:24000 |
Konawa loamy fine sand, 0 to 3 percent slopes | KoB | 5203 | 383513 | 2tq7f | ok081 | 1966 | 1:24000 |
Konawa loamy fine sand, 0 to 3 percent slopes | KonB | 4110 | 383635 | 2tq7f | ok083 | 1994 | 1:12000 |
Konawa loamy fine sand, 3 to 8 percent slopes, eroded | KonD2 | 3994 | 383636 | 2tq7h | ok083 | 1994 | 1:12000 |
Konawa loamy fine sand, 3 to 8 percent slopes | 23 | 4528 | 383779 | 2tq7g | ok087 | 1976 | 1:24000 |
Konawa loamy fine sand, 0 to 3 percent slopes | 22 | 1921 | 383778 | 2tq7f | ok087 | 1976 | 1:24000 |
Konawa-Gullied land complex, 3 to 8 percent slopes | 24 | 136 | 383780 | 2tq7k | ok087 | 1976 | 1:24000 |
Konawa fine sandy loam, 3 to 8 percent slopes, gullied | 19 | 9057 | 383893 | dwgn | ok095 | 1978 | 1:24000 |
Konawa fine sandy loam, 1 to 5 percent slopes, eroded | 18 | 7354 | 383892 | dwgm | ok095 | 1978 | 1:24000 |
Konawa fine sandy loam, 1 to 3 percent slopes | 17 | 1383 | 383891 | dwgl | ok095 | 1978 | 1:24000 |
Konawa fine sandy loam, 0 to 3 percent slopes | 40 | 1324 | 383947 | dwjd | ok099 | 1982 | 1:24000 |
Bastrop and Konawa soils, 3 to 8 percent slopes, gullied | 5 | 581 | 383957 | dwjq | ok099 | 1982 | 1:24000 |
Konawa fine sandy loam, 3 to 8 percent slopes | KowD | 815 | 384072 | dwnf | ok103 | 1994 | 1:24000 |
Konawa fine sandy loam, 1 to 3 percent slopes | KowB | 467 | 384071 | 2tq7c | ok103 | 1994 | 1:24000 |
Konawa-Gullied land complex, 3 to 12 percent slopes | KoGE4 | 4171 | 384174 | dwrq | ok107 | 1996 | 1:24000 |
Konawa fine sandy loam, 3 to 8 percent slopes, eroded | KowD2 | 2931 | 384177 | 2tq7l | ok107 | 1996 | 1:24000 |
Konawa fine sandy loam, 3 to 5 percent slopes | KowC | 1425 | 384176 | 2tq7d | ok107 | 1996 | 1:24000 |
Konawa fine sandy loam, 0 to 3 percent slopes | KowB | 886 | 384175 | dwrr | ok107 | 1996 | 1:24000 |
Konawa fine sandy loam, 3 to 8 percent slopes | KowD | 3636 | 384315 | dwx8 | ok109 | 1996 | 1:12000 |
Konawa-Urban land complex, 1 to 8 percent slopes | KwUD | 2868 | 384320 | dwxf | ok109 | 1996 | 1:12000 |
Konawa fine sandy loam, 1 to 3 percent slopes | KowB | 2729 | 384314 | 2tq7c | ok109 | 1996 | 1:12000 |
Konawa fine sandy loam, 3 to 8 percent slopes, eroded | KowD2 | 2698 | 384316 | 2tq7l | ok109 | 1996 | 1:12000 |
Konawa fine sandy loam, 3 to 8 percent slopes, gullied | KowD4 | 503 | 384317 | 2tq7m | ok109 | 1996 | 1:12000 |
Konawa loamy fine sand, 3 to 8 percent slopes, eroded | 28 | 1938 | 623423 | 2tq7h | ok113 | 1975 | 1:24000 |
Konawa fine sandy loam, 3 to 8 percent slopes, eroded | KowC2 | 3205 | 1675971 | 2tq7l | ok117 | 2007 | 1:24000 |
Konawa-Gullied land complex, 3 to 8 percent slopes | KoGD4 | 641 | 1675977 | 2tq7k | ok117 | 2007 | 1:24000 |
Konawa fine sandy loam, 1 to 3 percent slopes | KowB | 606 | 1677347 | 2tq7c | ok117 | 2007 | 1:24000 |
Konawa and Teller soils, 3 to 8 percent slopes, eroded | 59 | 10086 | 384558 | dx53 | ok119 | 1983 | 1:24000 |
Konawa fine sandy loam, 1 to 3 percent slopes | 24 | 5945 | 384520 | 2tq7c | ok119 | 1983 | 1:24000 |
Konawa loamy fine sand, 5 to 8 percent slopes | 23 | 5144 | 384519 | dx3v | ok119 | 1983 | 1:24000 |
Konawa loamy fine sand, 3 to 5 percent slopes, gullied | 75 | 3515 | 384576 | dx5p | ok119 | 1983 | 1:24000 |
Konawa fine sandy loam, 3 to 5 percent slopes | 22 | 1816 | 384518 | 2tq7d | ok119 | 1983 | 1:24000 |
Konawa loamy fine sand, 3 to 8 percent slopes, severely eroded | KtD3 | 10835 | 384635 | 2tq7j | ok123 | 1967 | 1:24000 |
Konawa loamy fine sand, 3 to 8 percent slopes | KsD | 7241 | 384633 | 2tq7g | ok123 | 1967 | 1:24000 |
Konawa loamy fine sand, 3 to 8 percent slopes, eroded | KsD2 | 6623 | 384634 | 2tq7h | ok123 | 1967 | 1:24000 |
Konawa fine sandy loam, 1 to 3 percent slopes | KoB | 2435 | 384631 | 2tq7c | ok123 | 1967 | 1:24000 |
Konawa fine sandy loam, 3 to 5 percent slopes | KoC | 1128 | 384632 | 2tq7d | ok123 | 1967 | 1:24000 |
Konawa fine sandy loam, 0 to 1 percent slopes | KoA | 643 | 384630 | dx7f | ok123 | 1967 | 1:24000 |
Konawa fine sandy loam, 3 to 8 percent slopes, severely eroded | 26 | 14642 | 384686 | 2tq7n | ok125 | 1975 | 1:24000 |
Konawa fine sandy loam, 3 to 5 percent slopes | 25 | 8221 | 384685 | 2tq7d | ok125 | 1975 | 1:24000 |
Konawa loamy fine sand, 3 to 8 percent slopes | 23 | 7101 | 384683 | 2tq7g | ok125 | 1975 | 1:24000 |
Konawa fine sandy loam, 1 to 3 percent slopes | 24 | 4284 | 384684 | 2tq7c | ok125 | 1975 | 1:24000 |
Konawa fine sandy loam, 3 to 8 percent slopes, eroded | 23 | 11401 | 384809 | 2tq7l | ok133 | 1976 | 1:24000 |
Konawa fine sandy loam, 3 to 8 percent slopes, gullied | 24 | 8691 | 384810 | 2tq7m | ok133 | 1976 | 1:24000 |
Konawa fine sandy loam, 3 to 5 percent slopes | 22 | 5952 | 384808 | 2tq7d | ok133 | 1976 | 1:24000 |
Konawa fine sandy loam, 1 to 3 percent slopes | 21 | 2829 | 384807 | 2tq7c | ok133 | 1976 | 1:24000 |
Dougherty and Konawa soils, 3 to 8 percent slopes | DoC | 4656 | 384858 | dxgs | ok137 | 1960 | 1:24000 |
Dougherty-Konawa loamy fine sands association, 0 to 3 percent slopes | DoB | 1464 | 384857 | 30g72 | ok137 | 1960 | 1:24000 |
Konawa and Dougherty soils, 1 to 5 percent slopes, eroded | DuB2 | 354 | 384859 | dxgt | ok137 | 1960 | 1:24000 |
Konawa fine sandy loam, 5 to 8 percent slopes | KoD | 945 | 365531 | d8cb | tx147 | 1989 | 1:24000 |
Konawa loamy fine sand, 3 to 8 percent slopes | KoC | 4652 | 374485 | dkp5 | tx612 | 1973 | 1:20000 |
Konawa loamy fine sand, 1 to 3 percent slopes | KoB | 1090 | 374484 | dkp4 | tx612 | 1973 | 1:20000 |