Official Series Description


Lab Data Summary

Aggregate lab data for the HILLSDALE soil series. This aggregation is based on all pedons with a current taxon name of HILLSDALE, and applied along 1-cm thick depth slices. Solid lines are the slice-wise median, bounded on either side by the interval defined by the slice-wise 5th and 95th percentiles. The median is the value that splits the data in half. Five percent of the data are less than the 5th percentile, and five percent of the data are greater than the 95th percentile. Values along the right hand side y-axis describe the proportion of pedon data that contribute to aggregate values at this depth. For example, a value of "90%" at 25cm means that 90% of the pedons correlated to HILLSDALE were used in the calculation. Source: KSSL snapshot . Methods used to assemble the KSSL snapshot used by SoilWeb / SDE

Click the image to view it full size.

Pedons used in the lab summary:

MLRALab IDPedon IDTaxonnameCINSSL / NASIS ReportsLink To SoilWeb GMap
111CSA69031969IN141003Hillsdale2Primary | Supplementary | Taxonomy | Pedon | Water Retention | Correlation | Andic Soil Properties41.5856556,-86.2873
111CSA69041969IN141004Hillsdale2Primary | Supplementary | Taxonomy | Pedon | Water Retention | Correlation | Andic Soil Properties41.5418778,-86.2909472
111CKO72021972IN085002Hillsdale2Primary | Supplementary | Taxonomy | Pedon | Water Retention | Correlation | Andic Soil Properties41.2648,-85.765625
111CWH74111974IN181011Hillsdale2Primary | Supplementary | Taxonomy | Pedon | Water Retention | Correlation | Andic Soil Properties40.8632083,-86.7417444
111CDK78051978IN033005Hillsdale2Primary | Supplementary | Taxonomy | Pedon | Water Retention | Correlation | Andic Soil Properties41.5195611,-85.1881778
98LG74101974IN087010Hillsdale3Primary | Supplementary | Taxonomy | Pedon | Water Retention | Correlation | Andic Soil Properties41.7570722,-85.3171167
98LG74111974IN087011Hillsdale3Primary | Supplementary | Taxonomy | Pedon | Water Retention | Correlation | Andic Soil Properties41.759675,-85.316125
98LG74131974IN087013Hillsdale3Primary | Supplementary | Taxonomy | Pedon | Water Retention | Correlation | Andic Soil Properties41.7144583,-85.2072306
98WH76021976IN181002Hillsdale2Primary | Supplementary | Taxonomy | Pedon | Water Retention | Correlation | Andic Soil Properties40.8938861,-86.7138528
9840A1907S1971MI045002Hillsdale7Primary | Supplementary | Taxonomy | Pedon | Water Retention | Correlation | Andic Soil Properties42.4252853,-84.8921432
9802N0759S2001MI149001Hillsdale6Primary | Supplementary | Taxonomy | Pedon | Water Retention | Correlation | Andic Soil Properties41.9703611,-85.4885806

Water Balance

Monthly water balance estimated using a leaky-bucket style model for the HILLSDALE soil series. Monthly precipitation (PPT) and potential evapotranspiration (PET) have been estimated from the 50th percentile of gridded values (PRISM 1981-2010) overlapping with the extent of SSURGO map units containing each series as a major component. Monthly PET values were estimated using the method of Thornthwaite (1948). These (and other) climatic parameters are calculated with each SSURGO refresh and provided by the fetchOSD function of the soilDB package. Representative water storage values (“AWC” in the figures) were derived from SSURGO by taking the 50th percentile of profile-total water storage (sum[awc_r * horizon thickness]) for each soil series. Note that this representation of “water storage” is based on the average ability of most plants to extract soil water between 15 bar (“permanent wilting point”) and 1/3 bar (“field capacity”) matric potential. Soil moisture state can be roughly interpreted as “dry” when storage is depleted, “moist” when storage is between 0mm and AWC, and “wet” when there is a surplus. Clearly there are a lot of assumptions baked into this kind of monthly water balance. This is still a work in progress.

Click the image to view it full size.


Click the image to view it full size.

Sibling Summary

Siblings are those soil series that occur together in map units, in this case with the HILLSDALE series. Sketches are arranged according to their subgroup-level taxonomic structure. Source: SSURGO snapshot , parsed OSD records and snapshot of SC database .

Click the image to view it full size.

Select annual climate data summaries for the HILLSDALE series and siblings. Series are sorted according to hierarchical clustering of median values. Source: SSURGO map unit geometry and 1981-2010, 800m PRISM data .

Click the image to view it full size.

Geomorphic description summaries for the HILLSDALE series and siblings. Series are sorted according to hierarchical clustering of proportions and relative hydrologic position within an idealized landform (e.g. top to bottom). Most soil series (SSURGO components) are associated with a hillslope position and one or more landform-specific positions: hills, mountain slopes, terraces, and/or flats. Proportions can be interpreted as an aggregate representation of geomorphic membership. The values printed to the left (number of component records) and right (Shannon entropy) of stacked bars can be used to judge the reliability of trends. Small Shannon entropy values suggest relatively consistent geomorphic association, while larger values suggest lack thereof. Source: SSURGO component records .

Click the image to view it full size.

Click the image to view it full size.

There are insufficient data to create the 3D mountains figure.

Click the image to view it full size.

Click the image to view it full size.

Competing Series

Soil series competing with HILLSDALE share the same family level classification in Soil Taxonomy. Source: parsed OSD records and snapshot of the SC database .

Click the image to view it full size.

Select annual climate data summaries for the HILLSDALE series and competing. Series are sorted according to hierarchical clustering of median values. Source: SSURGO map unit geometry and 1981-2010, 800m PRISM data .

Click the image to view it full size.

Geomorphic description summaries for the HILLSDALE series and competing. Series are sorted according to hierarchical clustering of proportions and relative hydrologic position within an idealized landform (e.g. top to bottom). Proportions can be interpreted as an aggregate representation of geomorphic membership. Most soil series (SSURGO components) are associated with a hillslope position and one or more landform-specific positions: hills, mountain slopes, terraces, and/or flats. The values printed to the left (number of component records) and right (Shannon entropy) of stacked bars can be used to judge the reliability of trends. Shannon entropy values close to 0 represent soil series with relatively consistent geomorphic association, while values close to 1 suggest lack thereof. Source: SSURGO component records .

Click the image to view it full size.

Click the image to view it full size.

There are insufficient data to create the 3D mountains figure.

Click the image to view it full size.

Click the image to view it full size.

Soil series sharing subgroup-level classification with HILLSDALE, arranged according to family differentiae. Hovering over a series name will print full classification and a small sketch from the OSD. Source: snapshot of SC database .

Block Diagrams

Click a link below to display the diagram. Note that these diagrams may be from multiple survey areas.

  1. IN-2010-09-27-07 | St. Joseph County -

    Typical pattern of soils and underlying material in the Tracy-Hillsdale-Tyner association (Soil Survey of St. Joseph County, Indiana).

  2. IN-2010-09-27-09 | St. Joseph County -

    Typical pattern of soils and underlying material in the Riddles-Crosier-Oshtemo association (Soil Survey of St. Joseph County, Indiana).

  3. MI-2010-09-07-02 | Calhoun County - 1997

    Typical pattern of soils and parent material in the Hillsdale-Kalamazoo-Oshtemo association (Soil Survey of Calhoun County, Michigan; 1997).

  4. MI-2012-02-06-13 | Hillsdale County - 1997

    Typical pattern of soils and parent material in the Riddles-Hillsdale association (Soil Survey of Hillsdale County, Michigan; 1997).

  5. MI-2012-02-06-26 | Ingham County - August 1979

    Pattern of Riddles and Hillsdale, and Aubbeenaubbee soils in association 5 (Soil Survey of Ingham County, Michigan; August 1979).

Map Units

Map units containing HILLSDALE as a major component. Limited to 250 records.

Map Unit Name Symbol Map Unit Area (ac) Map Unit Key National Map Unit Symbol Soil Survey Area Publication Date Map Scale
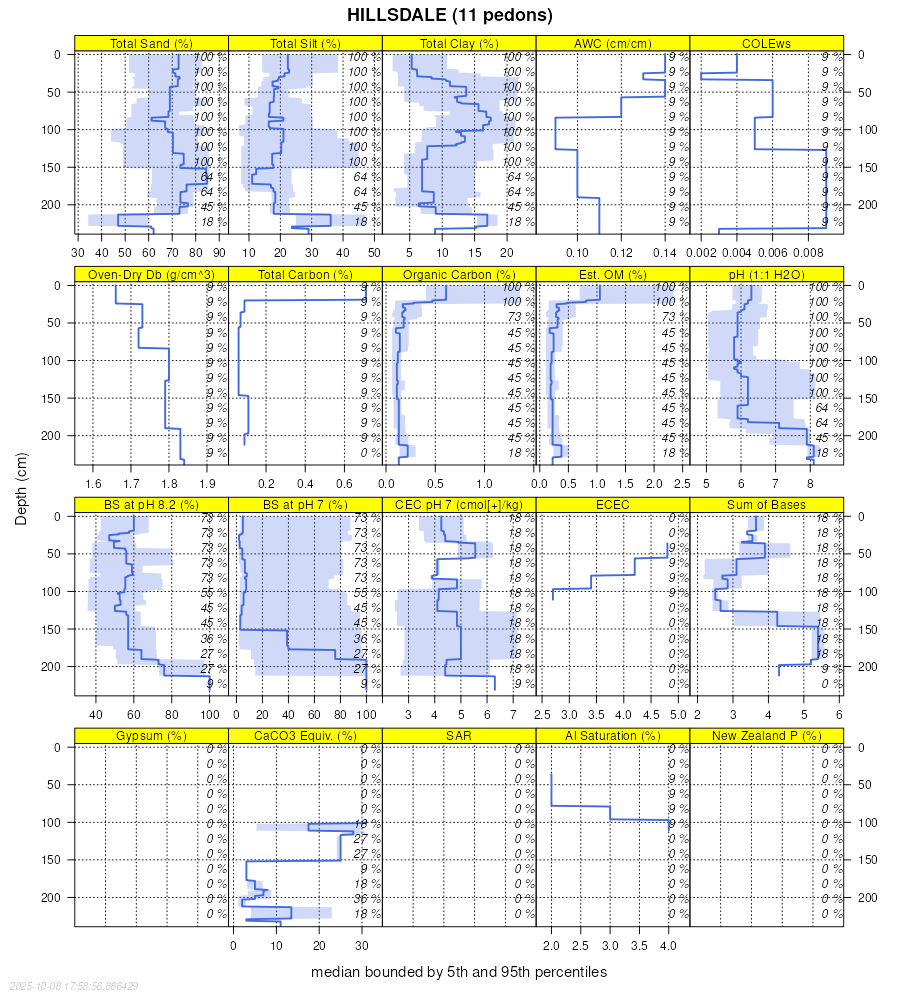
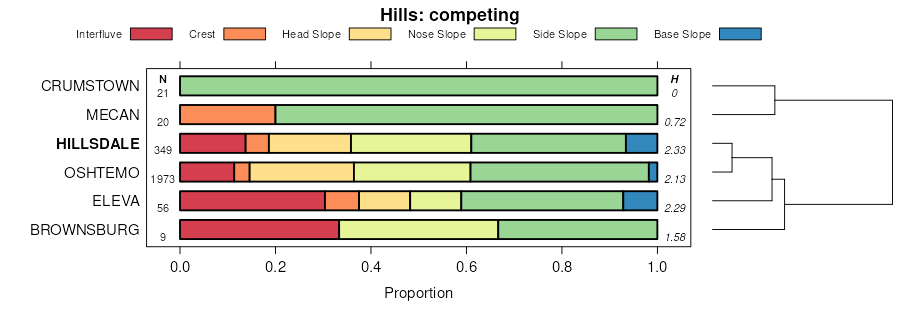
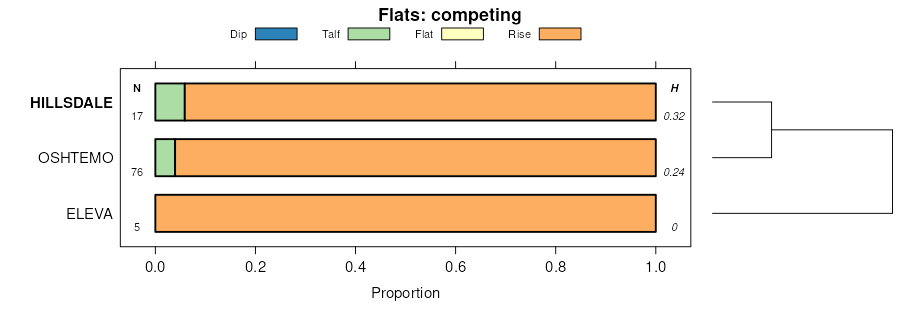
Hillsdale fine sandy loam, 2 to 10 percent slopesHdB5551603265cttin03319801:15840
Hillsdale sandy loam, 2 to 6 percent slopesHdB1053527260394nnin08719781:20000
Hillsdale sandy loam, 6 to 12 percent slopesHdC325827260494npin08719781:20000
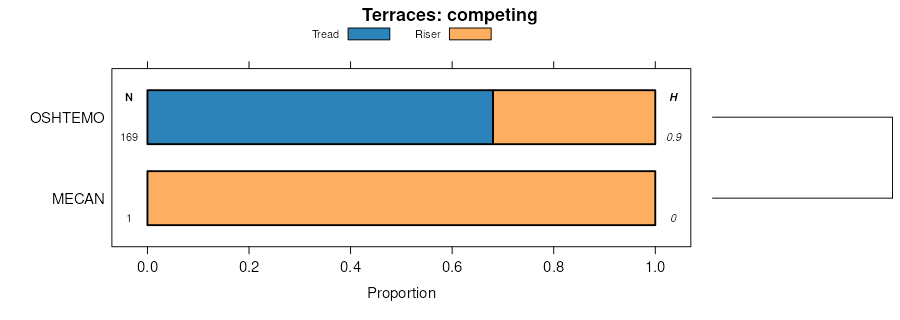
Oshtemo-Hillsdale-Chelsea complex, 3 to 6 percent slopesOuB150527262194p7in08719781:20000
Hillsdale sandy loam, 0 to 2 percent slopesHdA136227260294nmin08719781:20000
Oshtemo-Hillsdale-Chelsea complex, 6 to 12 percent slopesOuC121827262294p8in08719781:20000
Hillsdale sandy loam, 1 to 5 percent slopesHkkB2872625139nzhsin14120011:12000
Hillsdale-Oshtemo sandy loams, 5 to 10 percent slopes, erodedHknC21416625137nzhqin14120011:12000
Hillsdale-Tracy sandy loams, 5 to 10 percent slopes, erodedHkpC21122625136nzhpin14120011:12000
Urban land-Hillsdale complex, 1 to 5 percent slopesUhmB847625295nzntin14120011:12000
Hillsdale-Tracy sandy loams, 10 to 18 percent slopes, erodedHkpD2547625142nzhwin14120011:12000
Hillsdale-Oshtemo sandy loams, 10 to 18 percent slopes, erodedHknD2528625138nzhrin14120011:12000
Urban land-Hillsdale-Tracy complex, 5 to 10 percent slopesUhpC502625559nzybin14120011:12000
Hillsdale sandy loam, 0 to 1 percent slopesHkkA346625140nzhtin14120011:12000
Urban land-Hillsdale-Oshtemo complex, 5 to 10 percent slopesUhoC88625296nznvin14120011:12000
Urban land-Hillsdale-Tracy complex, 10 to 18 percent slopesUhpD63625557nzy8in14120011:12000
Urban land-Hillsdale complex, 0 to 1 percent slopesUhmA27627868p2btin14120011:12000
Urban land-Hillsdale-Oshtemo complex, 10 to 18 percent slopesUhoD4625294nznsin14120011:12000
Hillsdale-Riddles fine sandy loams, 2 to 6 percent slopes5B2462318698968kxmi02319841:15840
Hillsdale-Riddles fine sandy loams, 6 to 12 percent slopes5C198018699068kymi02319841:15840
Hillsdale sandy loam, 0 to 6 percent slopes29B331841886986bc1mi02519931:15840
Hillsdale sandy loam, 6 to 12 percent slopes29C142961886996bc2mi02519931:15840
Hillsdale sandy loam, 12 to 18 percent slopes29D21171887006bc3mi02519931:15840
Hillsdale sandy loam, 18 to 25 percent slopes29E8231887016bc4mi02519931:15840
Hillsdale sandy loam, 2 to 6 percent slopesHaB370718623067sfmi04519741:15840
Hillsdale sandy loam, 6 to 12 percent slopesHaC343518623167sgmi04519741:15840
Hillsdale-Riddles complex, 2 to 6 percent slopes10B281181886086b84mi05919911:15840
Hillsdale-Riddles complex, 6 to 12 percent slopes, eroded10C2143661886096b85mi05919911:15840
Hillsdale-Riddles complex, 12 to 18 percent slopes, eroded10D220721886106b86mi05919911:15840
Hillsdale-Riddles complex, 18 to 35 percent slopes10E9011886116b87mi05919911:15840
Riddles-Hillsdale sandy loams, 2 to 6 percent slopesRdB893718675168b7mi06519771:15840
Riddles-Hillsdale sandy loams, 6 to 12 percent slopesRdC266318675268b8mi06519771:15840
Riddles-Hillsdale sandy loams, 12 to 18 percent slopesRdD27318675368b9mi06519771:15840
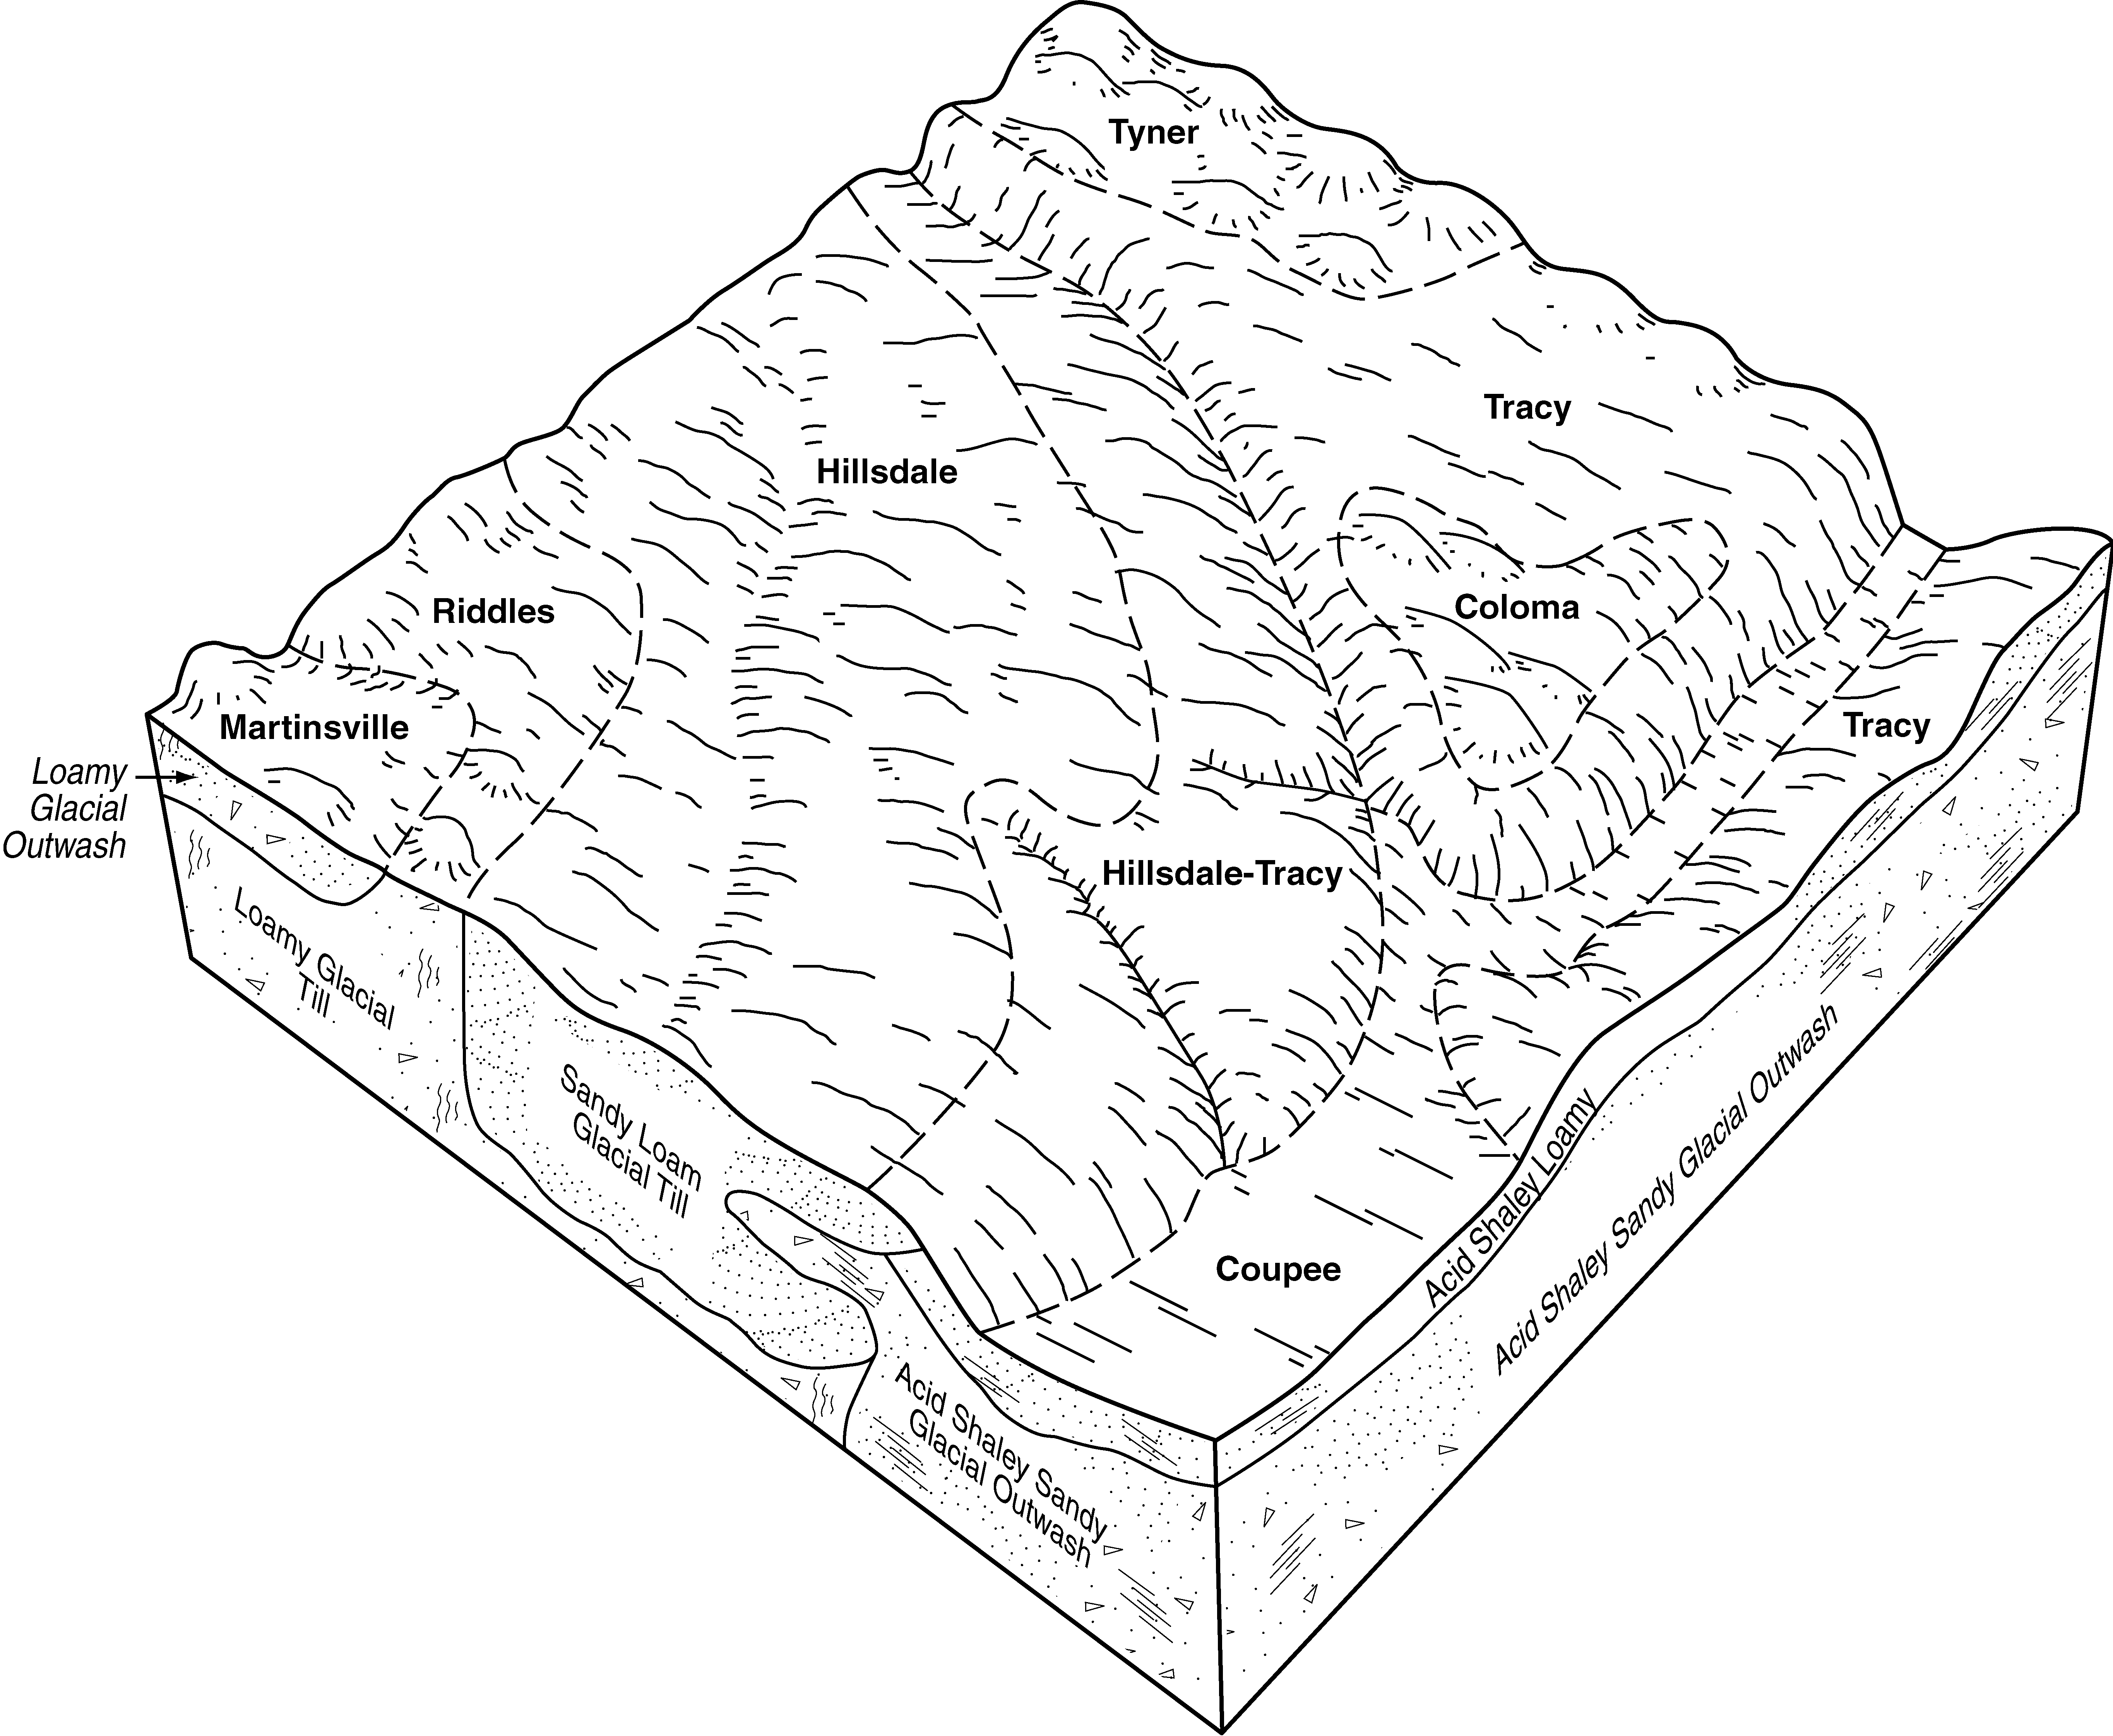
Hillsdale-Riddles sandy loams, 1 to 6 percent slopes49B449421887806bfpmi07519791:15840
Hillsdale-Riddles sandy loams, 6 to 12 percent slopes49C223611887816bfqmi07519791:15840
Hillsdale-Riddles sandy loams, 18 to 30 percent slopes49E42831887836bfsmi07519791:15840
Hillsdale-Riddles sandy loams, 12 to 18 percent slopes49D42811887826bfrmi07519791:15840
Spinks, Boyer, Plainfield, and Hillsdale soils, 7 to 15 percent slopes, moderately erodedScC25291885676b6tmi09119571:20000
Spinks, Boyer, Plainfield, and Hillsdale soils, 3 to 7 percent slopesScB1731885646b6qmi09119571:20000
Spinks, Boyer, Plainfield, and Hillsdale soils, 7 to 15 percent slopesScC921885666b6smi09119571:20000
Spinks, Boyer, Plainfield, and Hillsdale soils, 3 to 7 percent slopes, moderately erodedScB2781885656b6rmi09119571:20000
Spinks, Boyer, Plainfield, and Hillsdale soils, 12 to 25 percent slopes, moderately erodedScD2621885686b6vmi09119571:20000
Hillsdale sandy loam, 3 to 7 percent slopesHaB561884896b49mi09119571:20000
Hillsdale sandy loam, 7 to 15 percent slopes, moderately erodedHaC2251884906b4bmi09119571:20000
Hillsdale sandy loam, 2 to 6 percent slopesHlB5709187567695kmi09319681:20000
Hillsdale-Miami loams, 2 to 6 percent slopesHmB4697187571695pmi09319681:20000
Hillsdale sandy loam, 6 to 12 percent slopesHlC2324187568695lmi09319681:20000
Hillsdale sandy loam, 12 to 18 percent slopesHlD1533187569695mmi09319681:20000
Hillsdale sandy loam, 18 to 25 percent slopesHlE1064187570695nmi09319681:20000
Hillsdale-Miami loams, 6 to 12 percent slopesHmC1046187572695qmi09319681:20000
Hillsdale loamy sand, 6 to 12 percent slopesHdC588187566695jmi09319681:20000
Hillsdale loamy sand, 2 to 6 percent slopesHdB533187565695hmi09319681:20000
Hillsdale sandy loam, 2 to 6 percent slopesHlB10921926716gh6mi13919671:15840
Hillsdale sandy loam, 6 to 12 percent slopesHlC8221926726gh7mi13919671:15840
Hillsdale sandy loam, 2 to 6 percent slopes10B2136918626267tgmi14919801:15840
Hillsdale sandy loam, 6 to 12 percent slopes10C1092618626367thmi14919801:15840
Hillsdale sandy loam, 12 to 18 percent slopes10D716718626467tjmi14919801:15840

Map of Series Extent

Approximate geographic distribution of the HILLSDALE soil series. To learn more about how this distribution was mapped, or to compare this soil series extent to others, use the Series Extent Explorer (SEE) application. Source: generalization of SSURGO geometry .