Click a link below to display the diagram. Note that these diagrams may be from multiple survey areas.
- KY-2010-09-03-11 | Knott and Letcher Counties - 2004
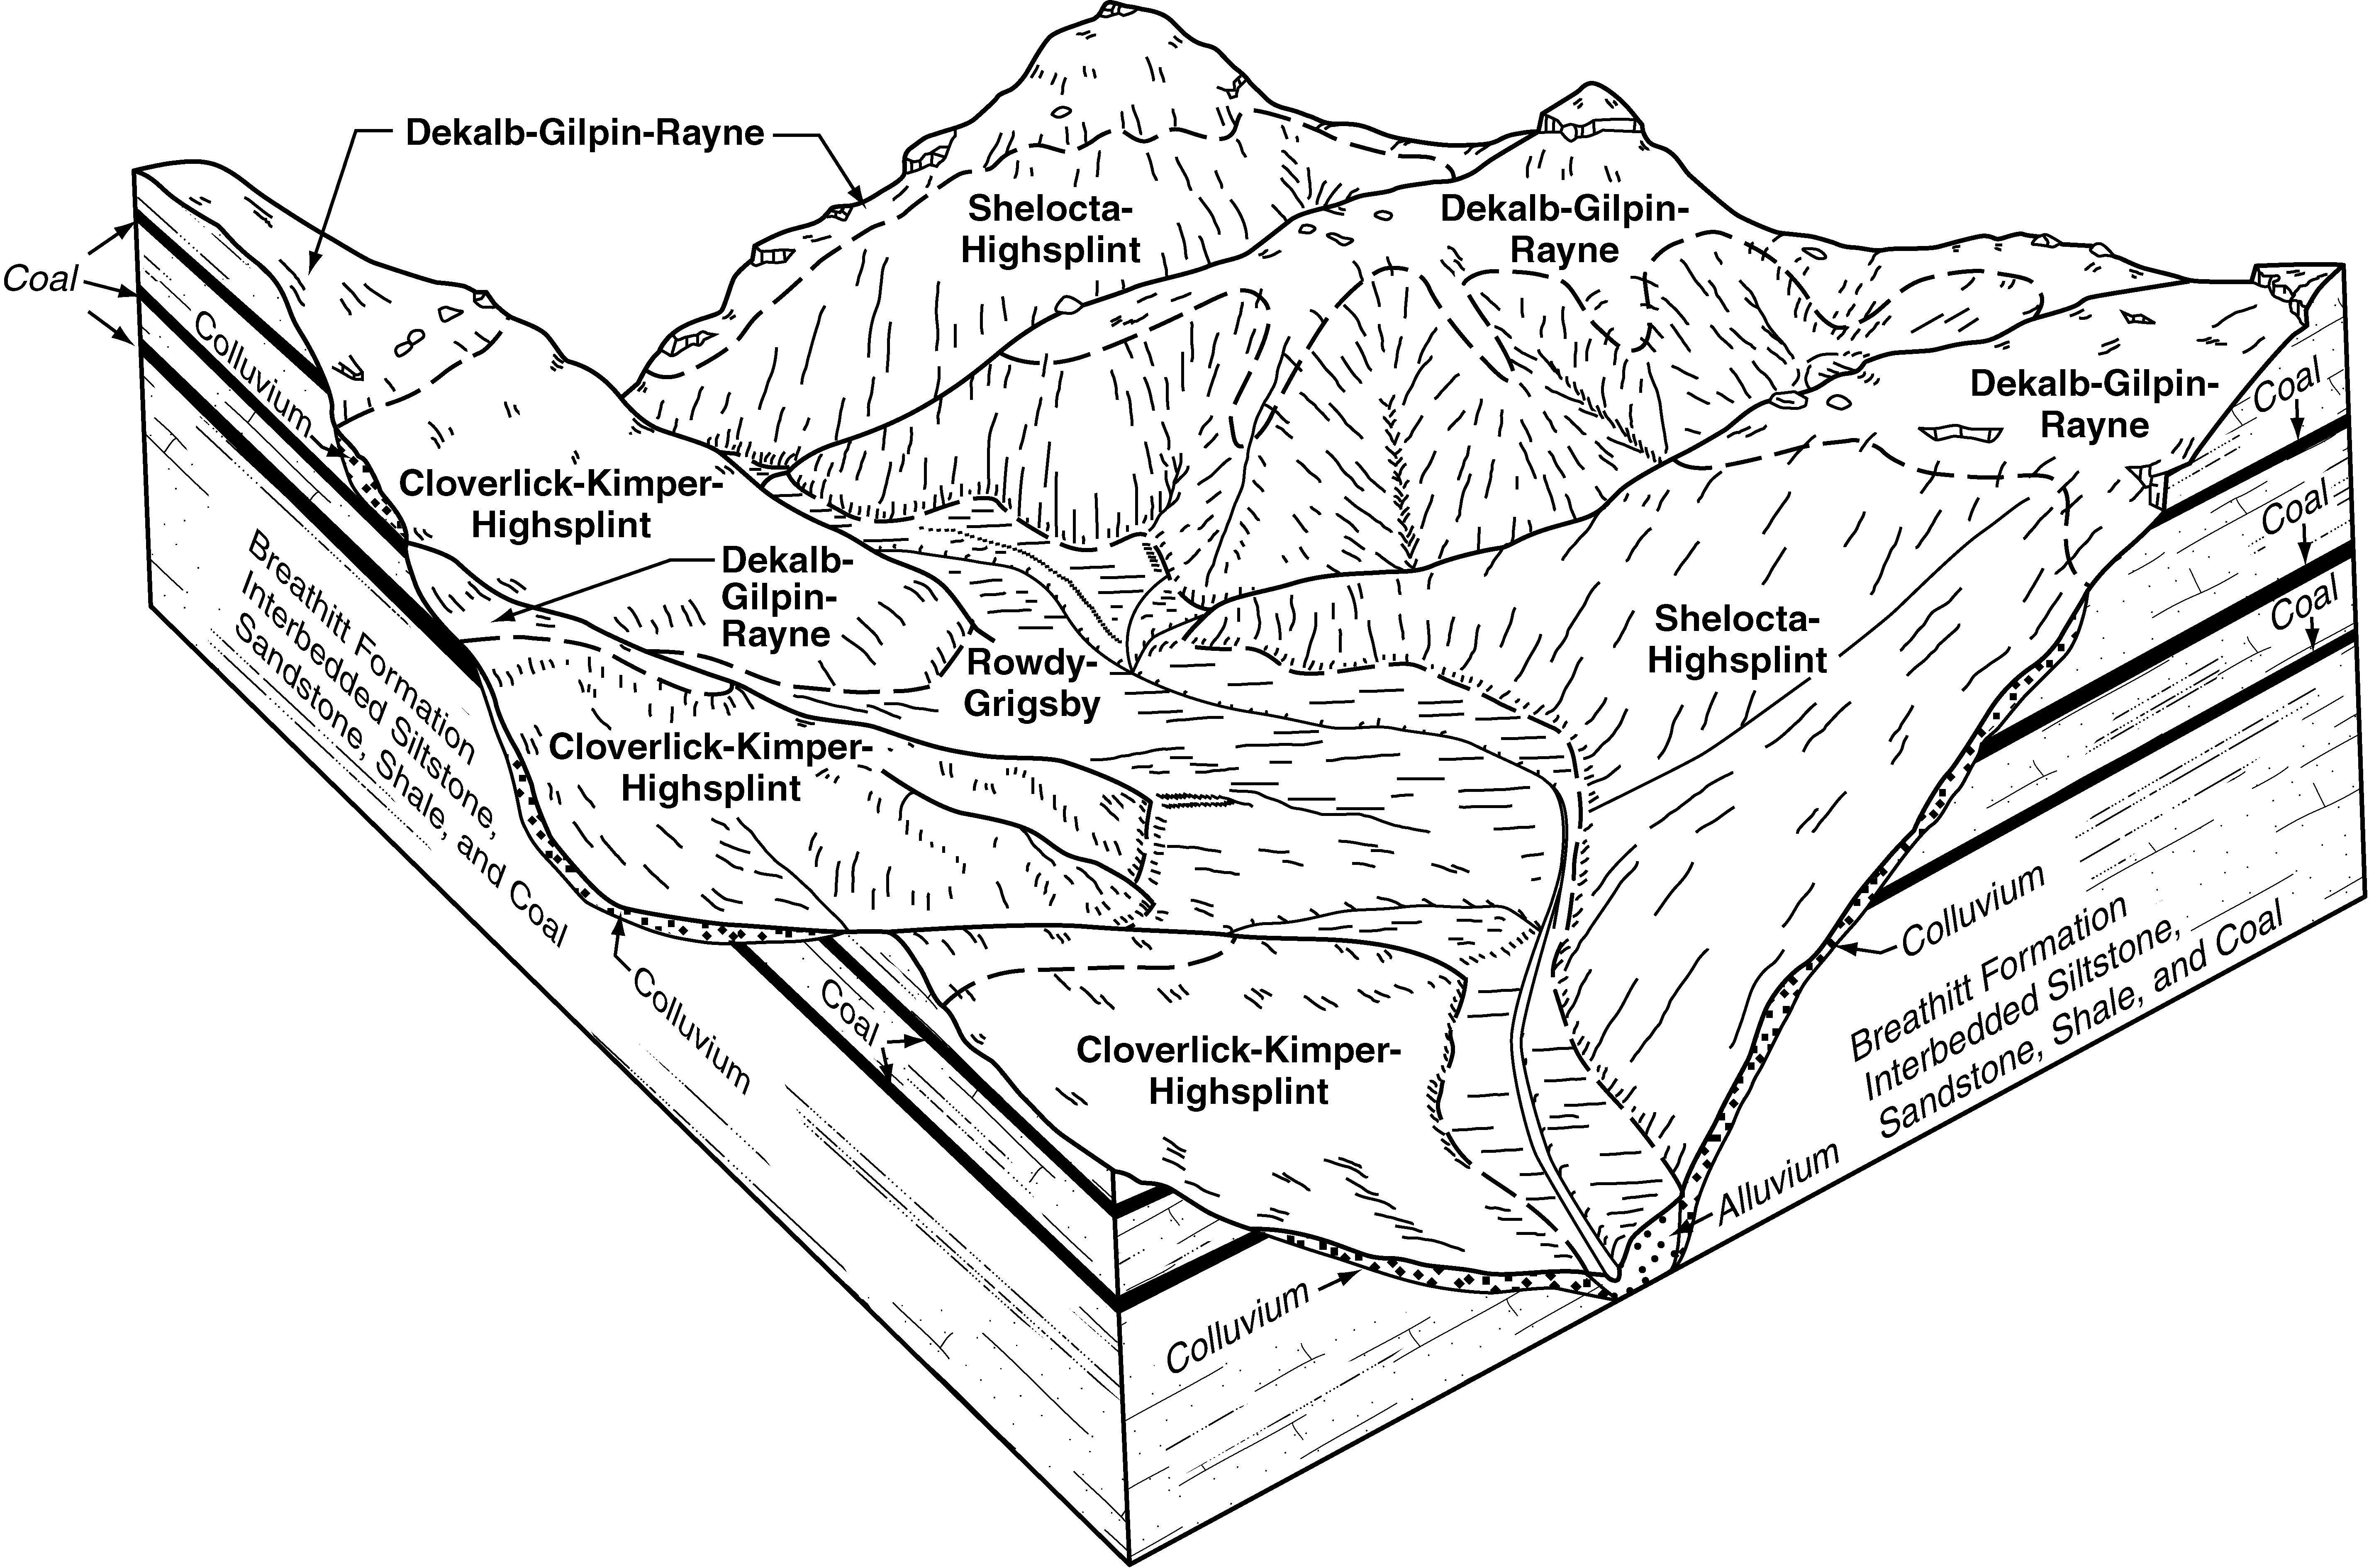
Typical pattern of soils and their relationship to geology and topography in the Shelocta-Highsplint-Cloverlick-Kimper general soil map unit in Knott County (Soil Survey of Knott and Letcher Counties, Kentucky; 2004).
- KY-2010-09-03-12 | Knott and Letcher Counties - 2004
Typical pattern of soils and their relationship to geology and topography in the Handshoe-Cloverlick-Fedscreek-Marrowbone general soil map unit in Knott County (Soil Survey of Knott and Letcher Counties, Kentucky; 2004).
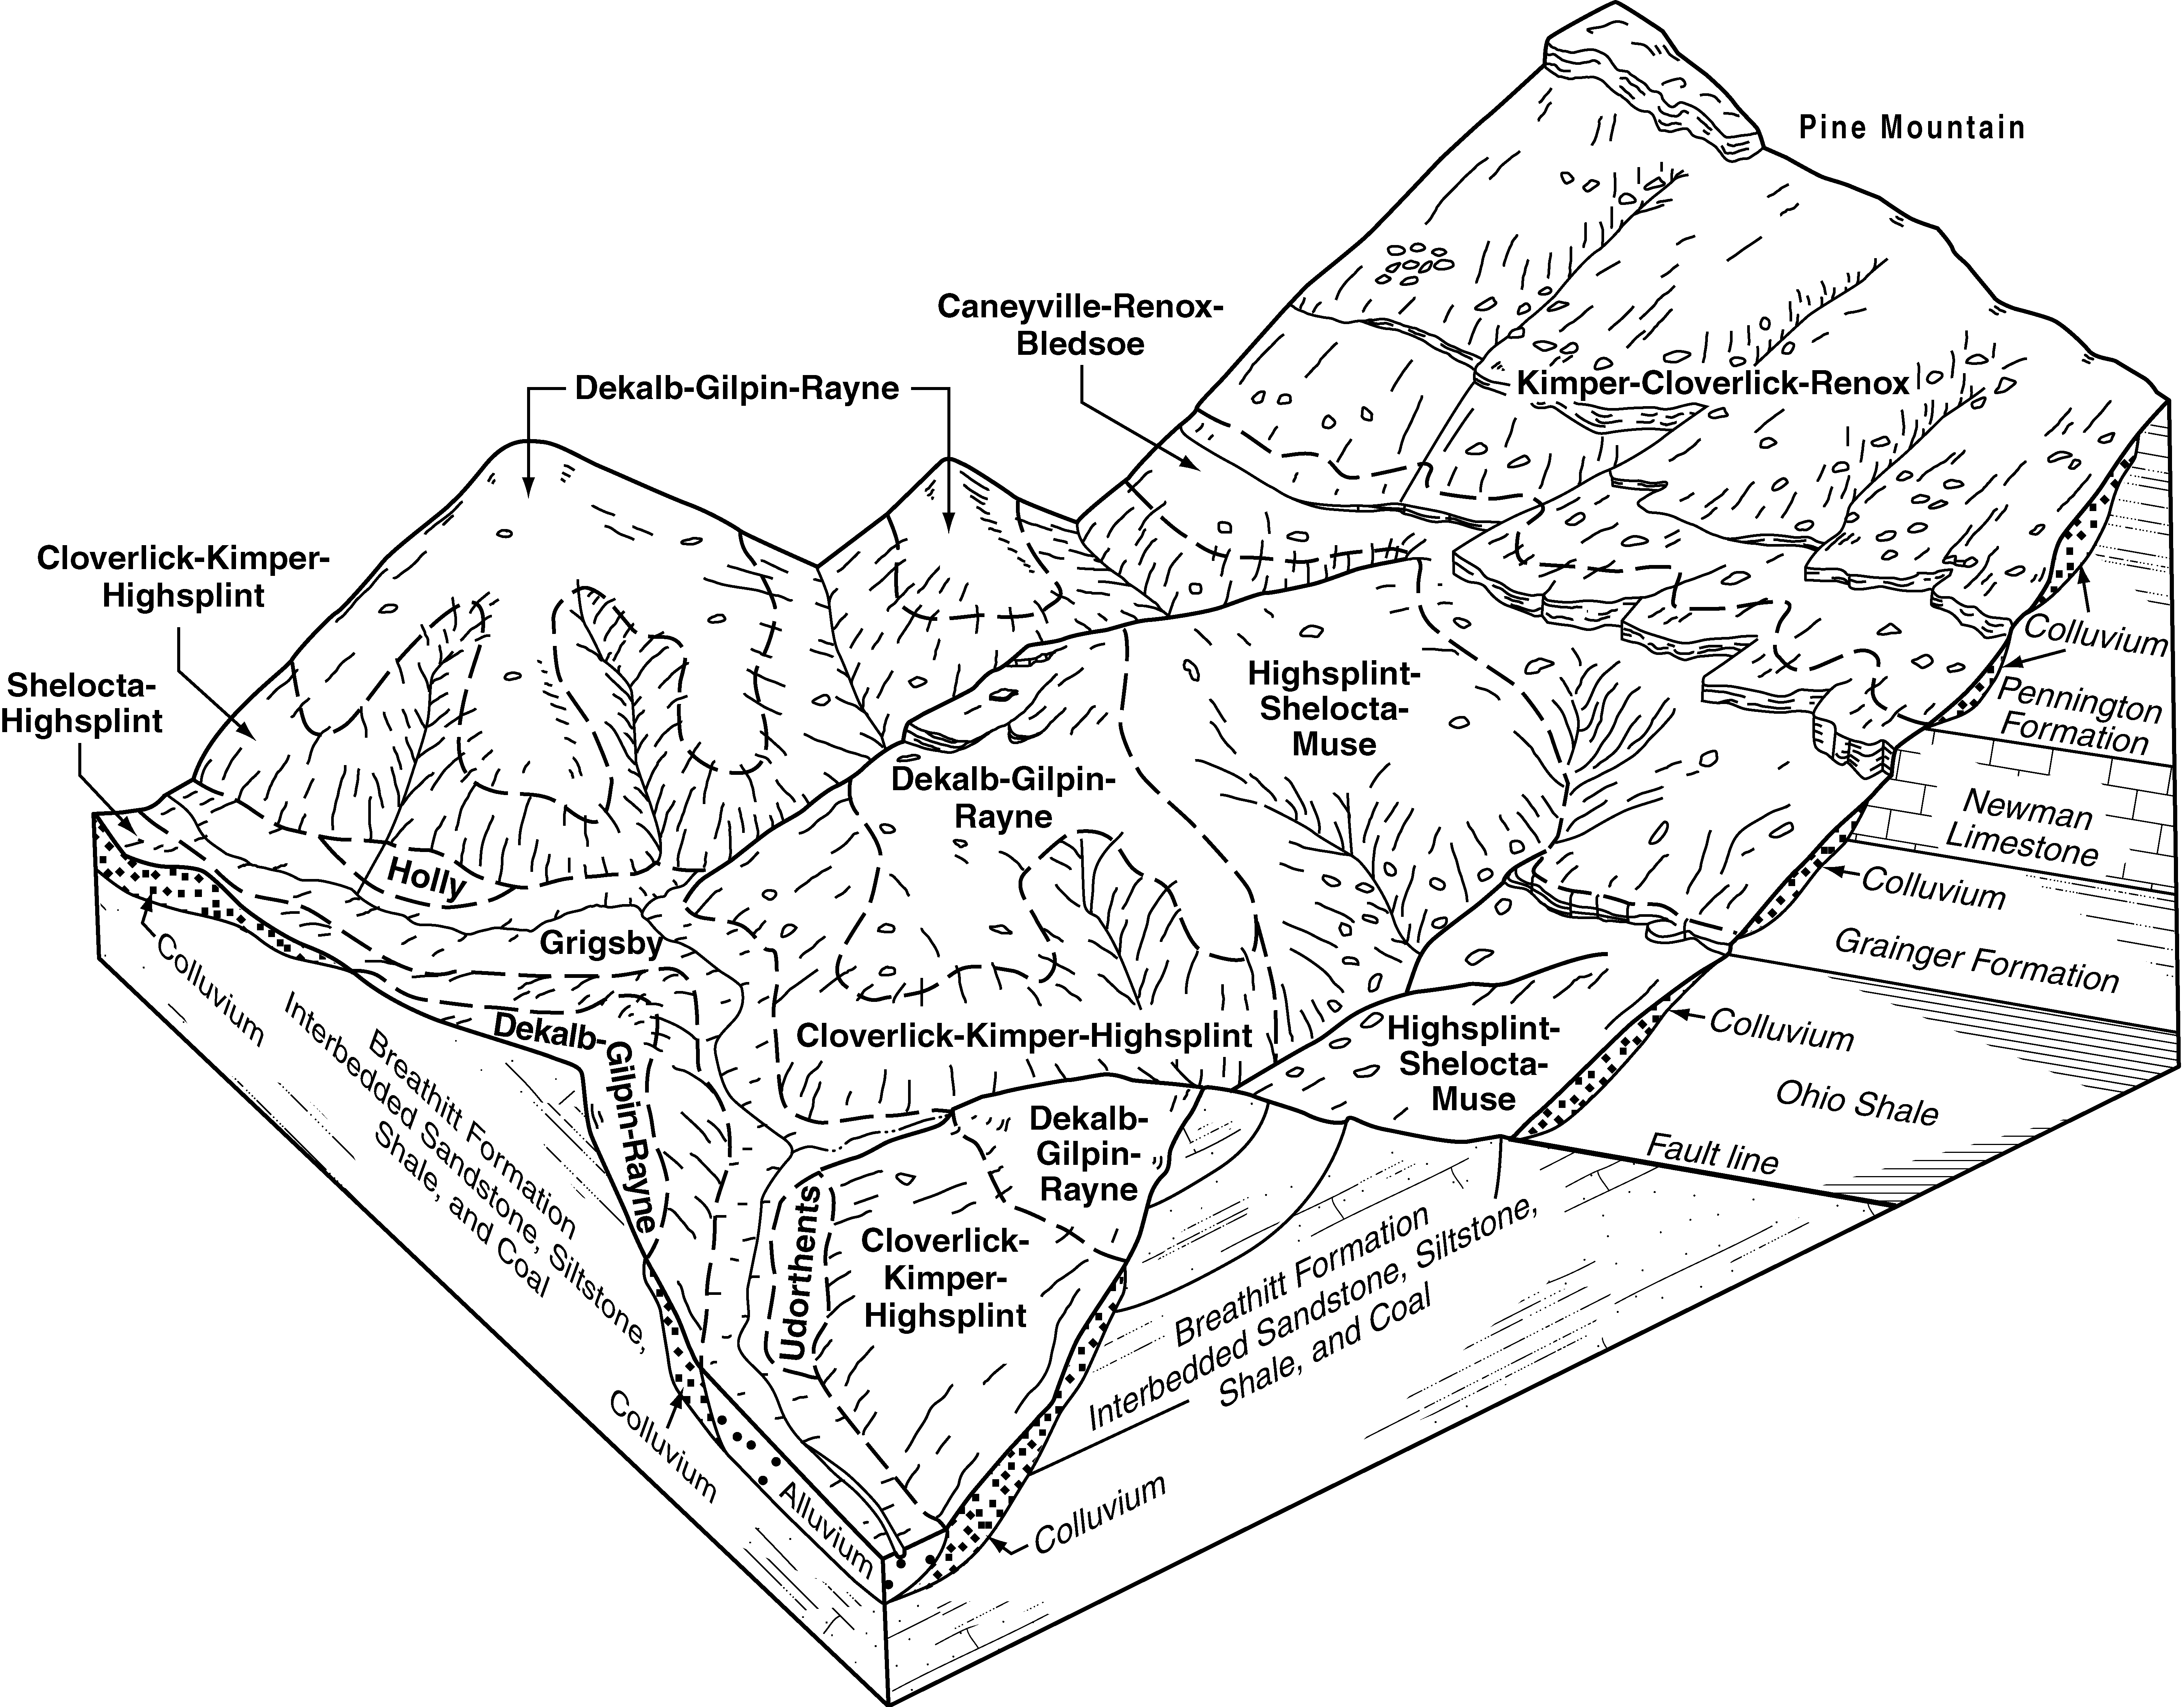
- KY-2010-09-03-13 | Knott and Letcher Counties - 2004
Typical pattern of soils and their relationship to geology and topography in the Kimper-Cloverlick-Renox-Highsplint general soil map unit in Letcher County (Soil Survey of Knott and Letcher Counties, Kentucky; 2004).
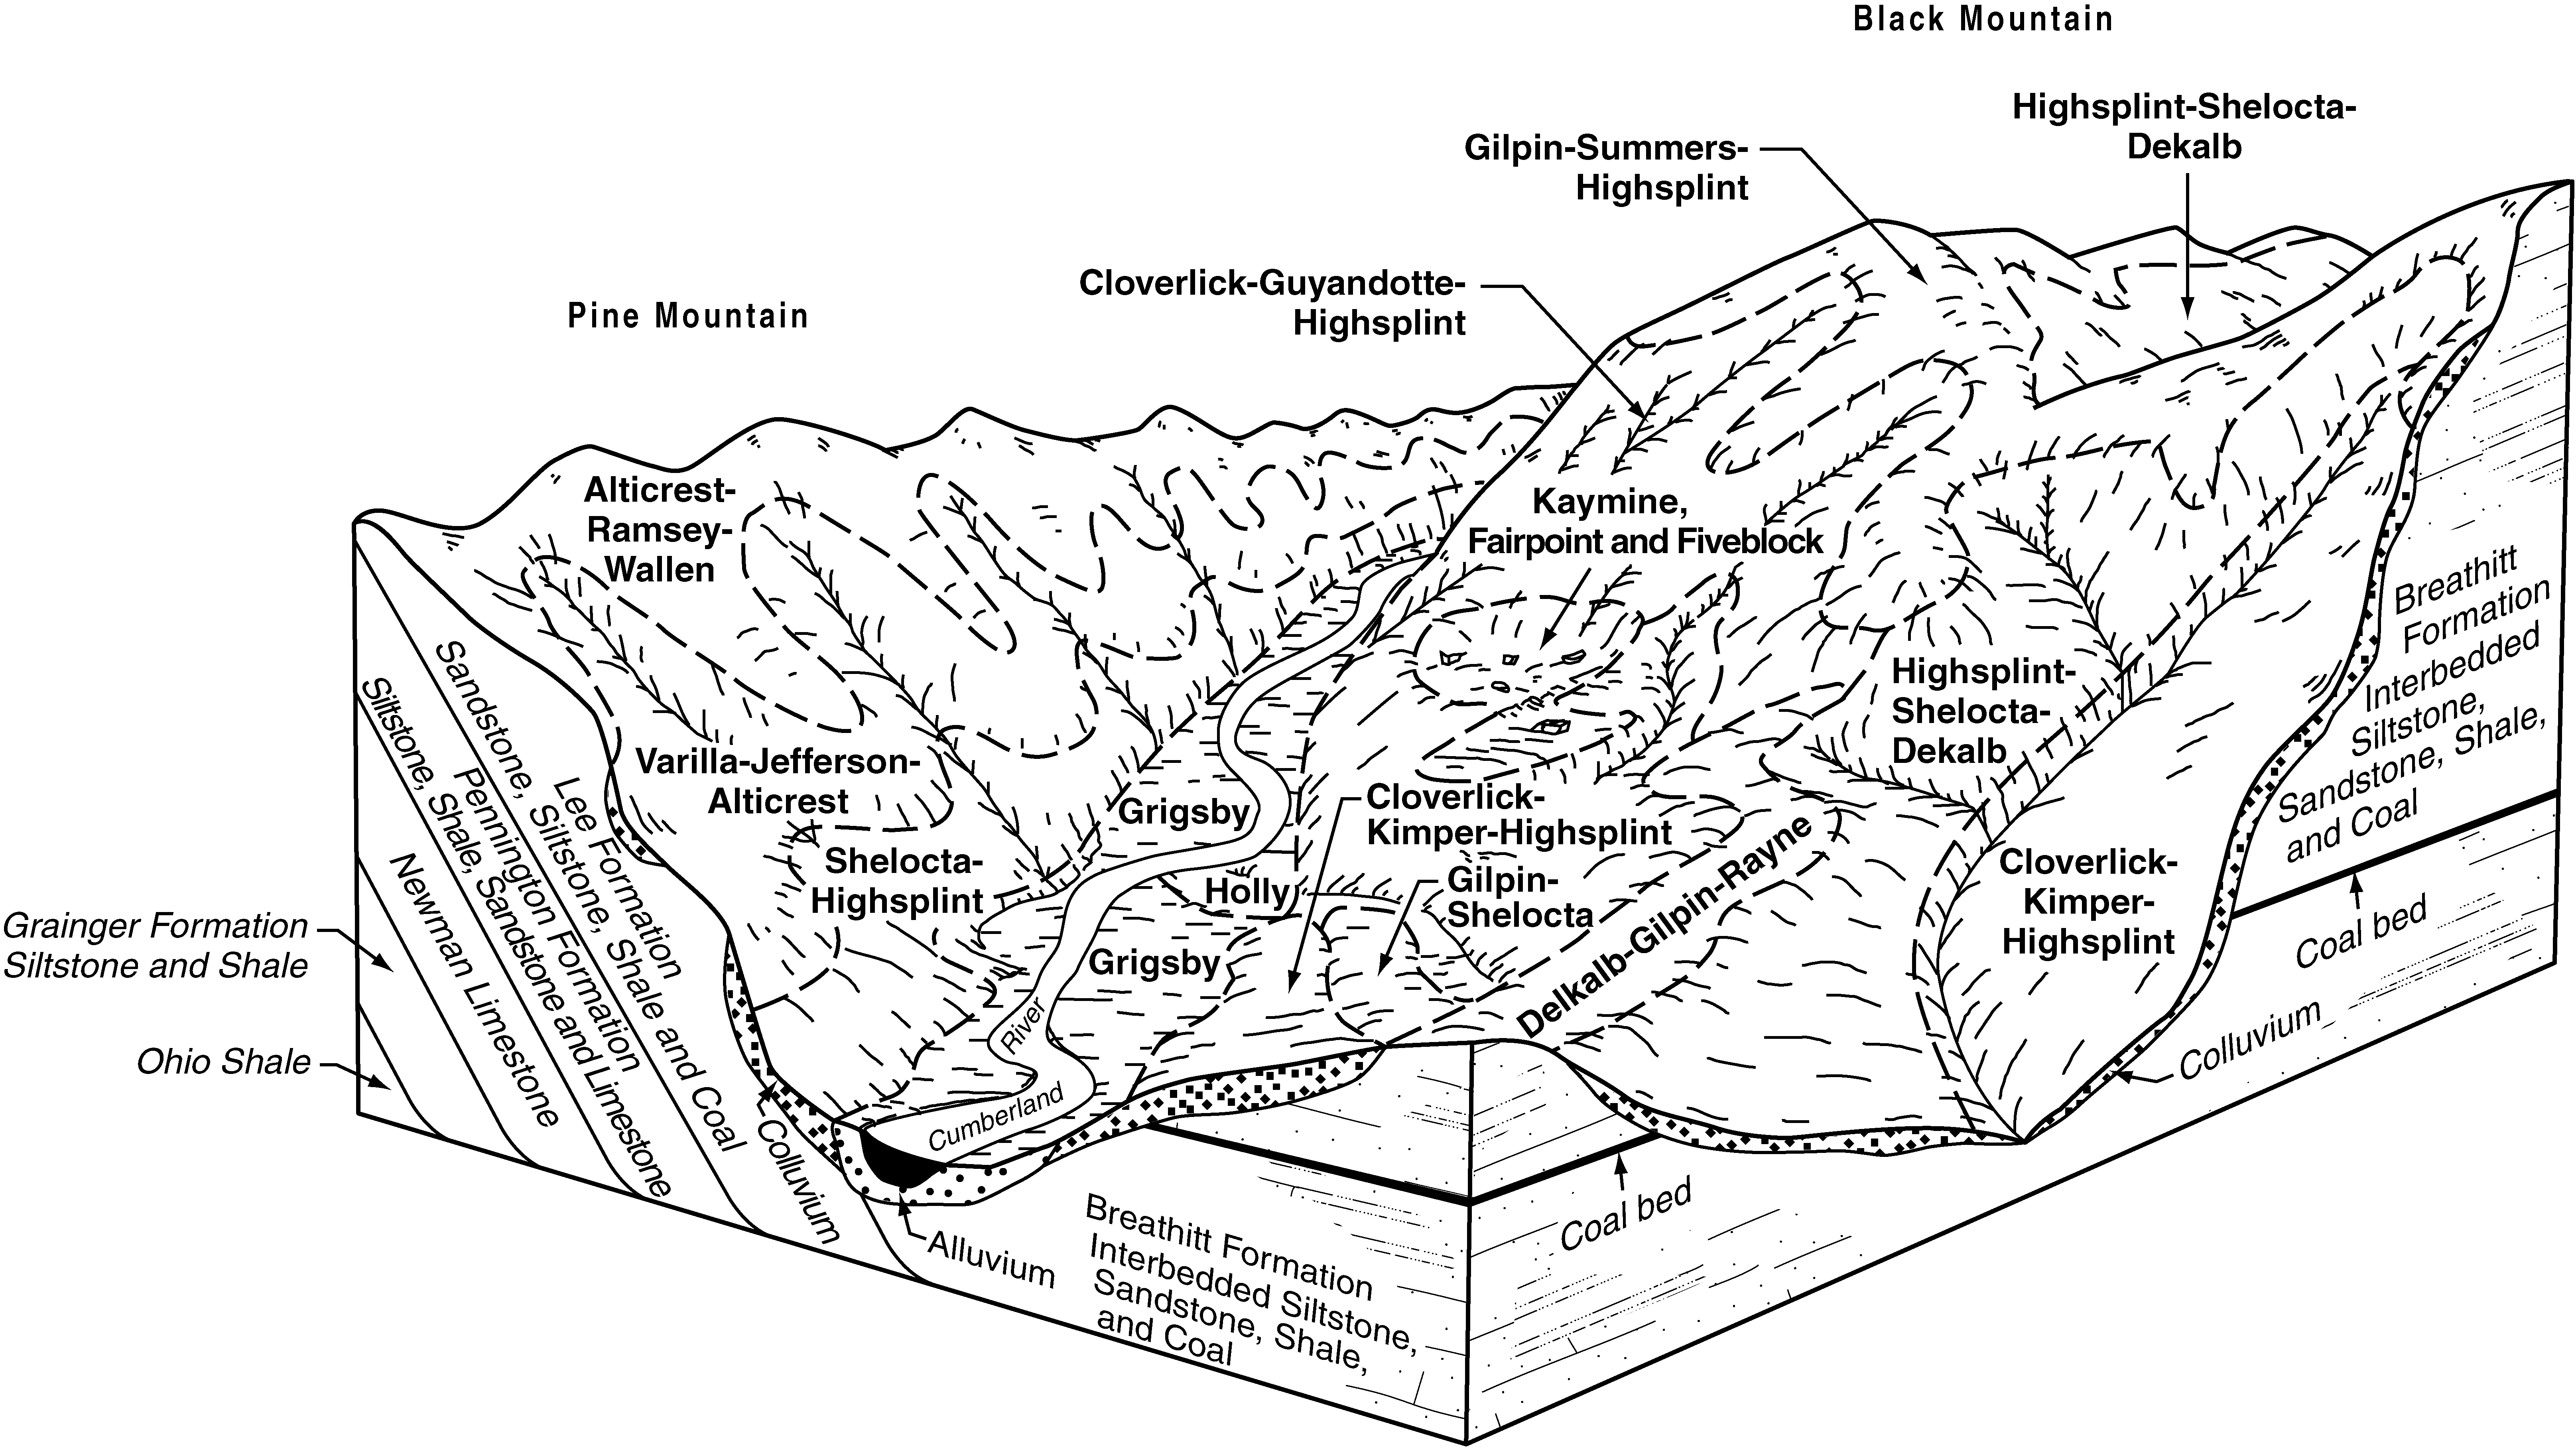
- KY-2010-09-03-14 | Knott and Letcher Counties - 2004
Typical pattern of soils and their relationship to geology and topography in the Alticrest-Varilla-Shelocta-Jefferson general soil map unit and the Cloverlick-Highsplint-Guyandotte-Shelocta general soil map unit in Letcher County (Soil Survey of Knott and Letcher Counties, Kentucky; 2004).
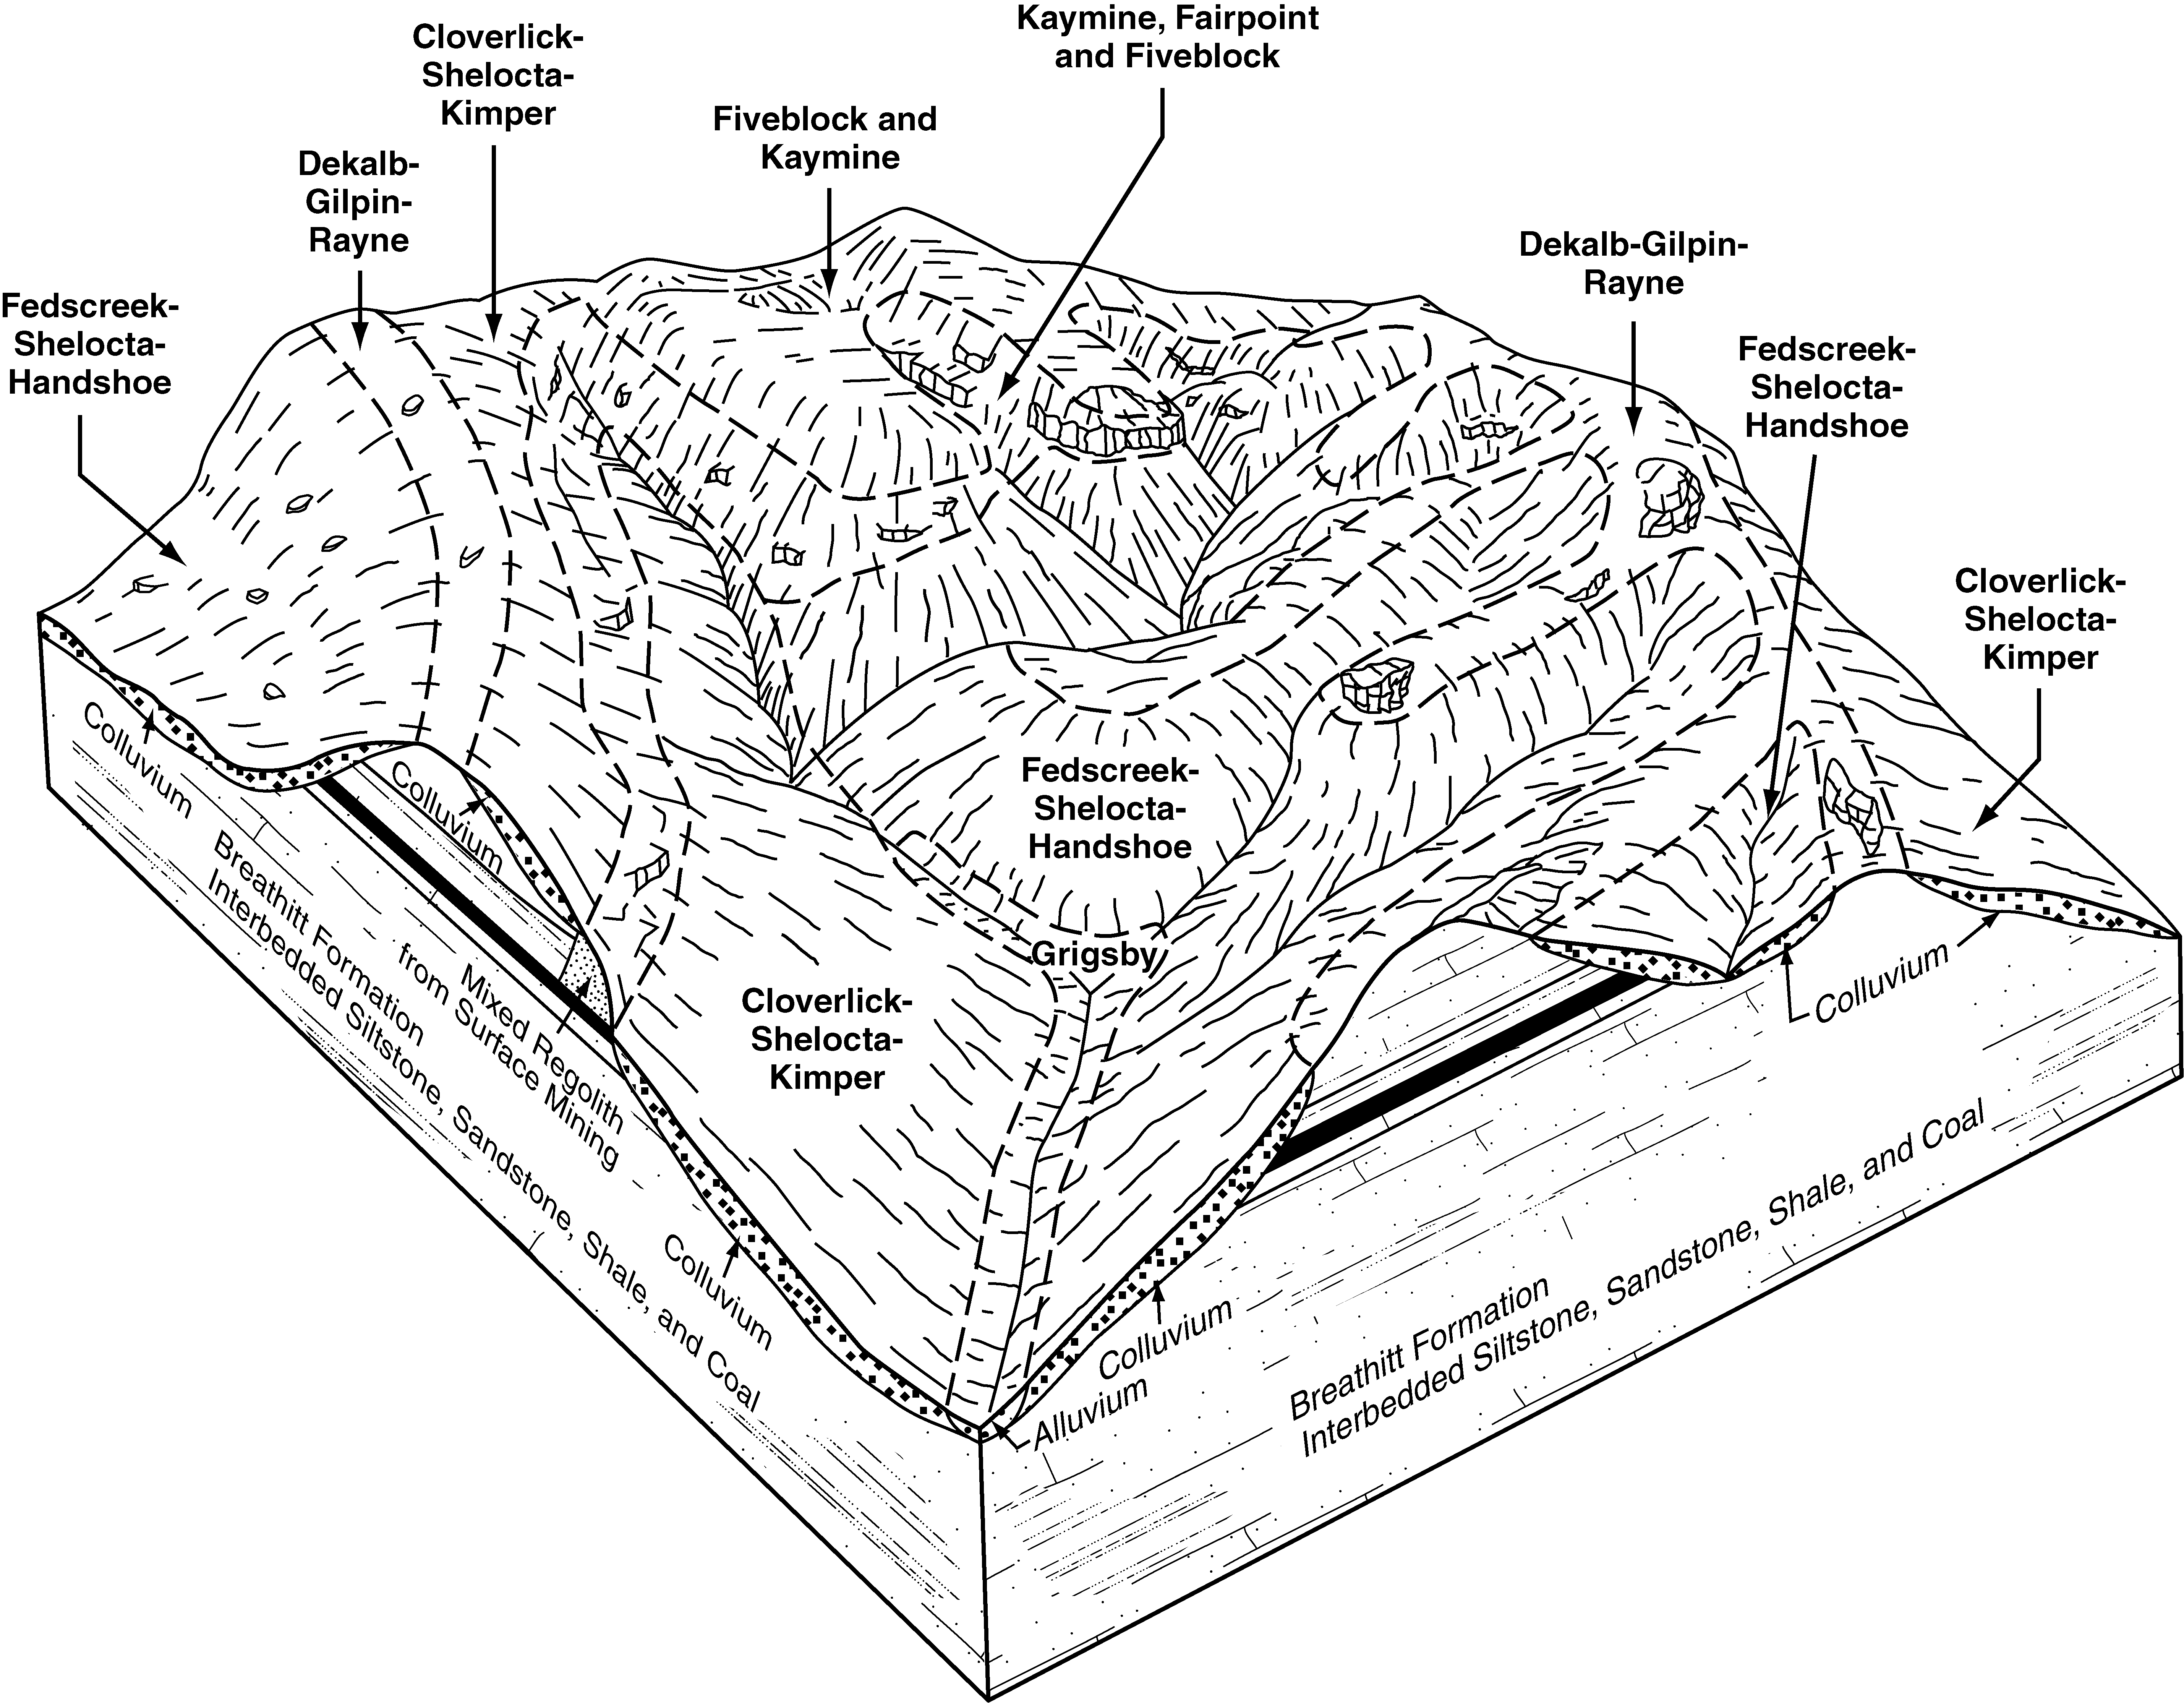
- KY-2010-09-03-15 | Knott and Letcher Counties - 2004
Typical pattern of soils and their relationship to geology and topography in the Shelocta-Cloverlick-Fedscreek-Dekalb general soil map unit in Letcher County (Soil Survey of Knott and Letcher Counties, Kentucky; 2004).
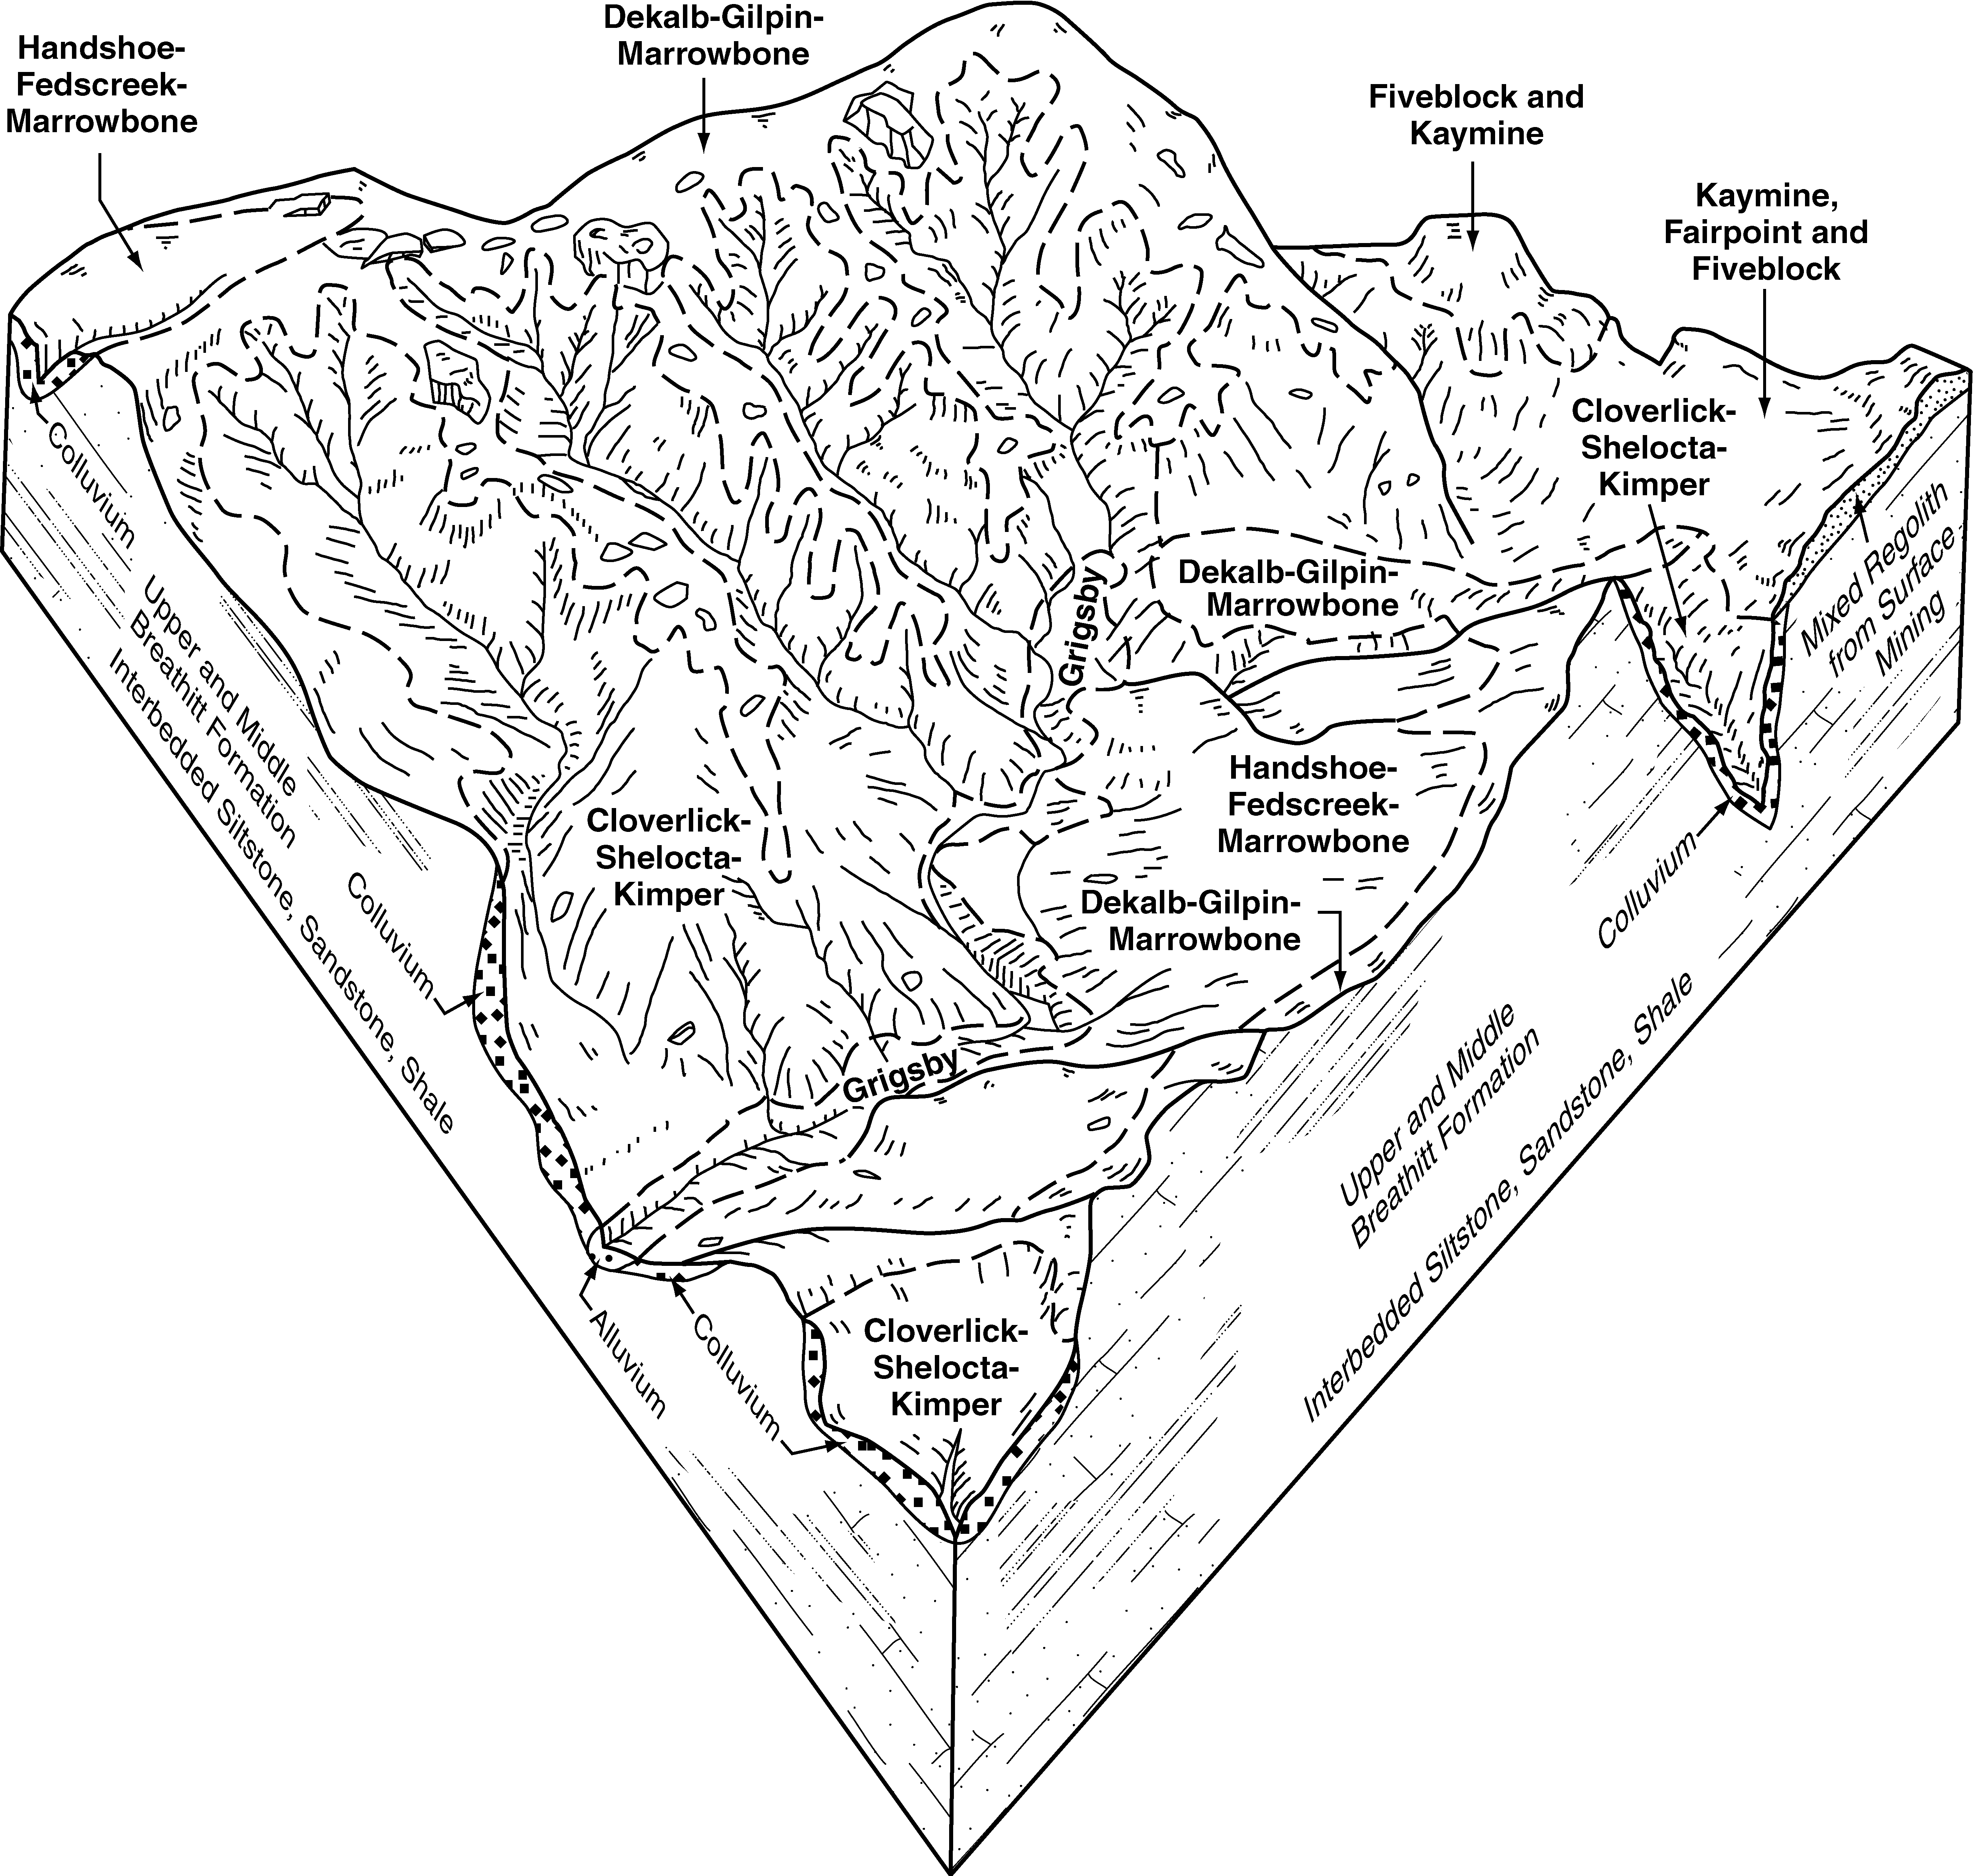
- KY-2010-09-03-16 | Knott and Letcher Counties - 2004
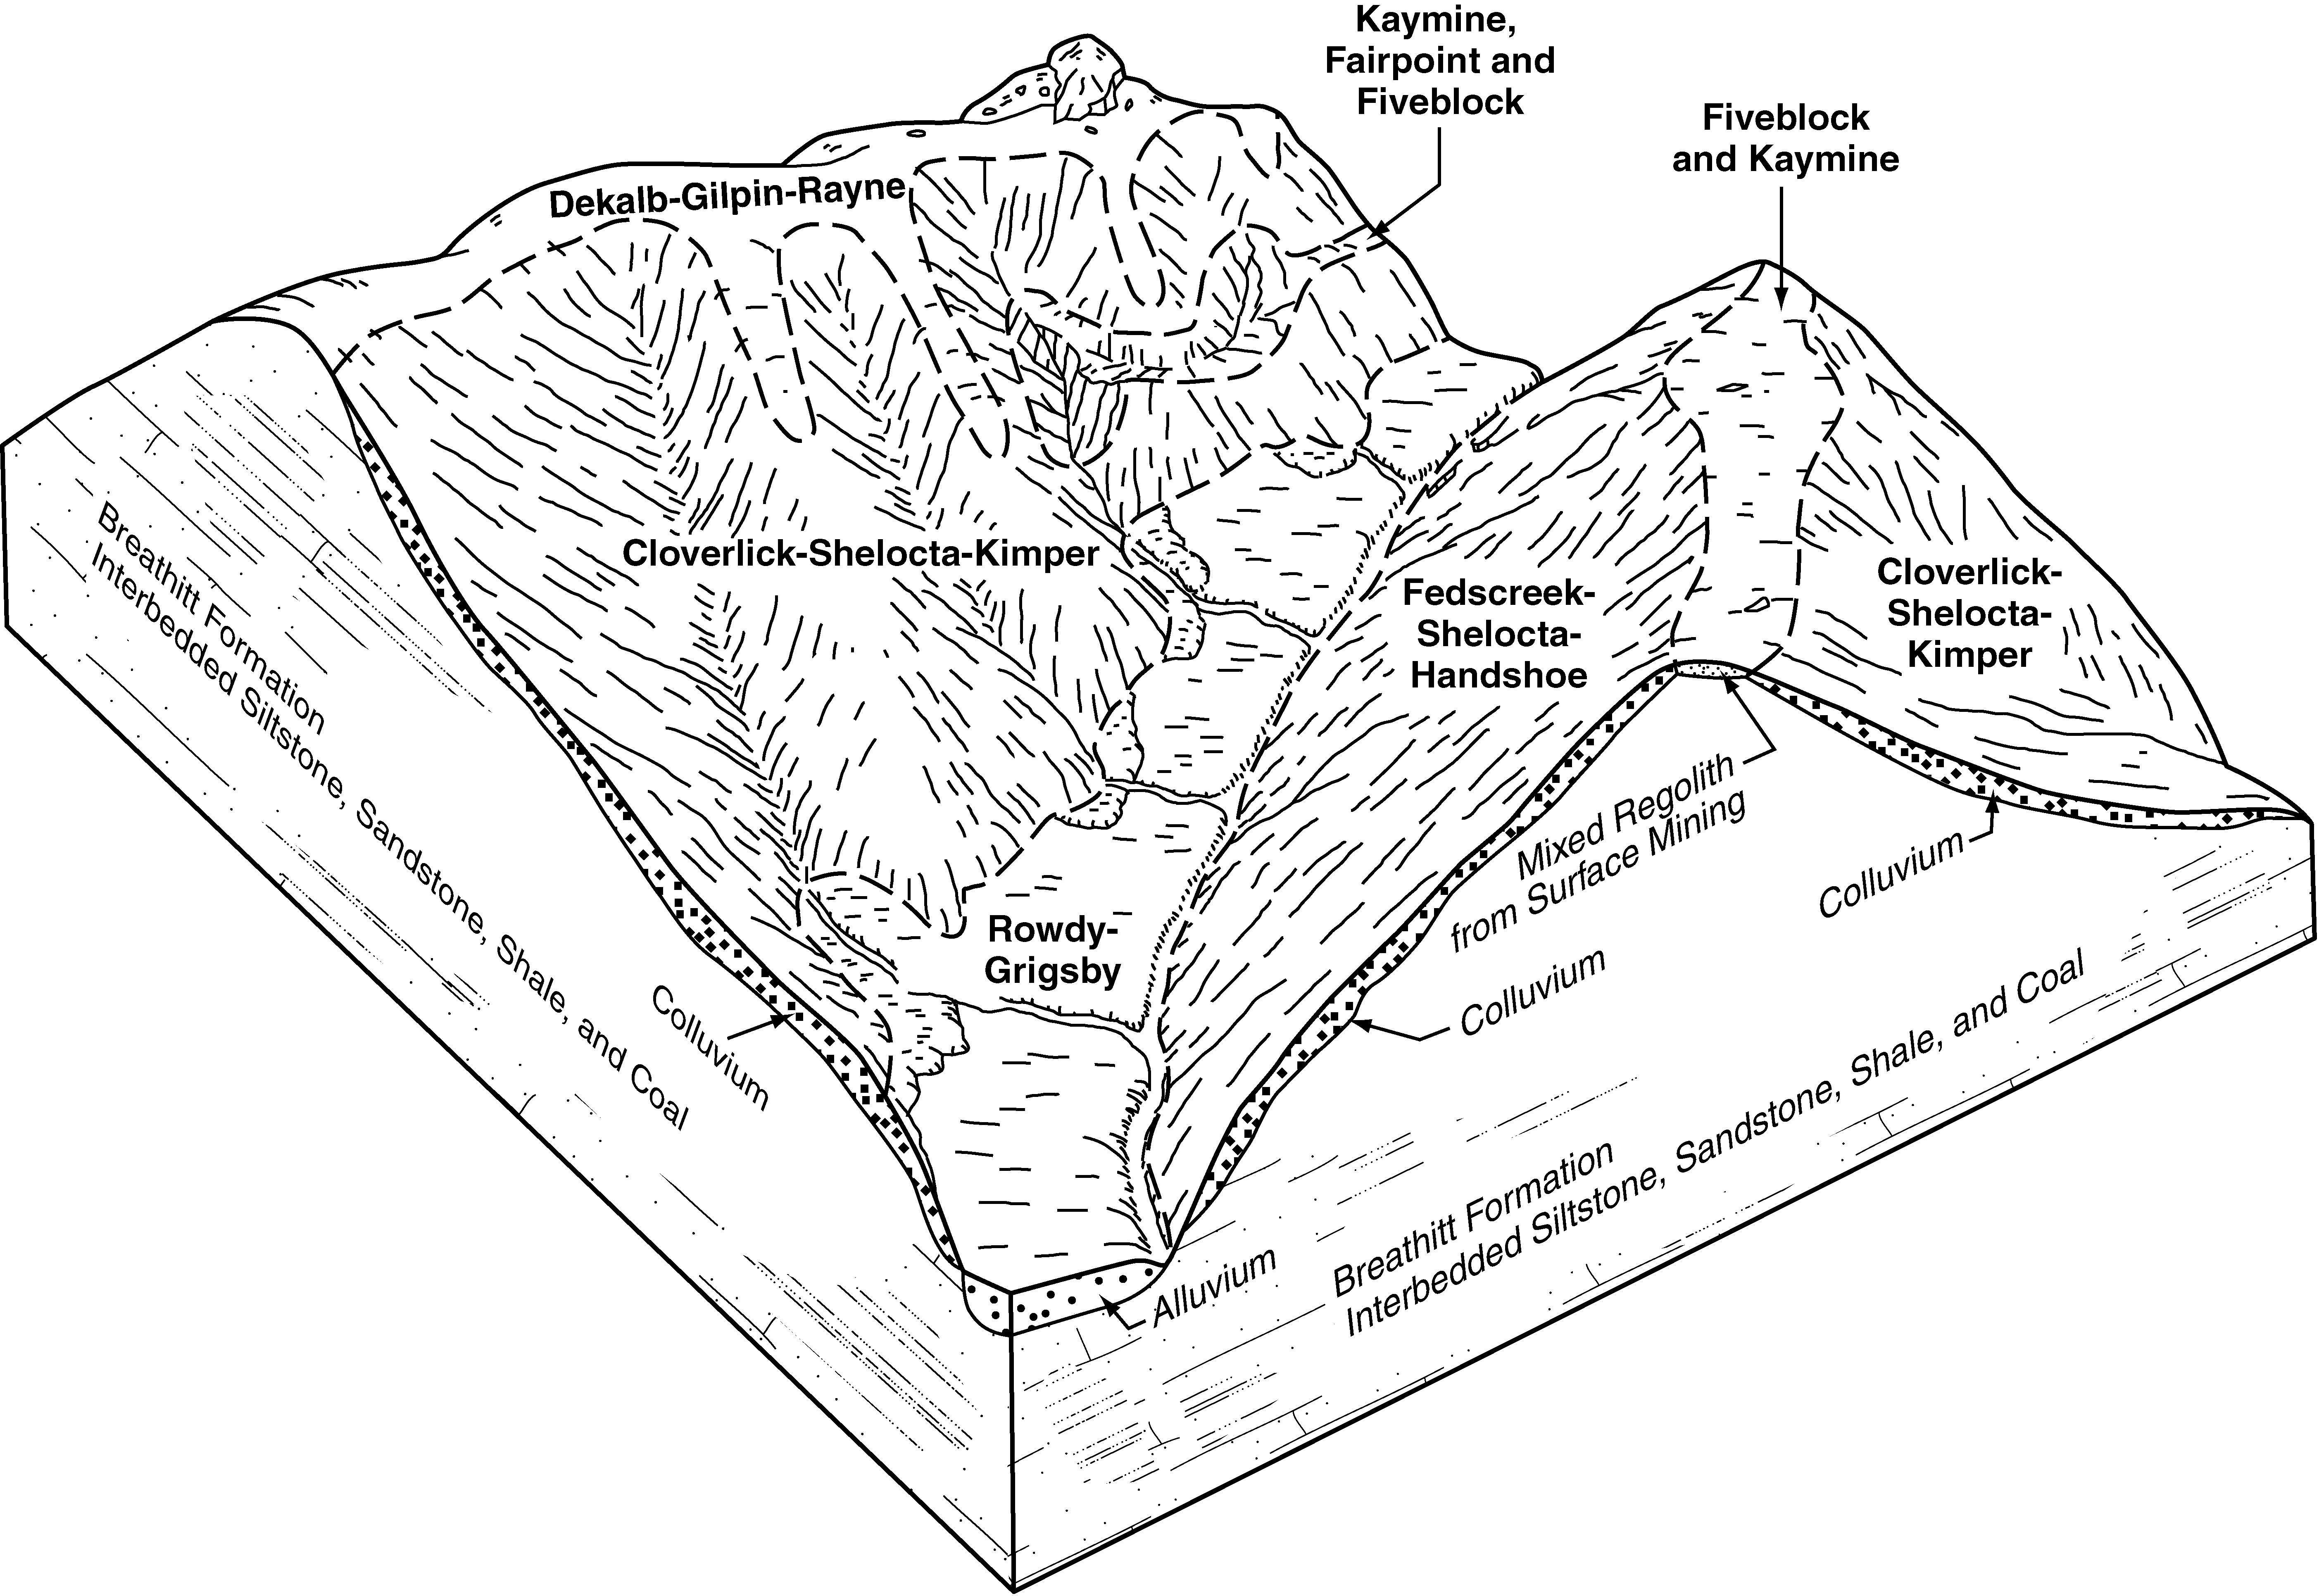
Typical pattern of soils and their relationship to geology and topography in the Shelocta-Cloverlick-Fedscreek-Kimper general soil map unit in Knott County (Soil Survey of Knott and Letcher Counties, Kentucky; 2004).
- KY-2010-09-03-18 | Lawrence and Martin Counties - 2005
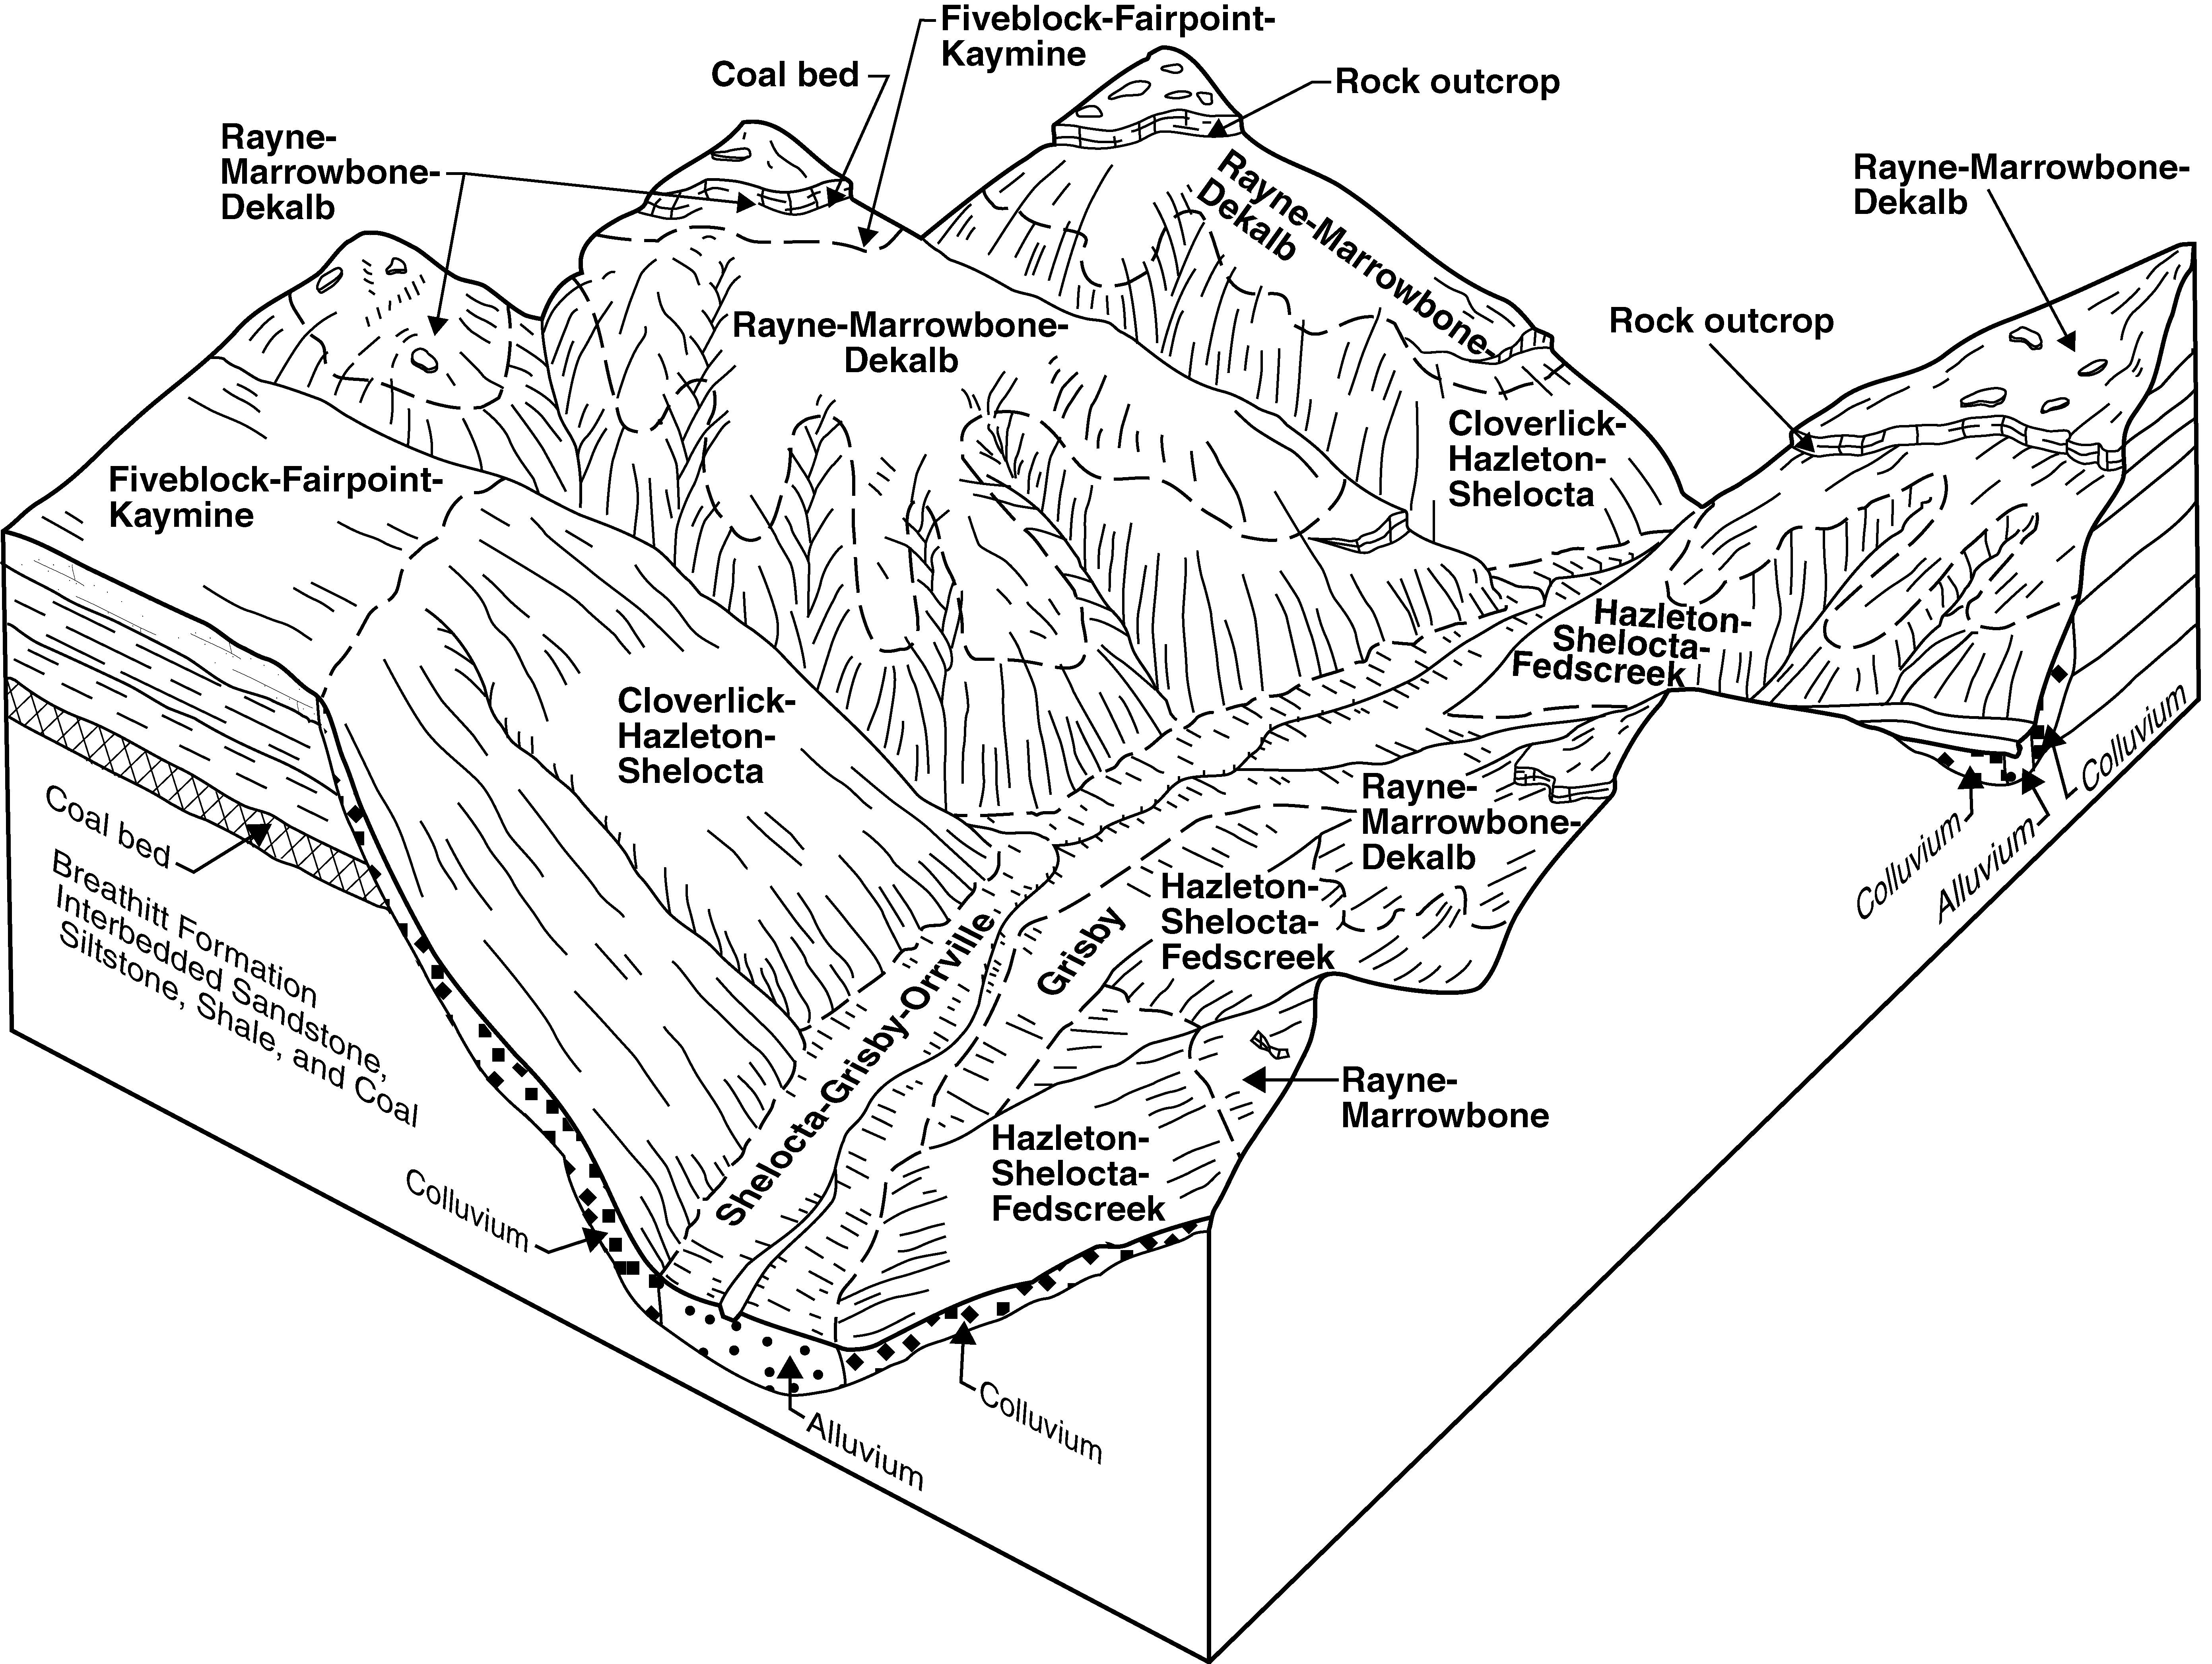
Typical pattern of soils, parent material, and topography in the Hazleton-Shelocta-Fiveblock and Grigsby-Shelocta-Orrville general soil map units. The Hazleton-Shelocta-Fiveblock general soil map unit is on the mountains and in the surface mined areas, and the Grigsby-Shelocta-Orrville general soil map unit is in the valleys (Soil Survey of Lawrence and Martin Counties, Kentucky; 2005).
- KY-2010-09-03-19 | Lawrence and Martin Counties - 2005
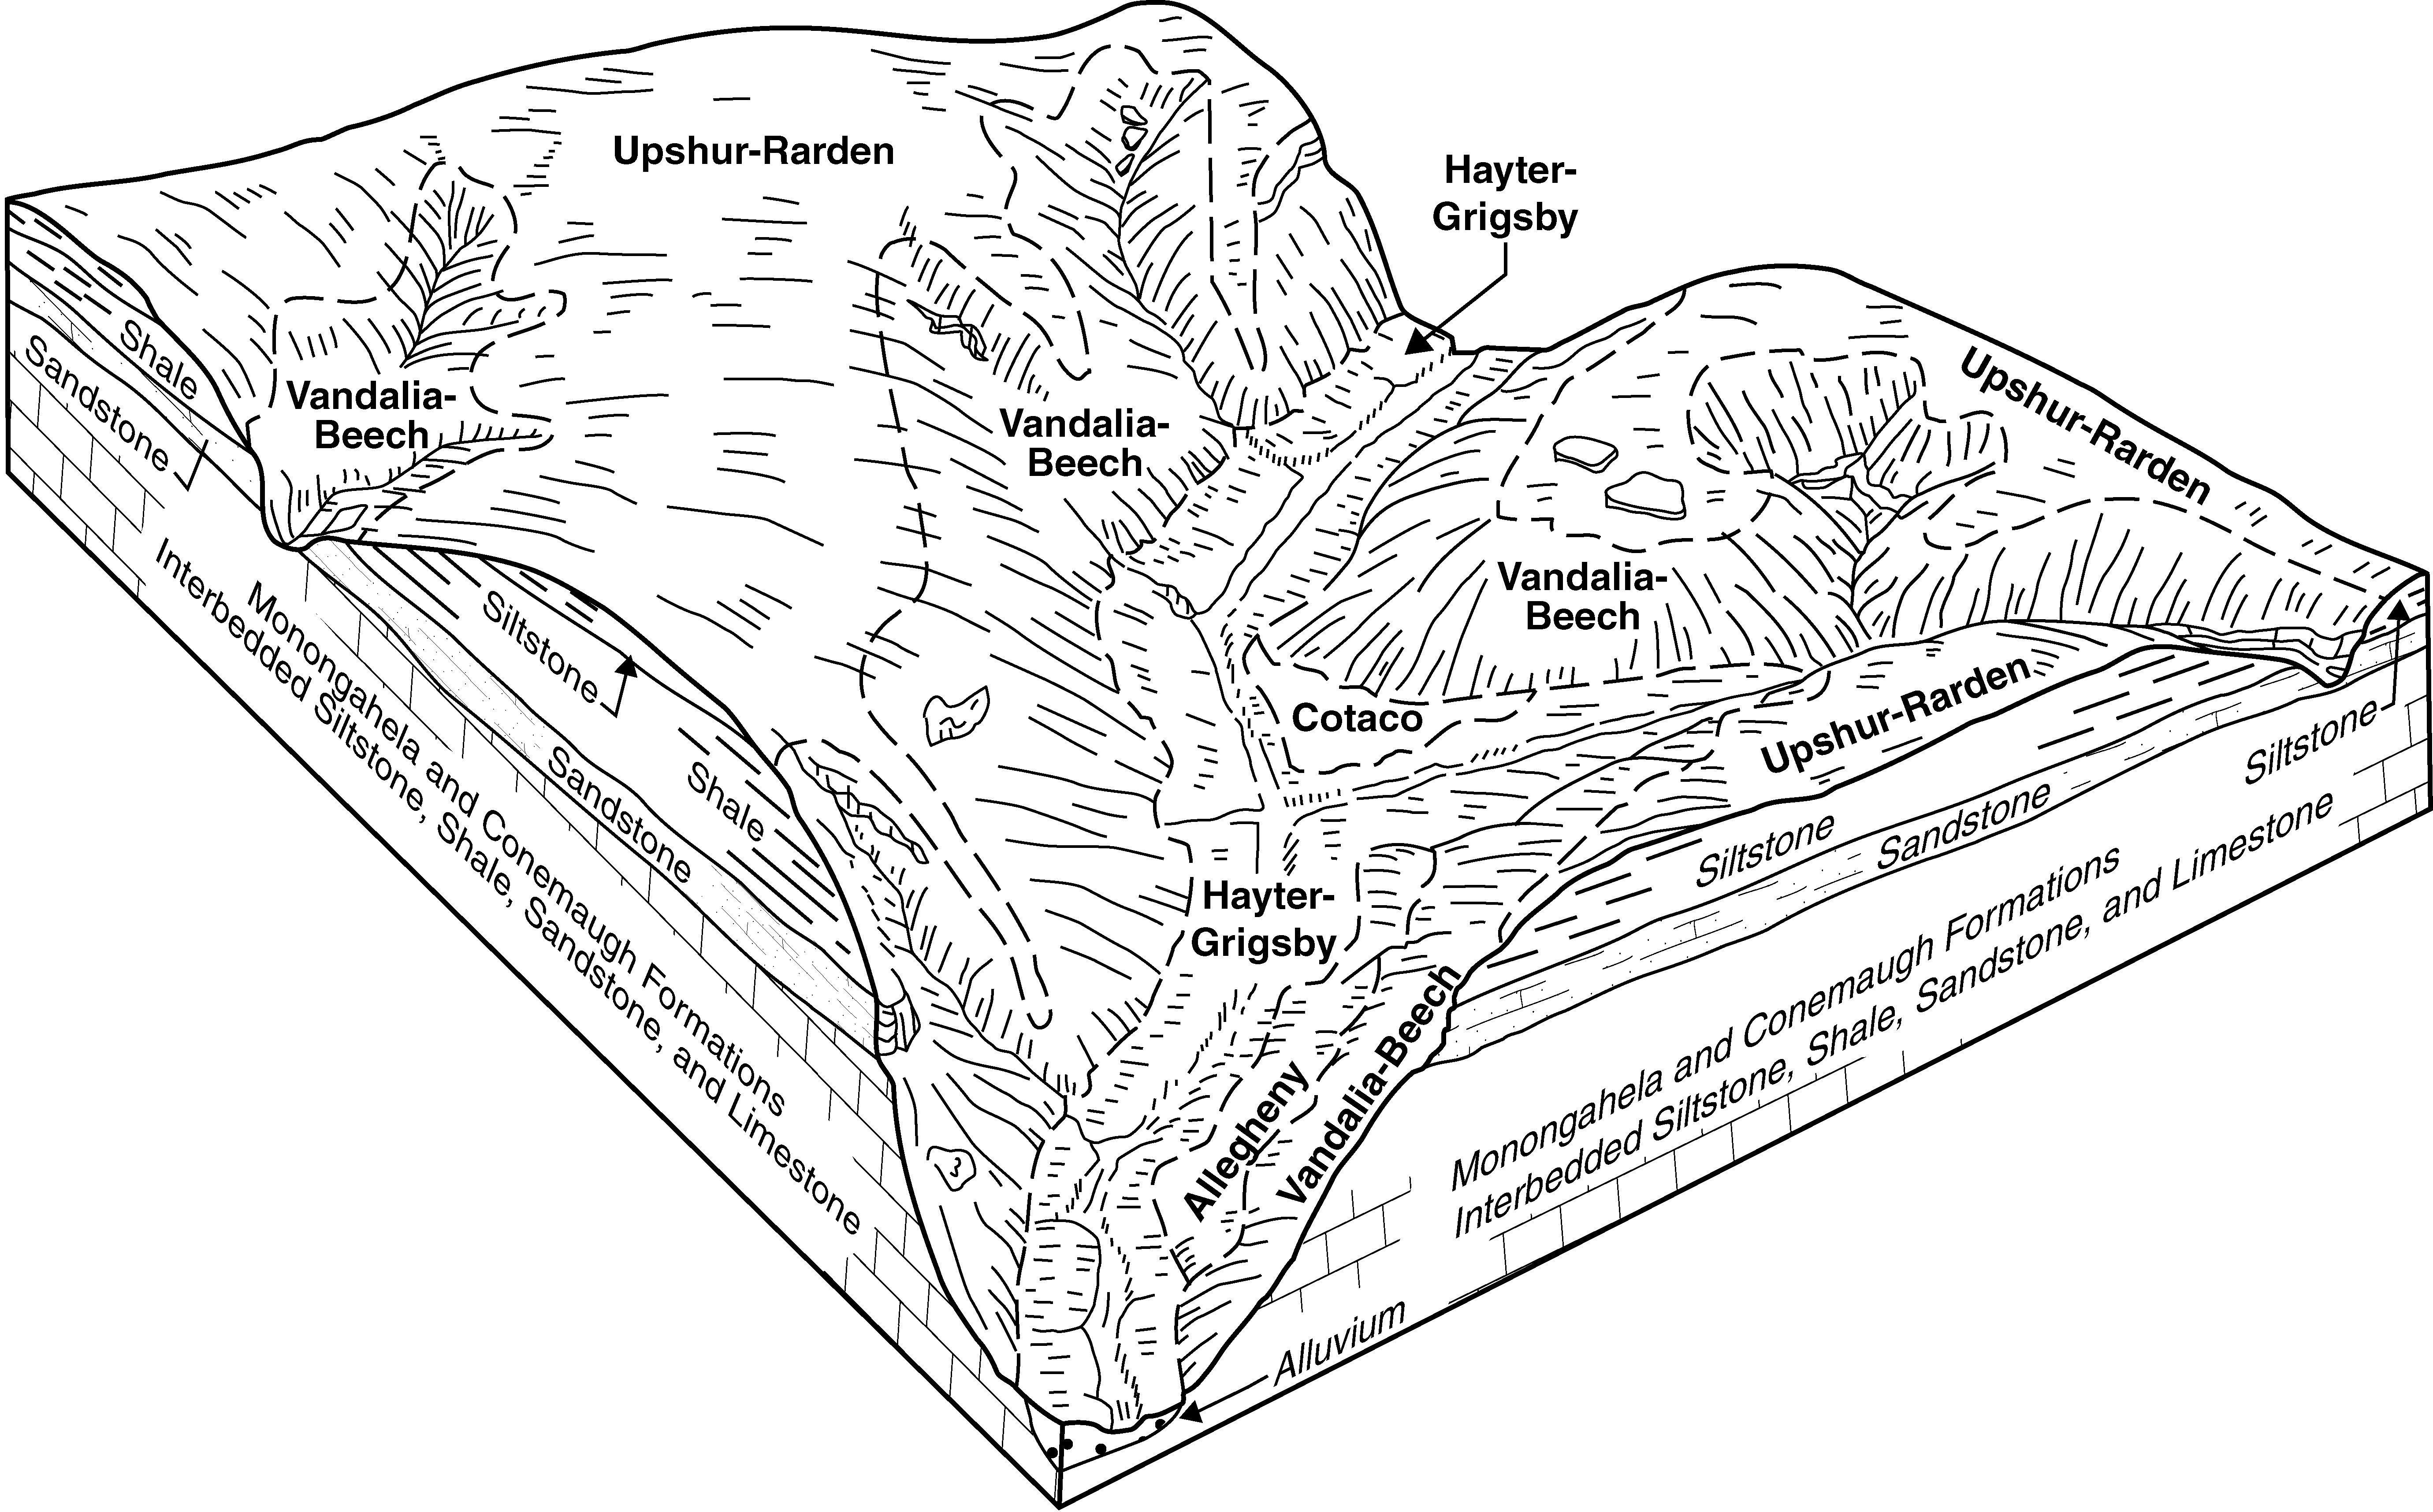
Typical pattern of soils, parent material, and topograhy in the Upshur-Vandalia-Rarden general soil map unit. This map unit is on the mountains (Soil Survey of Lawrence and Martin Counties, Kentucky; 2005).
- KY-2010-09-03-27 | Cumberland County - 1998
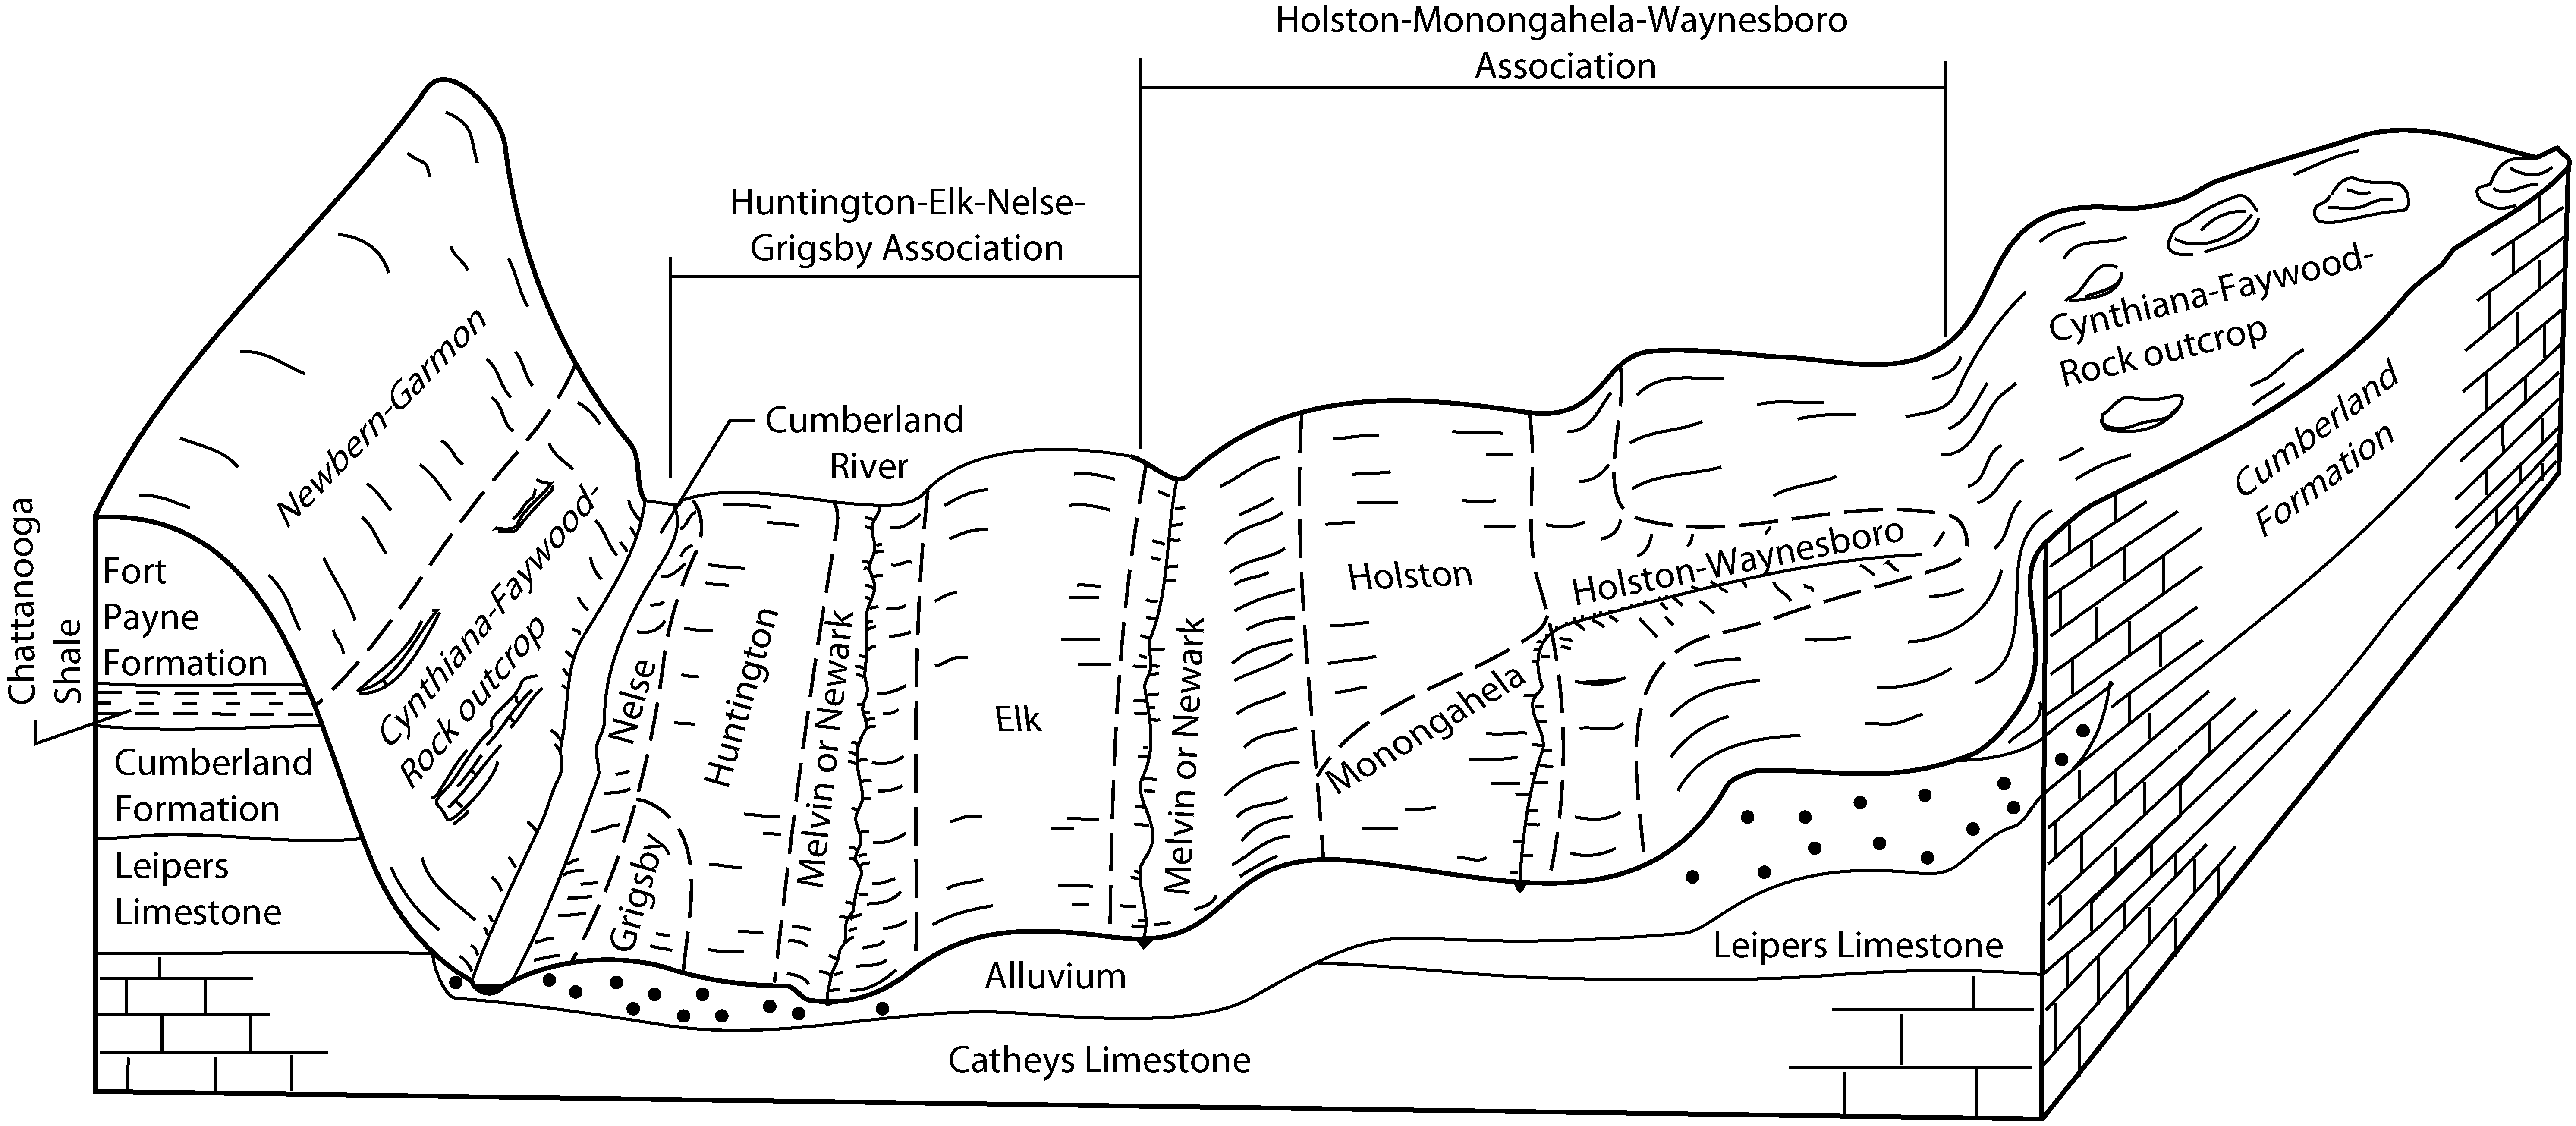
Typical pattern of the soils in the Huntington-Elk-Nelse-Grigsby and Holston-Monongahela-Waynesboro general soil map units and the underlying material (Soil Survey of Cumberland County, Kentucky; 1998).
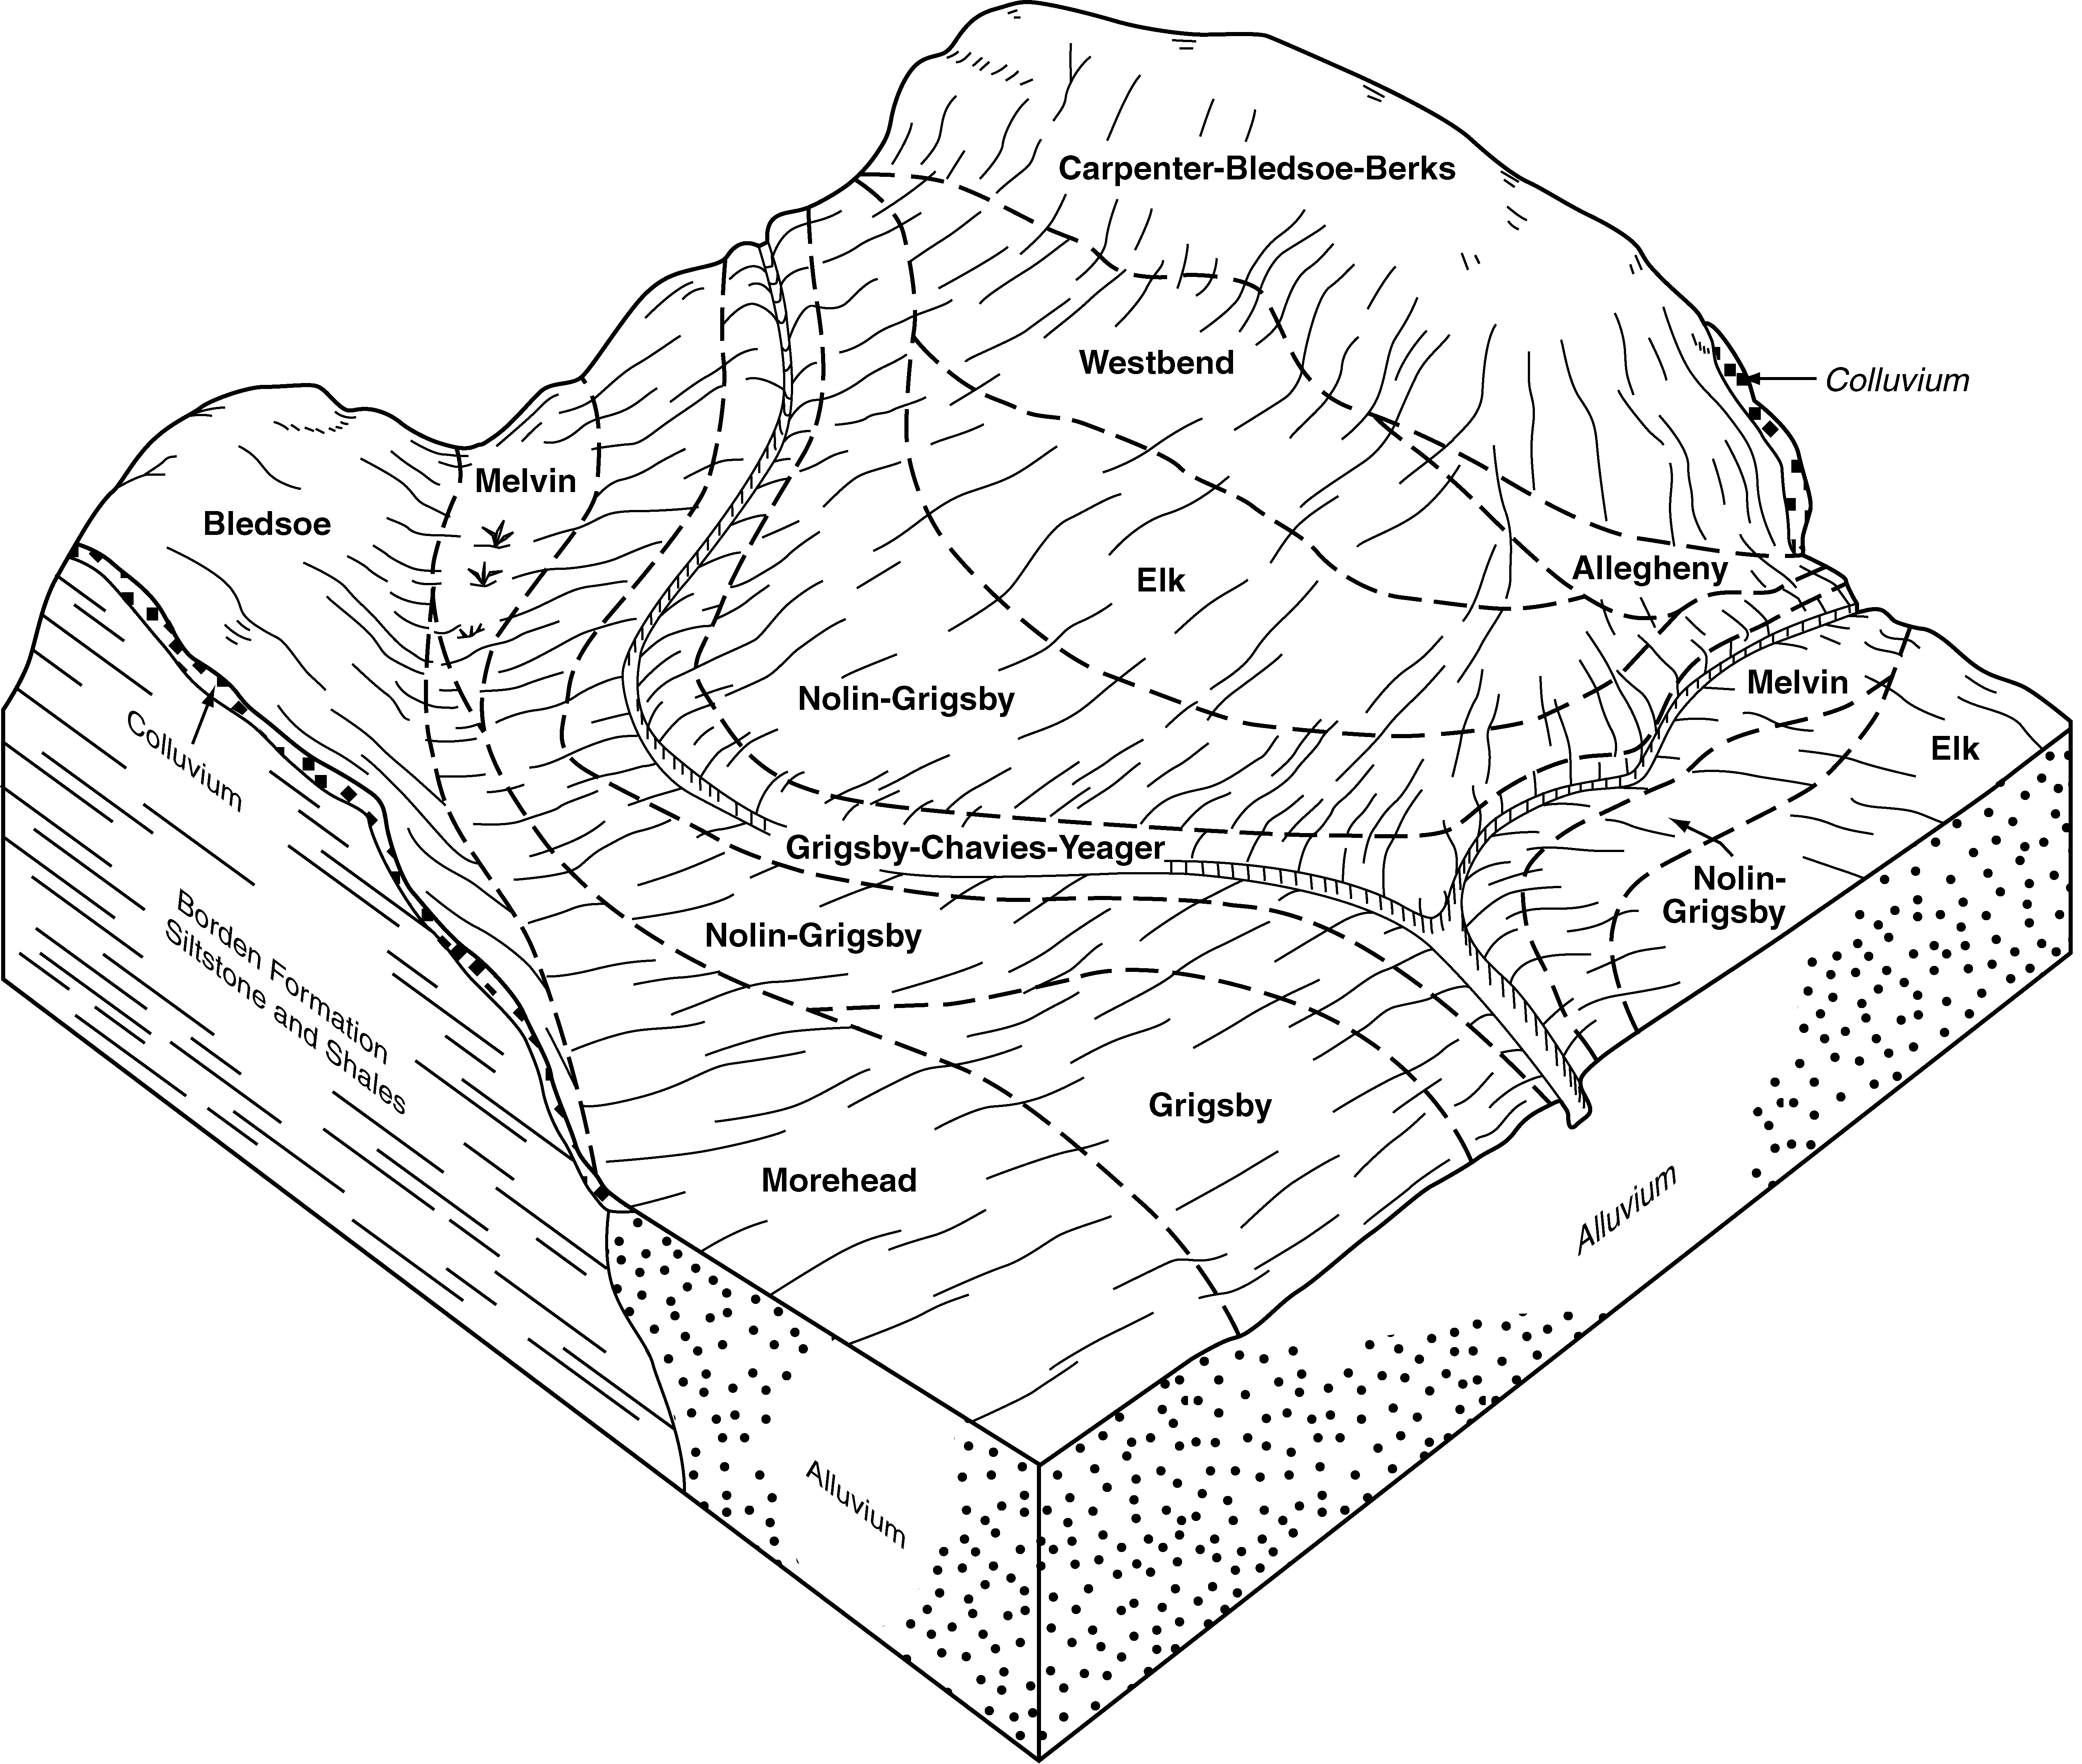
- KY-2010-09-03-30 | Estill and Lee Counties - 2007
Typical pattern of soils and their relationship to geology and topography in the Grigsby-Nolin-Elk-Morehead general soil map unit in Estill County (Soil Survey of Estill and Lee Counties, Kentucky; 2007).
- KY-2010-09-03-33 | Estill and Lee Counties - 2007
Typical pattern of soils and their relationship to geology and topography in the Shelocta-Bledsoe-Gilpin general soil map unit in Estill County (Soil Survey of Estill and Lee Counties, Kentucky; 2007).
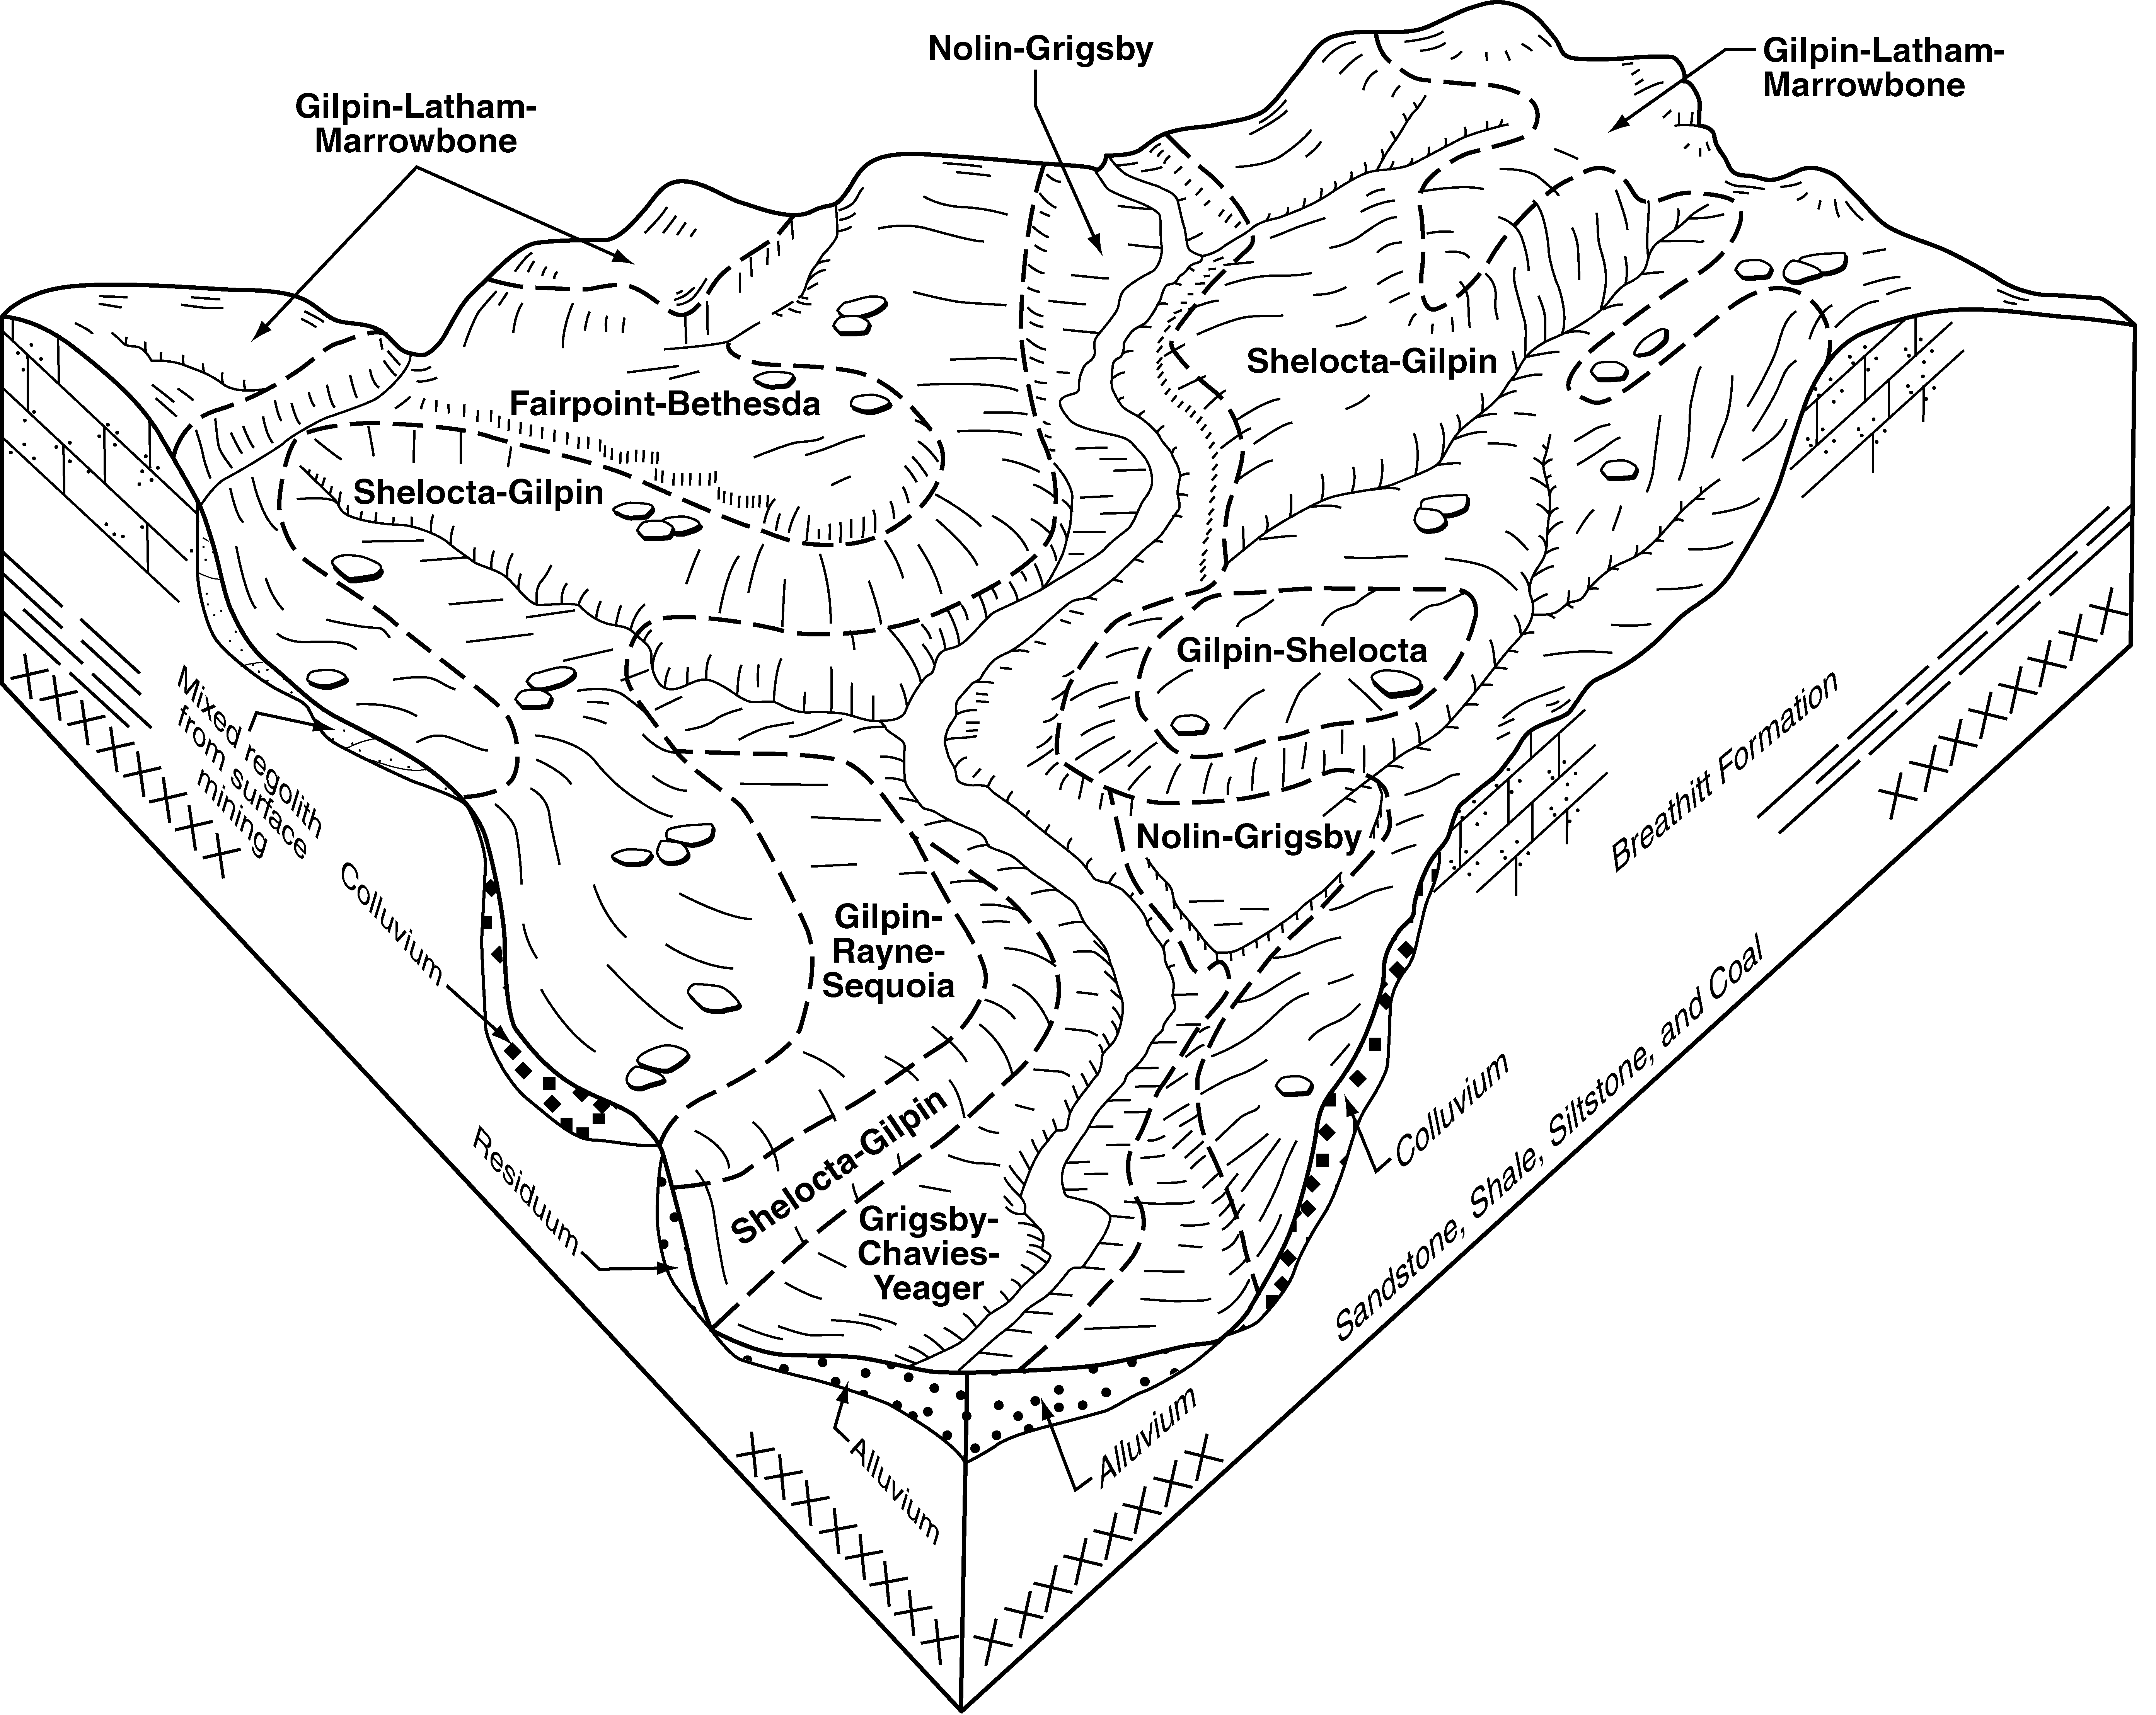
- KY-2010-09-03-36 | Estill and Lee Counties - 2007
Typical pattern of soils and their relationship to geology and topography in the Shelocta-Gilpin general soil map unit in Lee County (Soil Survey of Estill and Lee Counties, Kentucky; 2007).
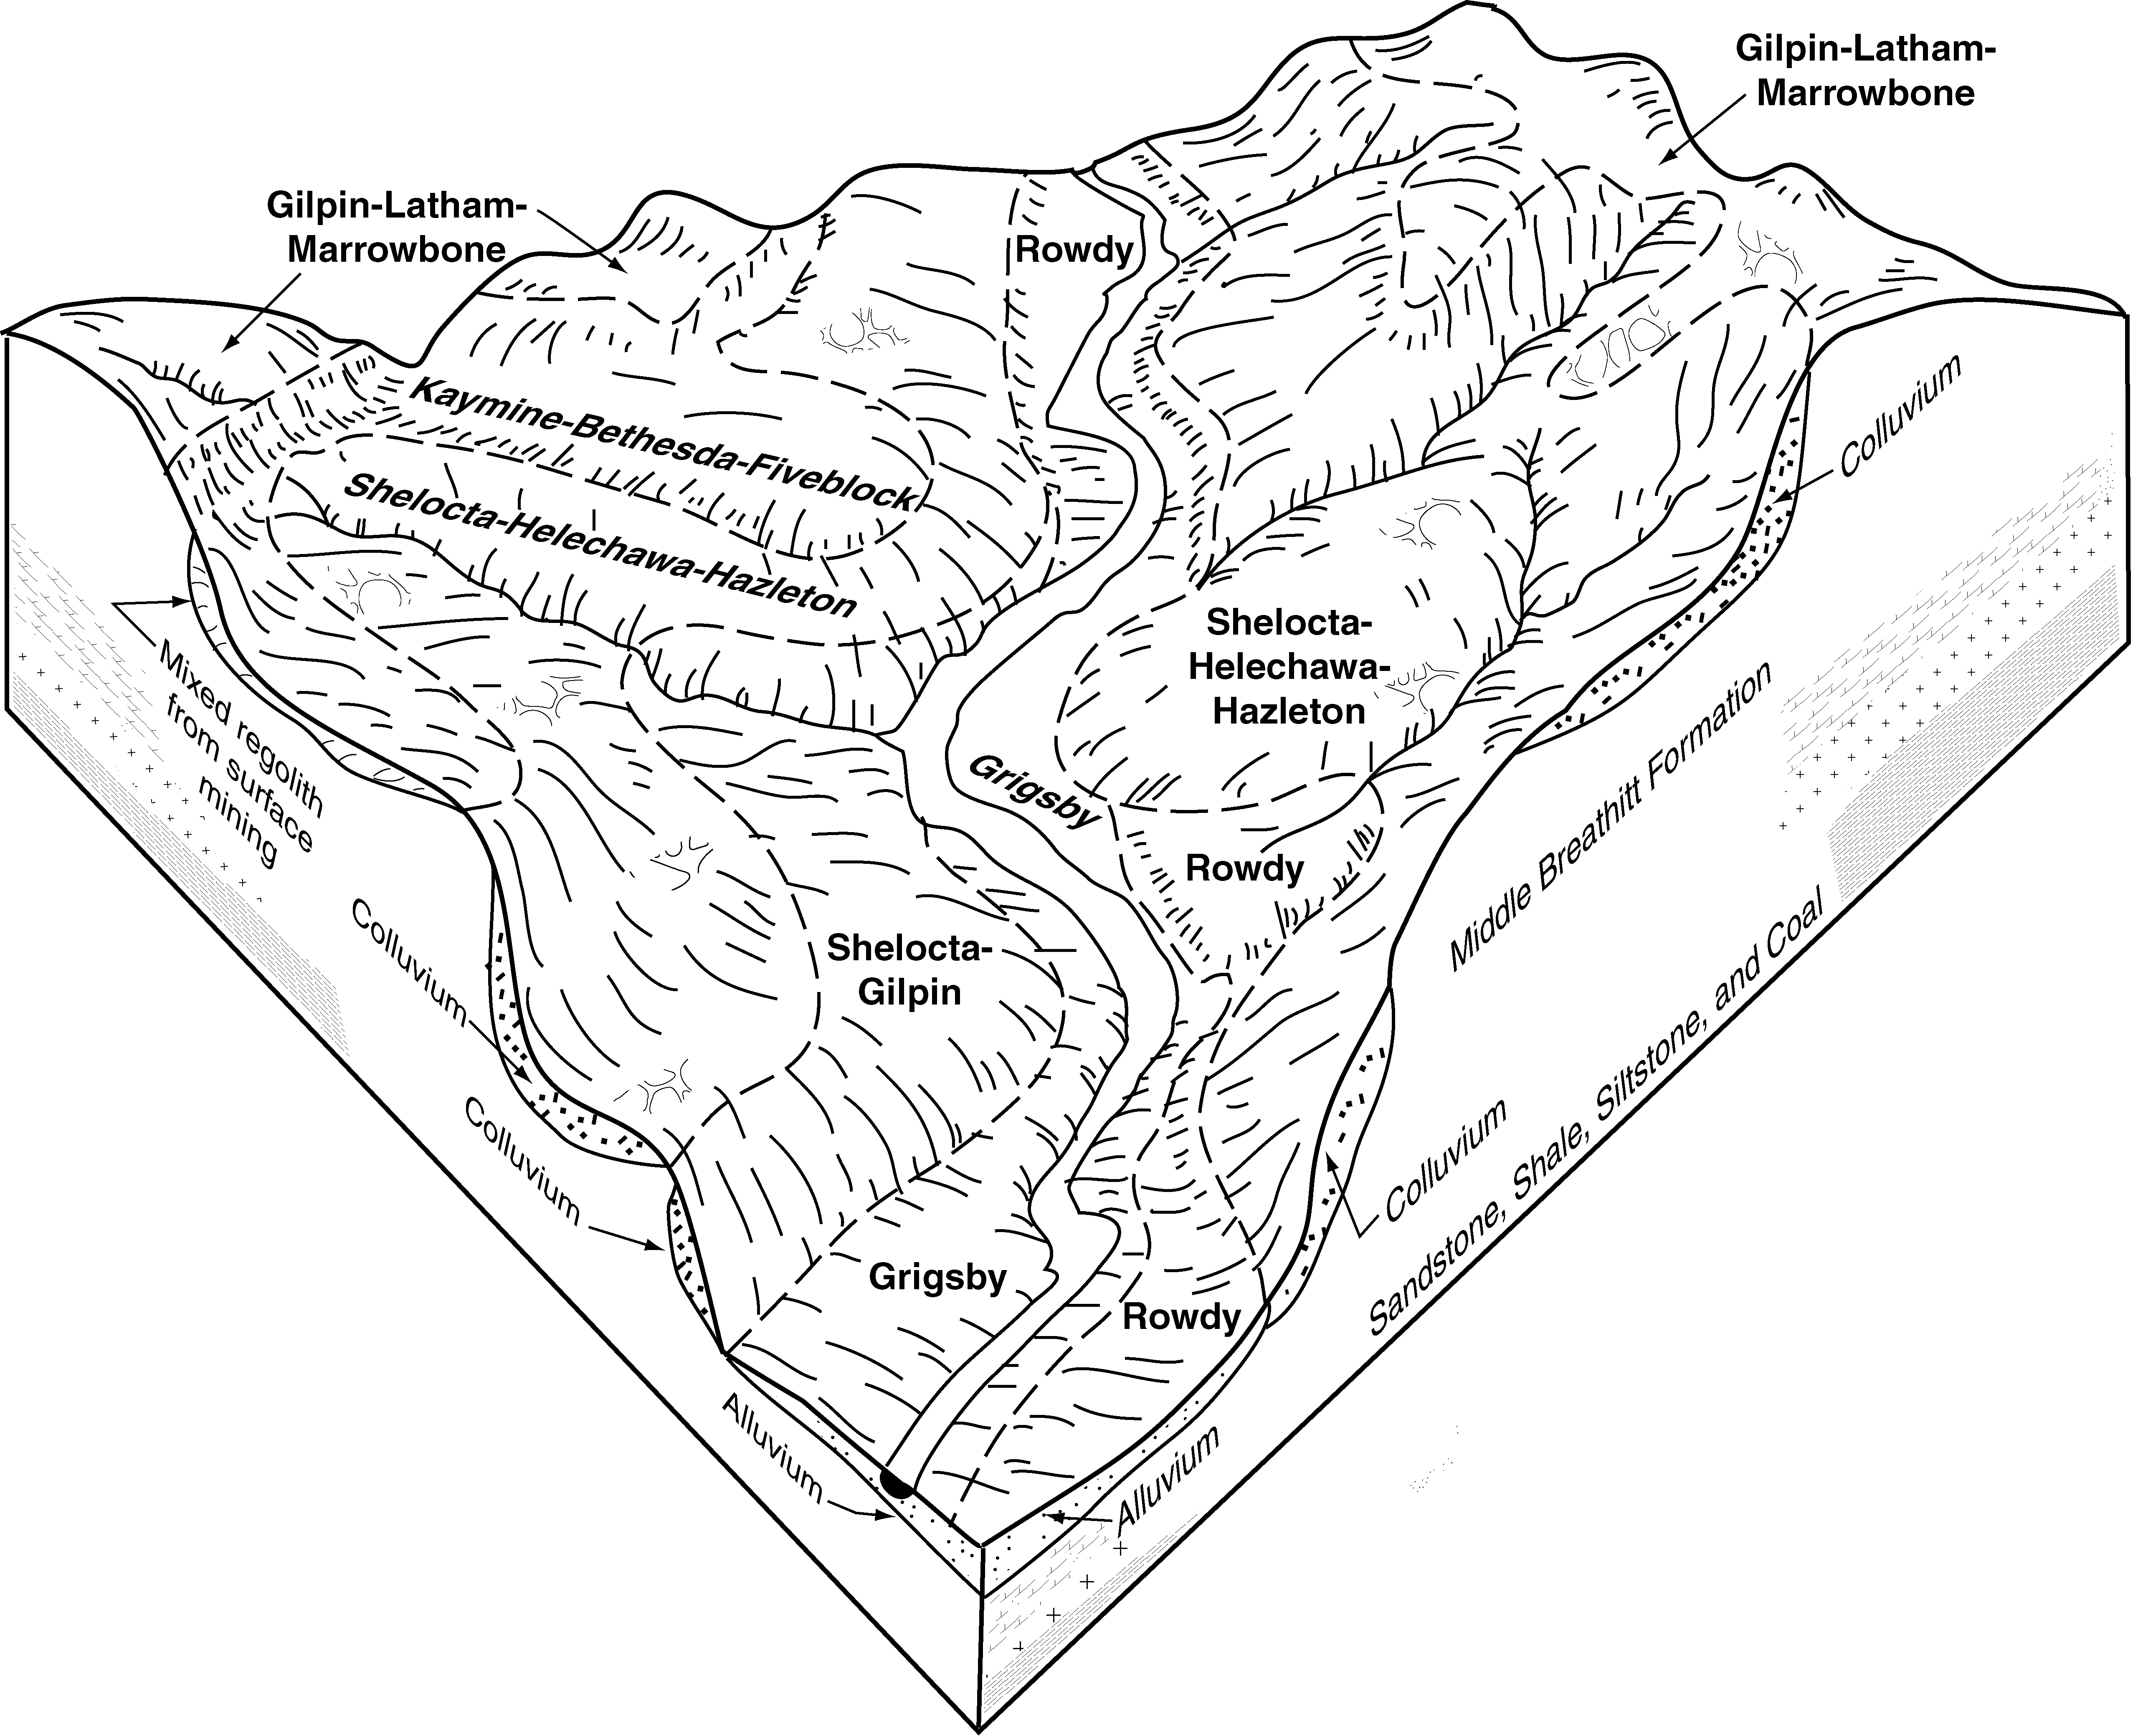
- KY-2010-09-03-39 | Magoffin and Morgan Counties - 2002
Typical pattern of soils and their relationship to geology and topography in the Shelocta-Helechawa-Gilpin-Hazleton general soil map unit in Morgan County (Soil Survey of Magoffin and Morgan Counties, Kentucky; 2002).
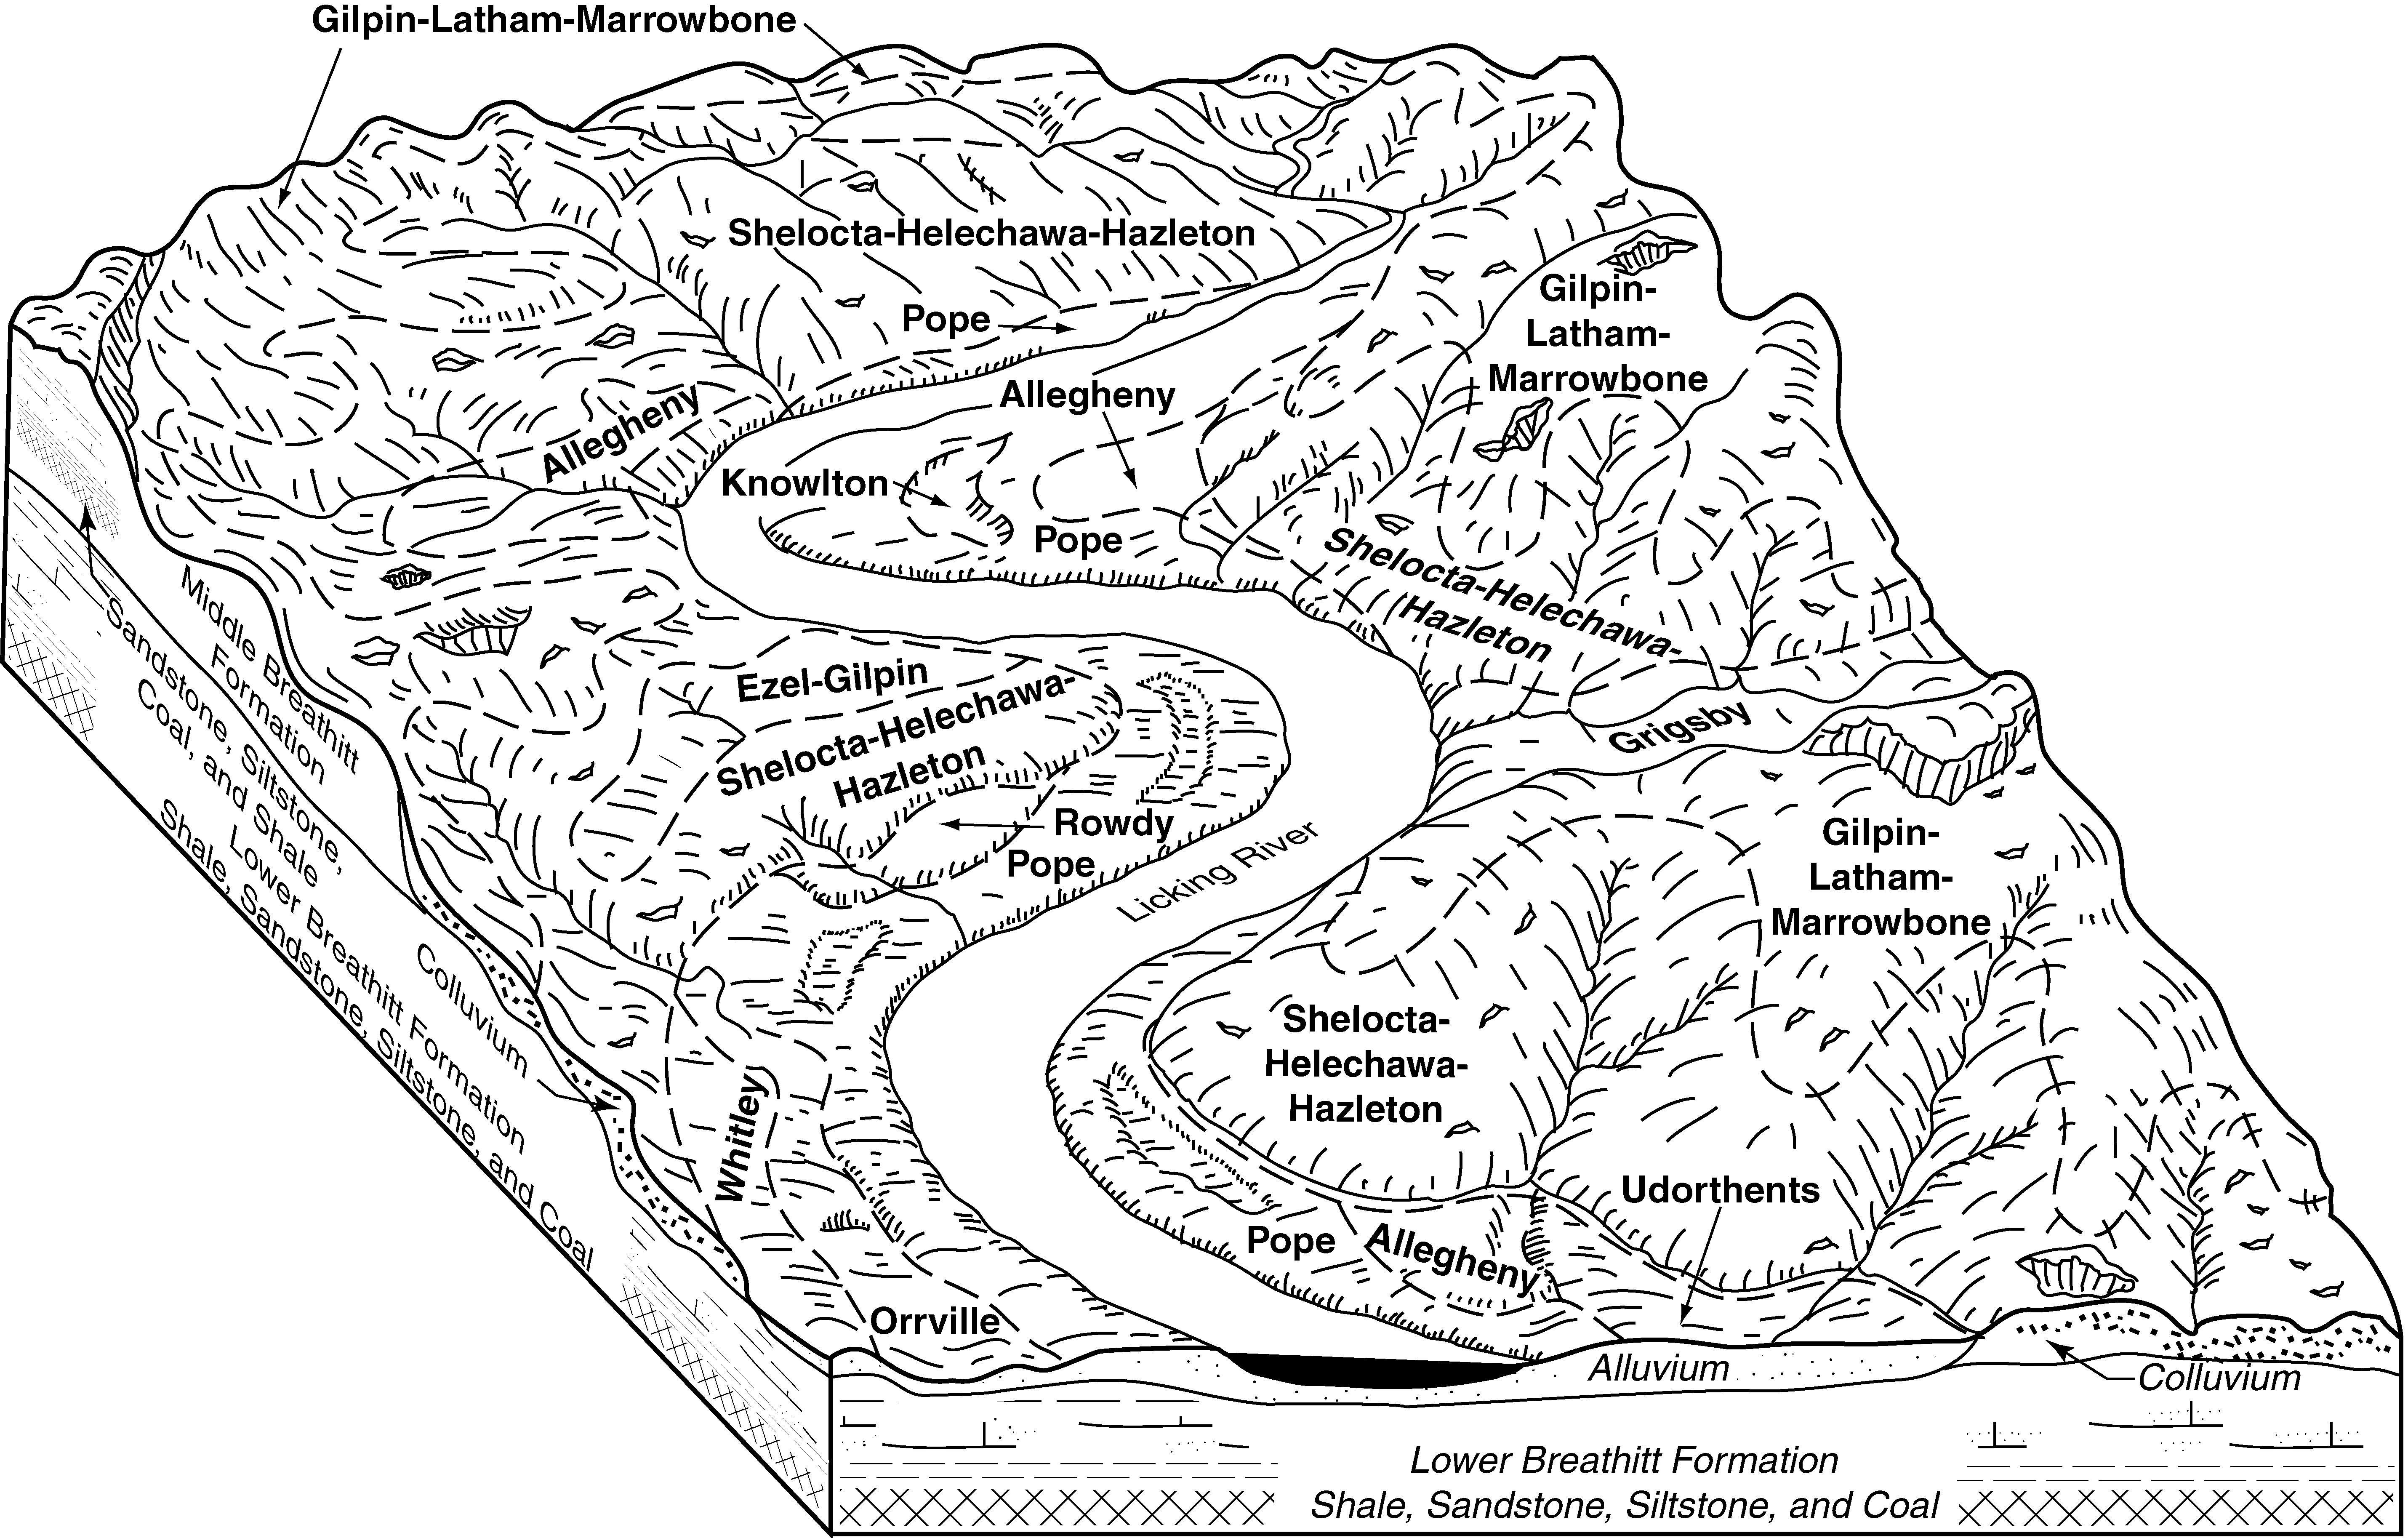
- KY-2010-09-03-40 | Magoffin and Morgan Counties - 2002
Typical pattern of soils and their relationship to geology and topography in the Shelocta-Pope-Helechawa-Gilpin general soil map unit in Magoffin County (Soil Survey of Magoffin and Morgan Counties, Kentucky; 2002).
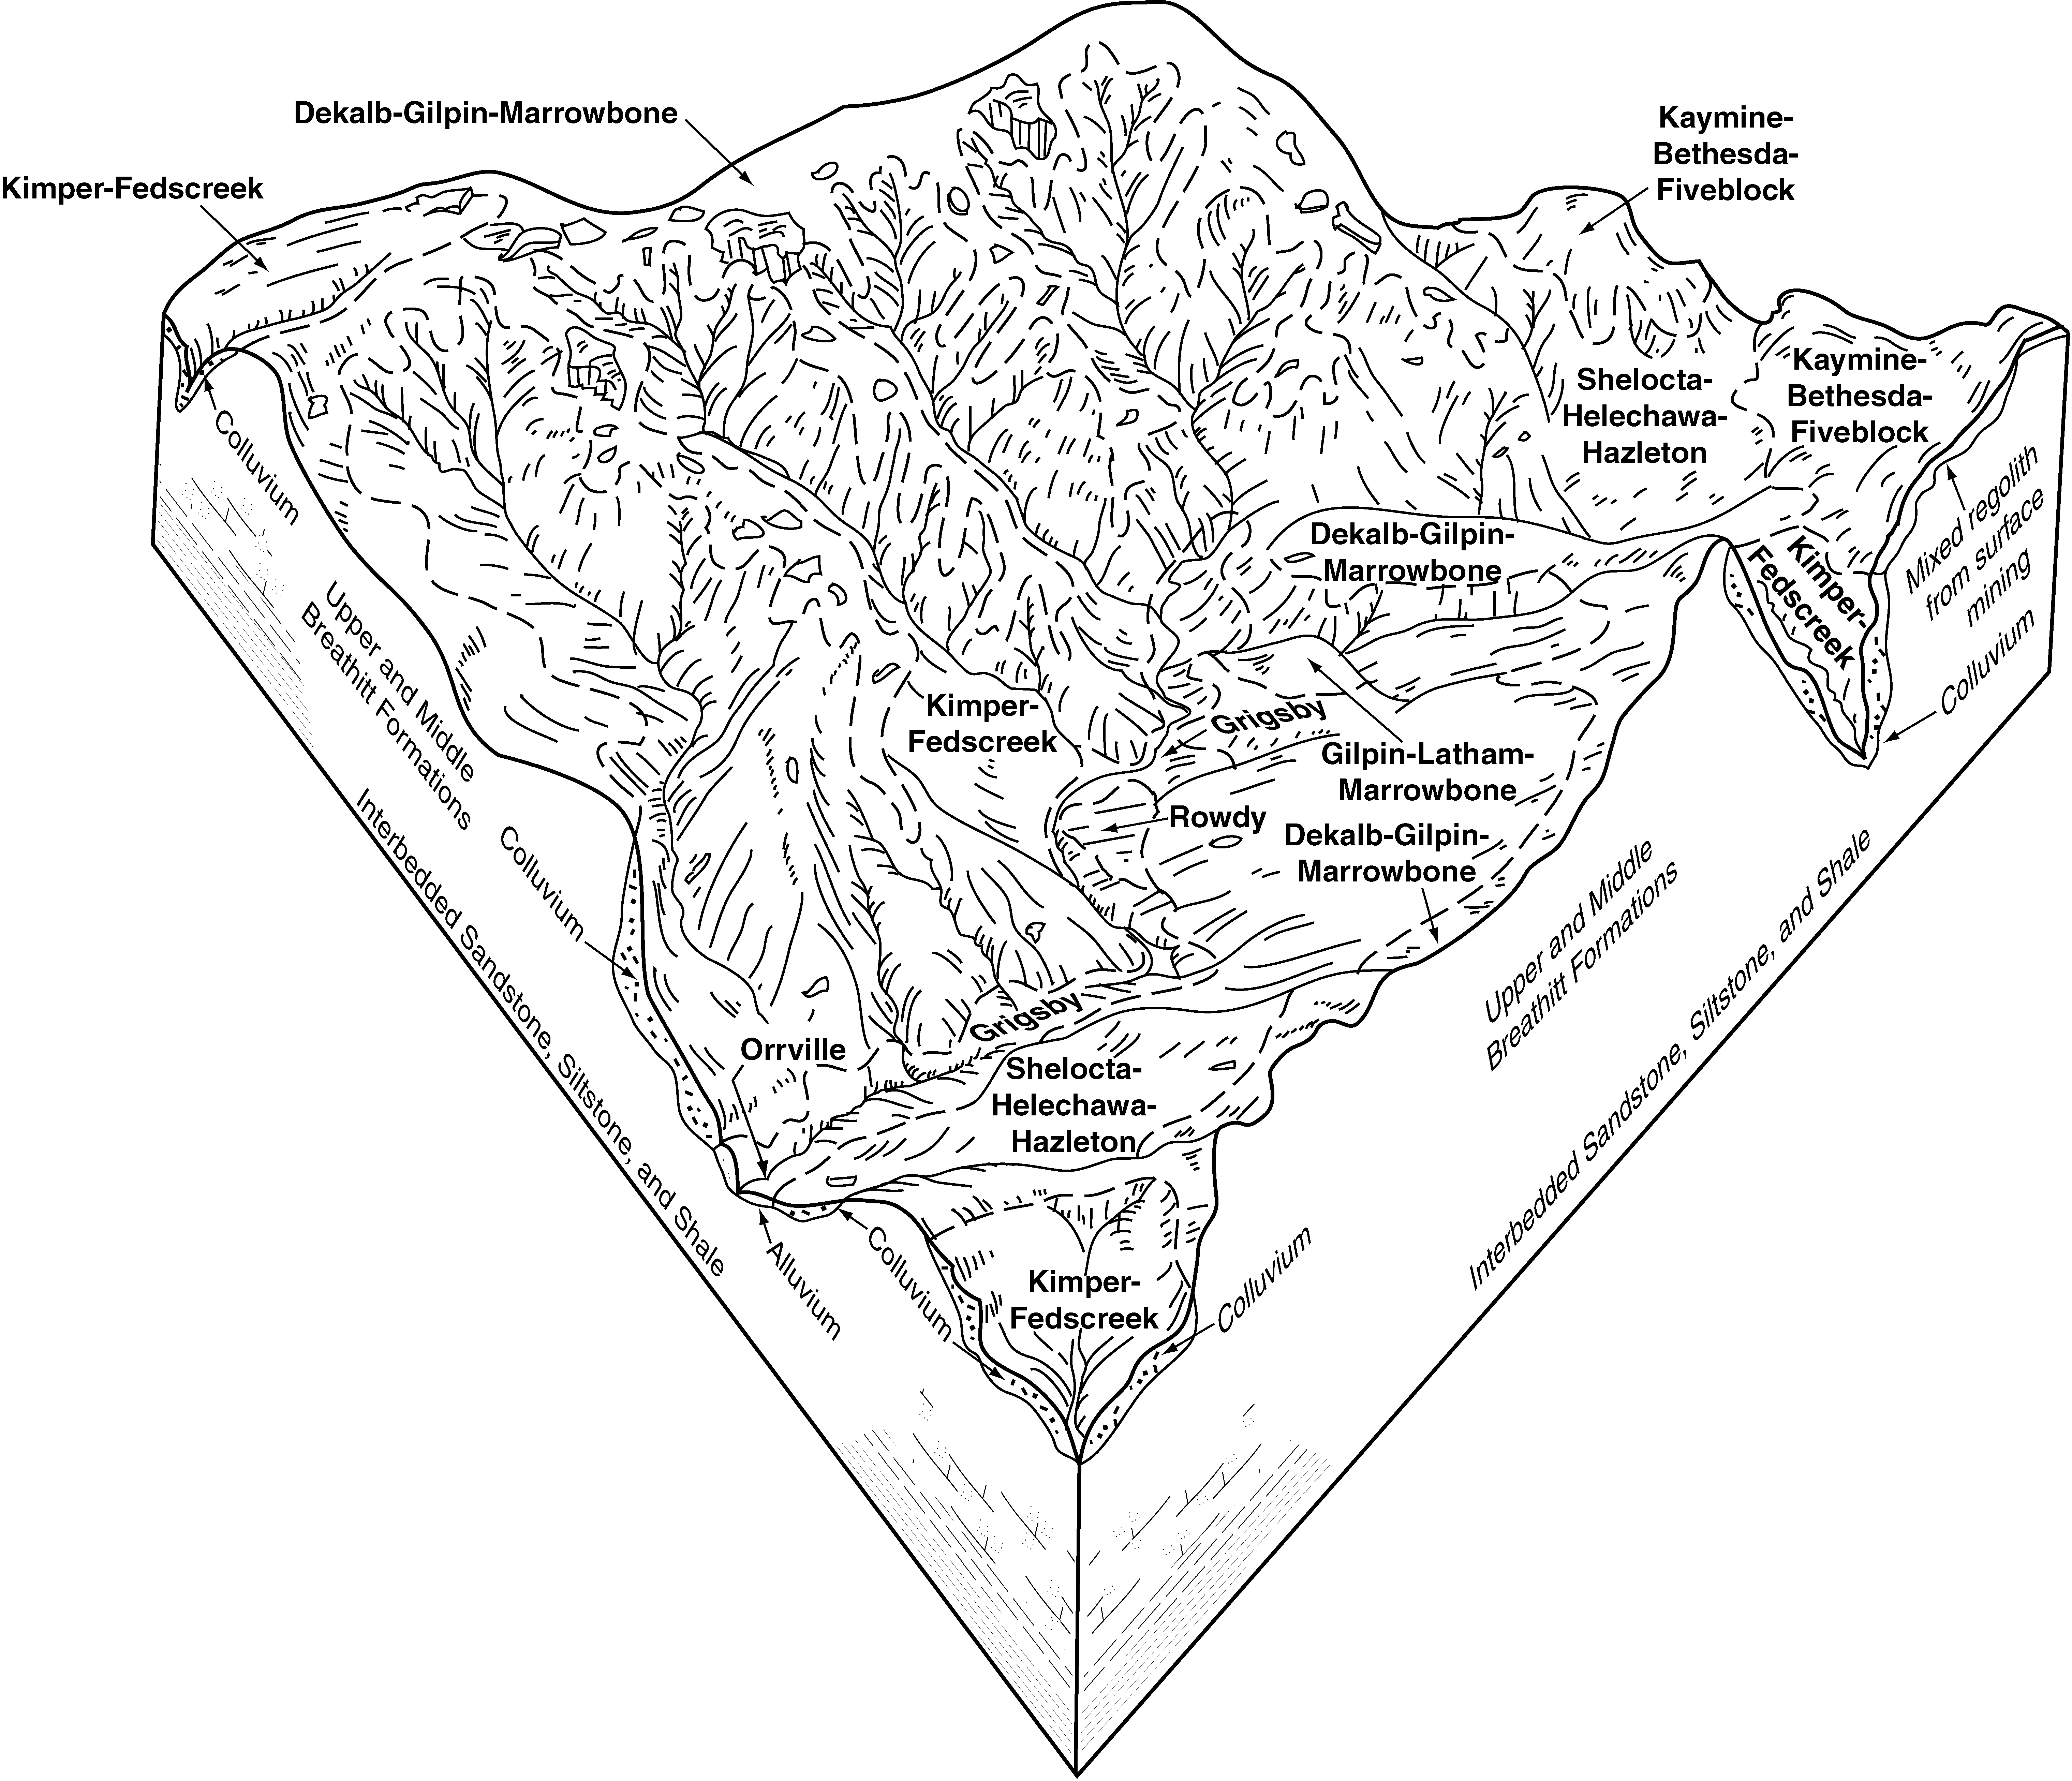
- KY-2010-09-03-41 | Magoffin and Morgan Counties - 2002
Typical pattern of soils and their relationship to geology and topography in the Kimper-Shelocta-Fedscreek-Gilpin general soil map unit in Magoffin County (Soil Survey of Magoffin and Morgan Counties, Kentucky; 2002).
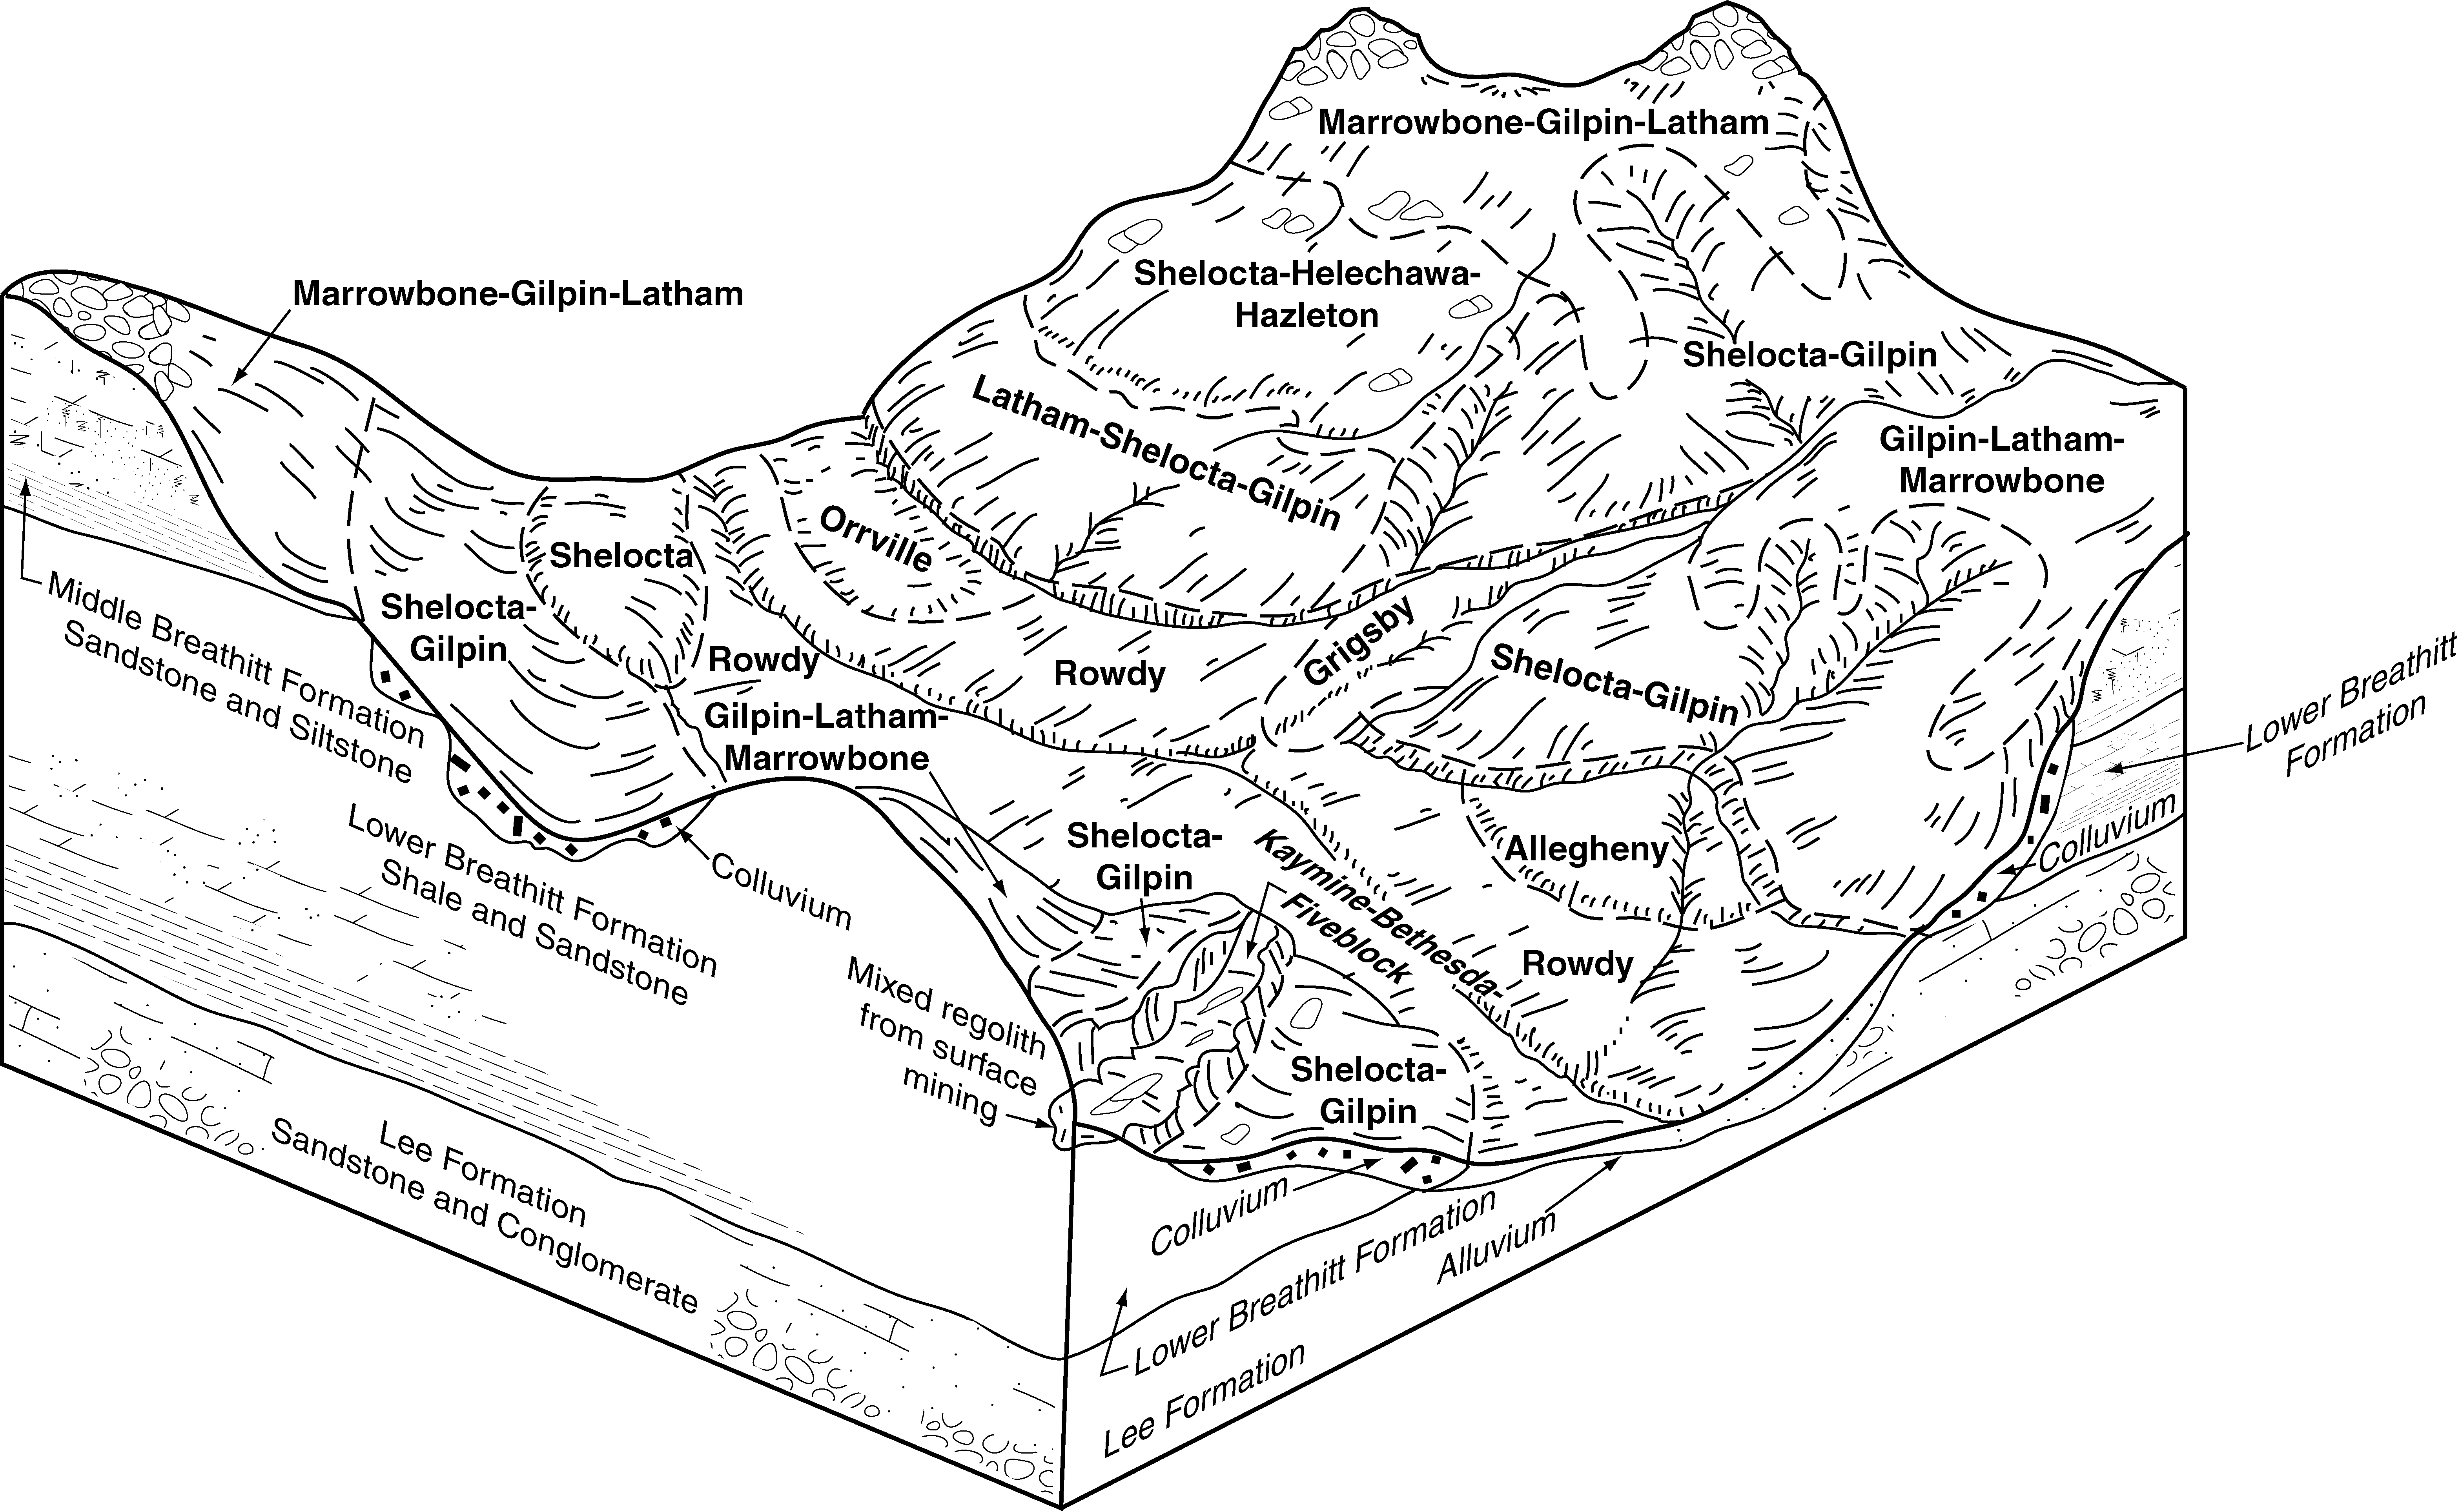
- KY-2010-09-03-42 | Magoffin and Morgan Counties - 2002
Typical pattern of soils and their relationship to geology and topography in the Shelocta-Gilpin-Latham-Marrowbone general soil map unit in Morgan County (Soil Survey of Magoffin and Morgan Counties, Kentucky; 2002).
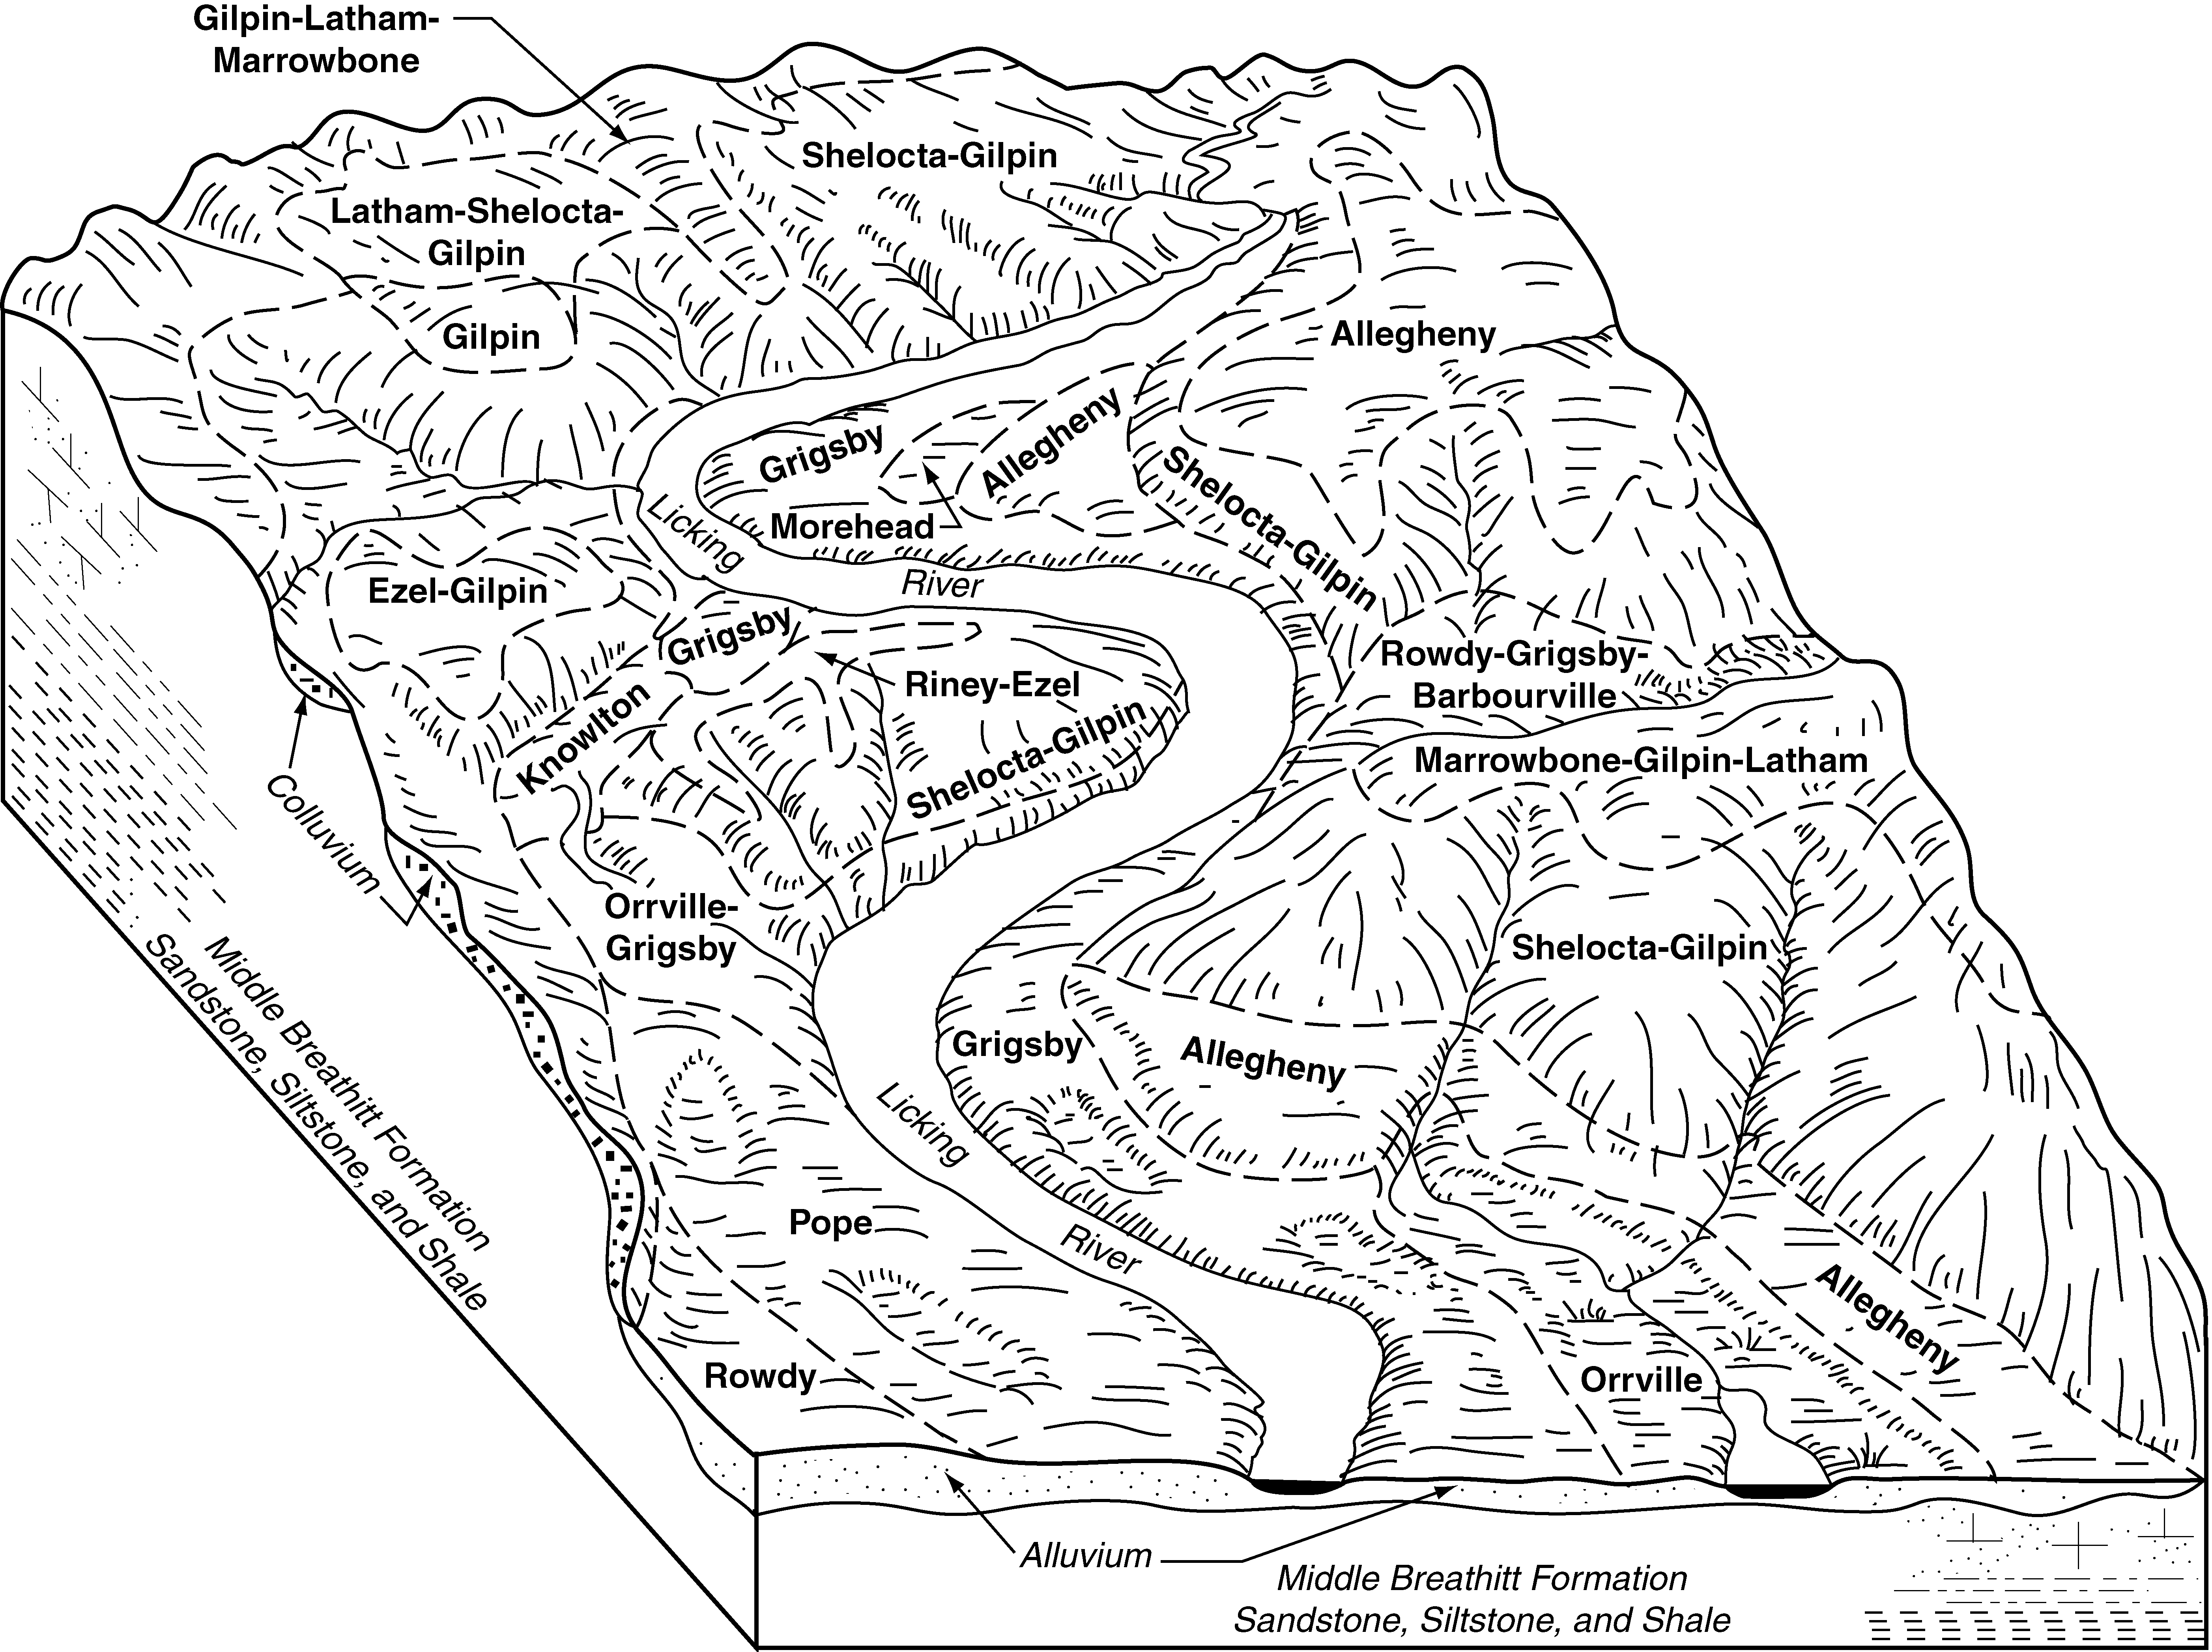
- KY-2010-09-03-46 | Magoffin and Morgan Counties - 2002
Typical pattern of soils and their relationship to geology and topography in the Shelocta-Gilpin-Allegheny-Grigsby general soil map unit in Morgan County (Soil Survey of Magoffin and Morgan Counties, Kentucky; 2002).
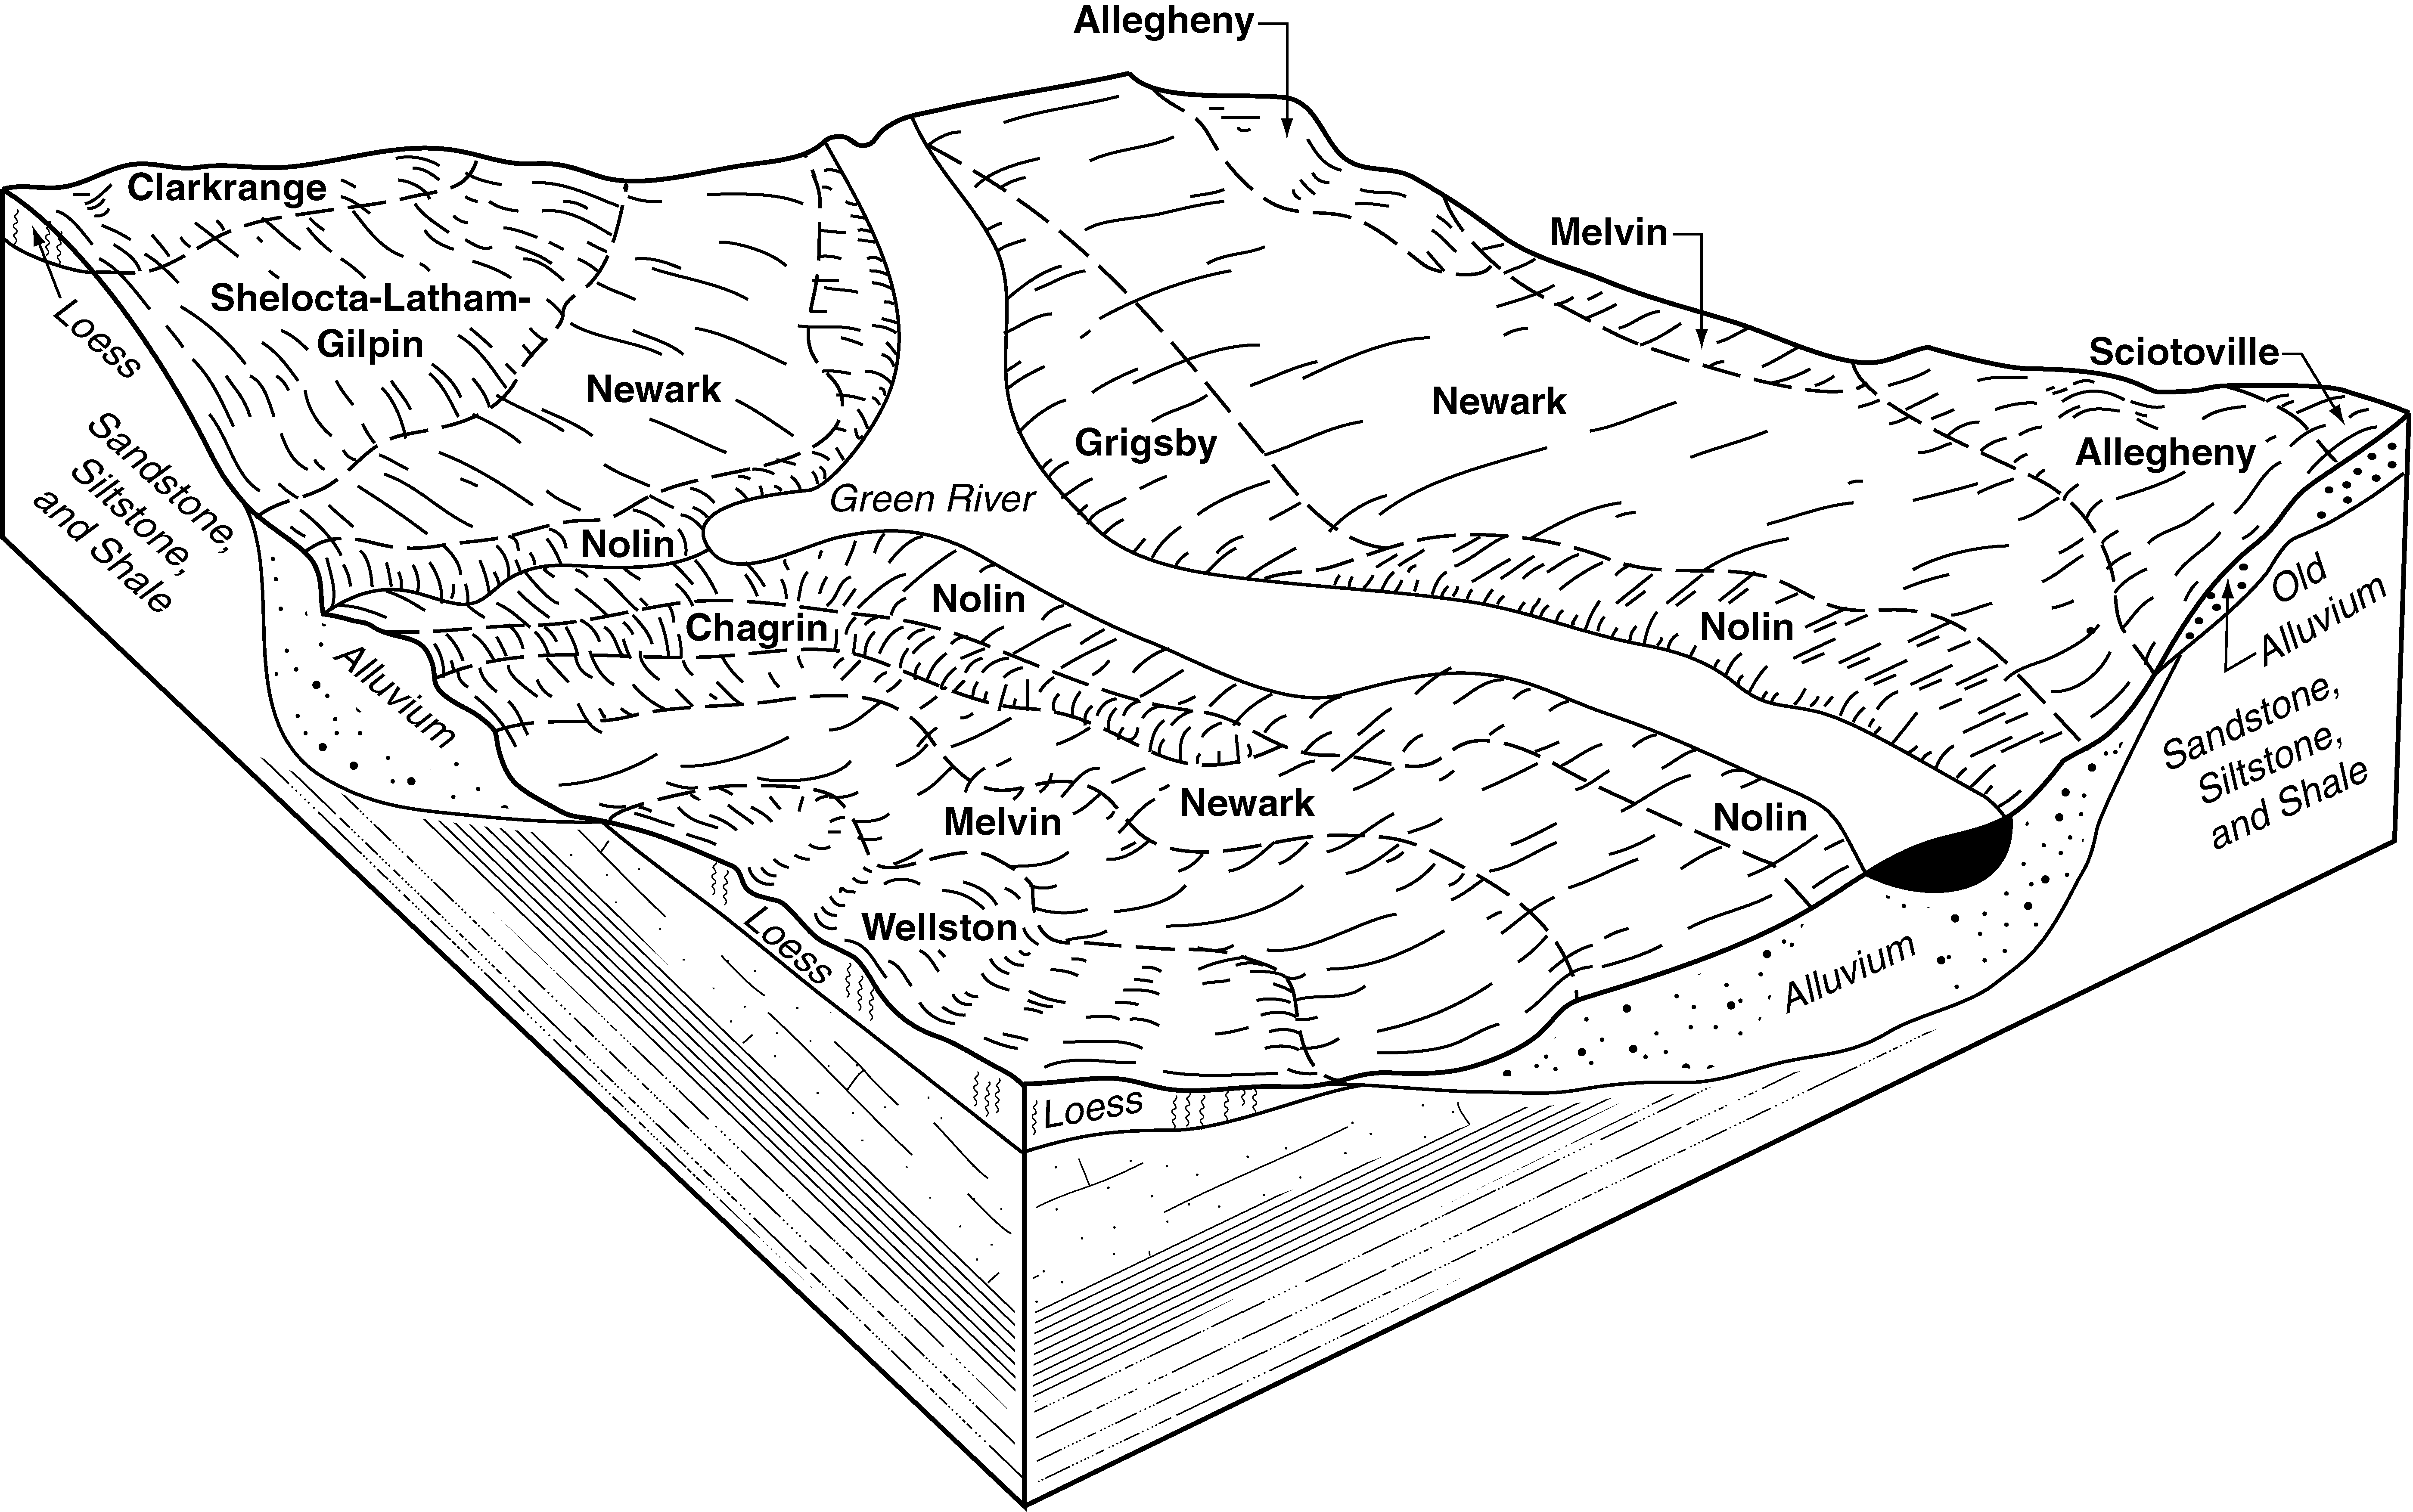
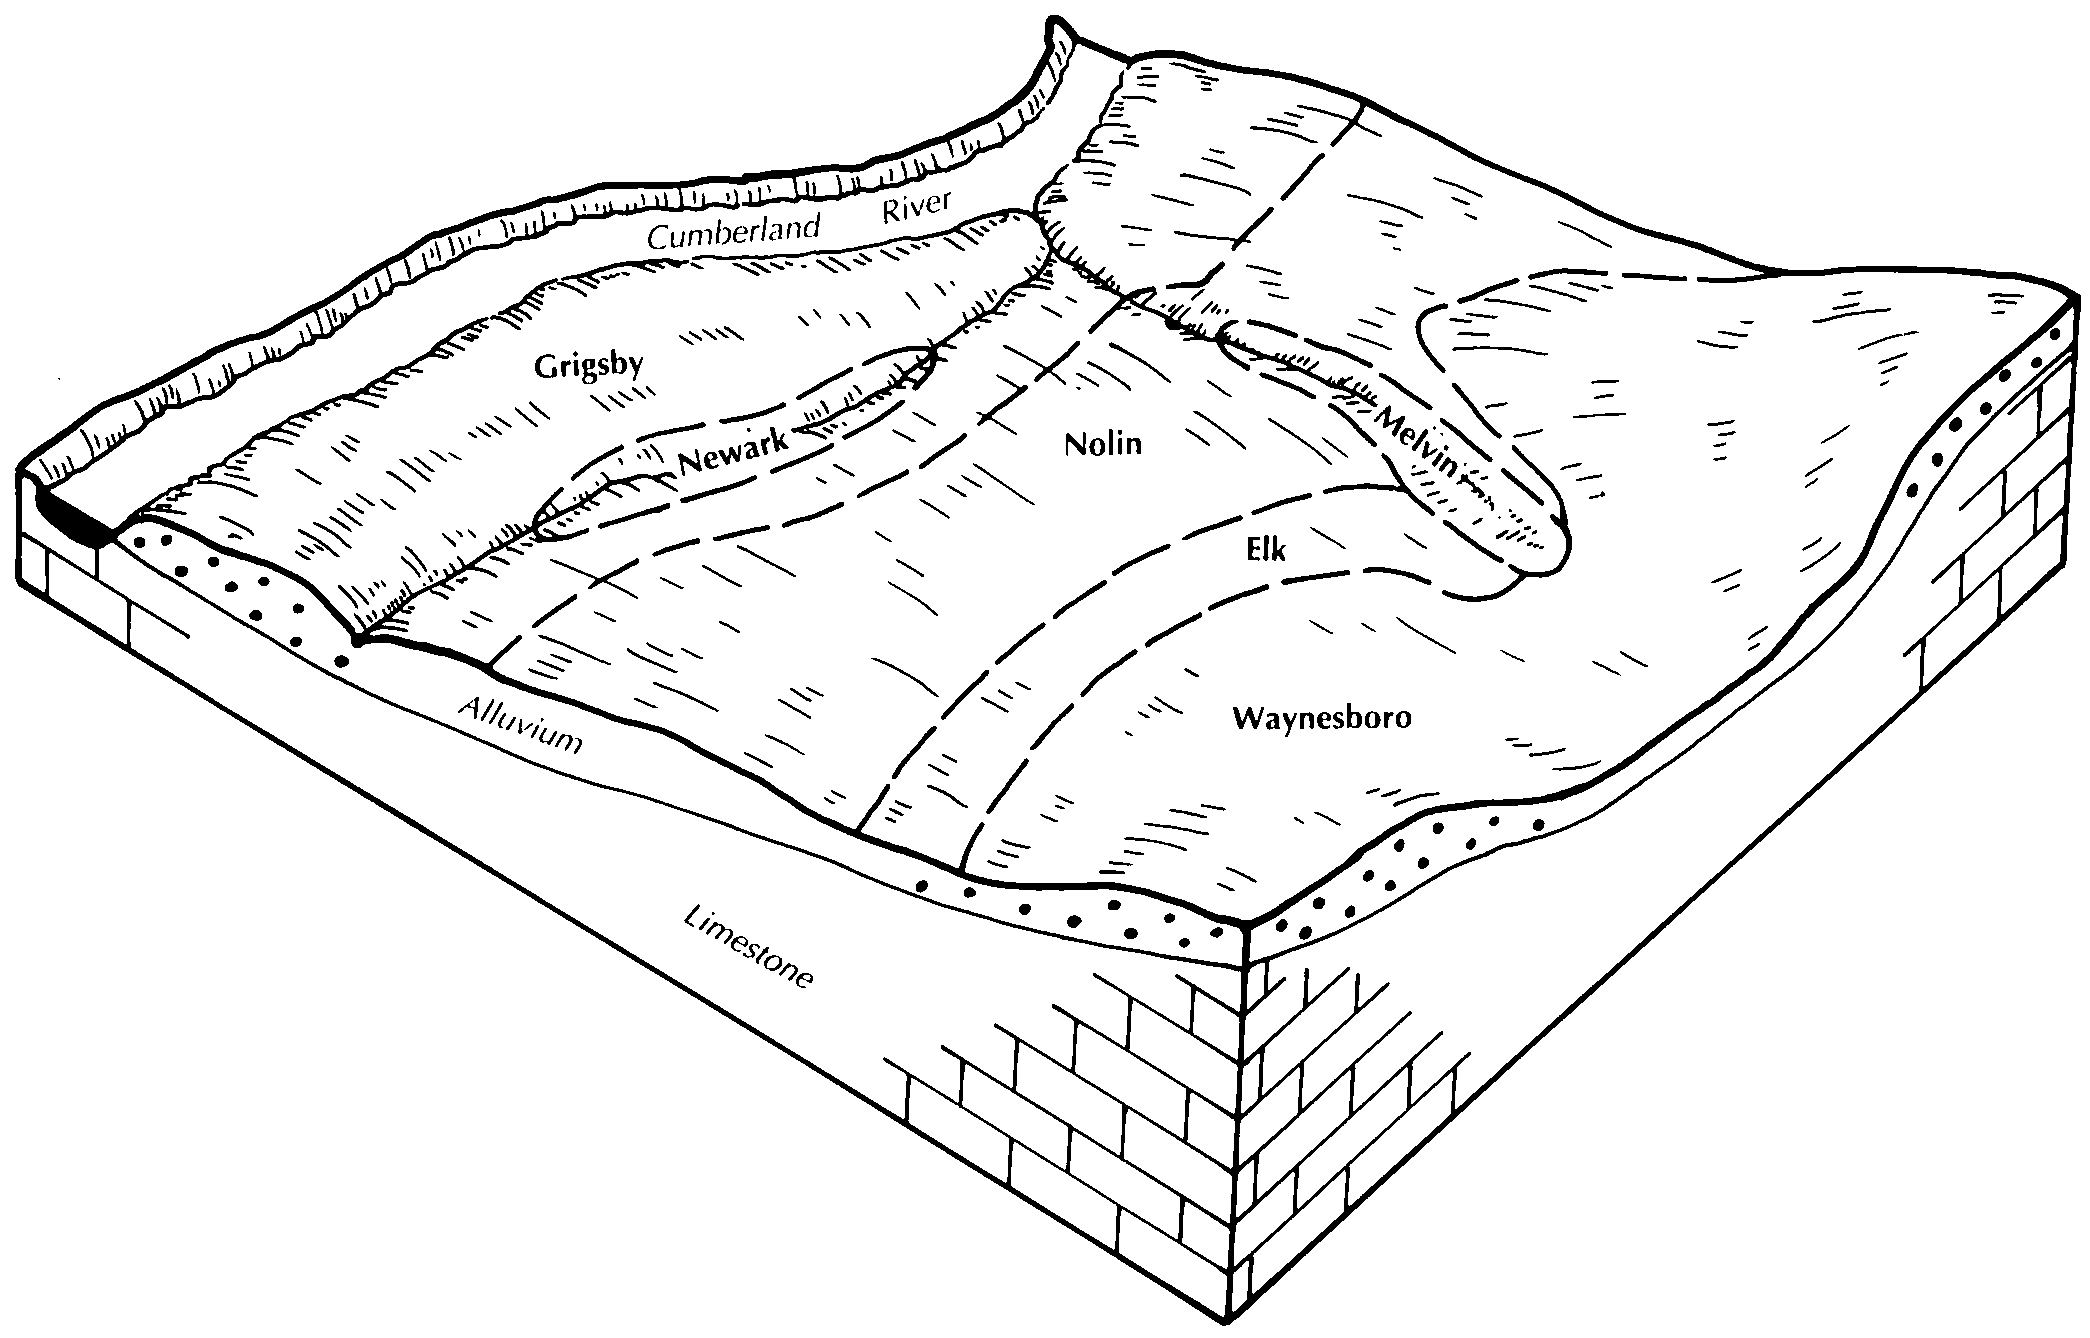
- KY-2010-09-10-02 | Butler and Edmonson Counties -
Relationship of soils to topography and underlying material in the Newark-Nolin-Melvin association (Soil Survey of Butler and Edmonson Counties, Kentucky).
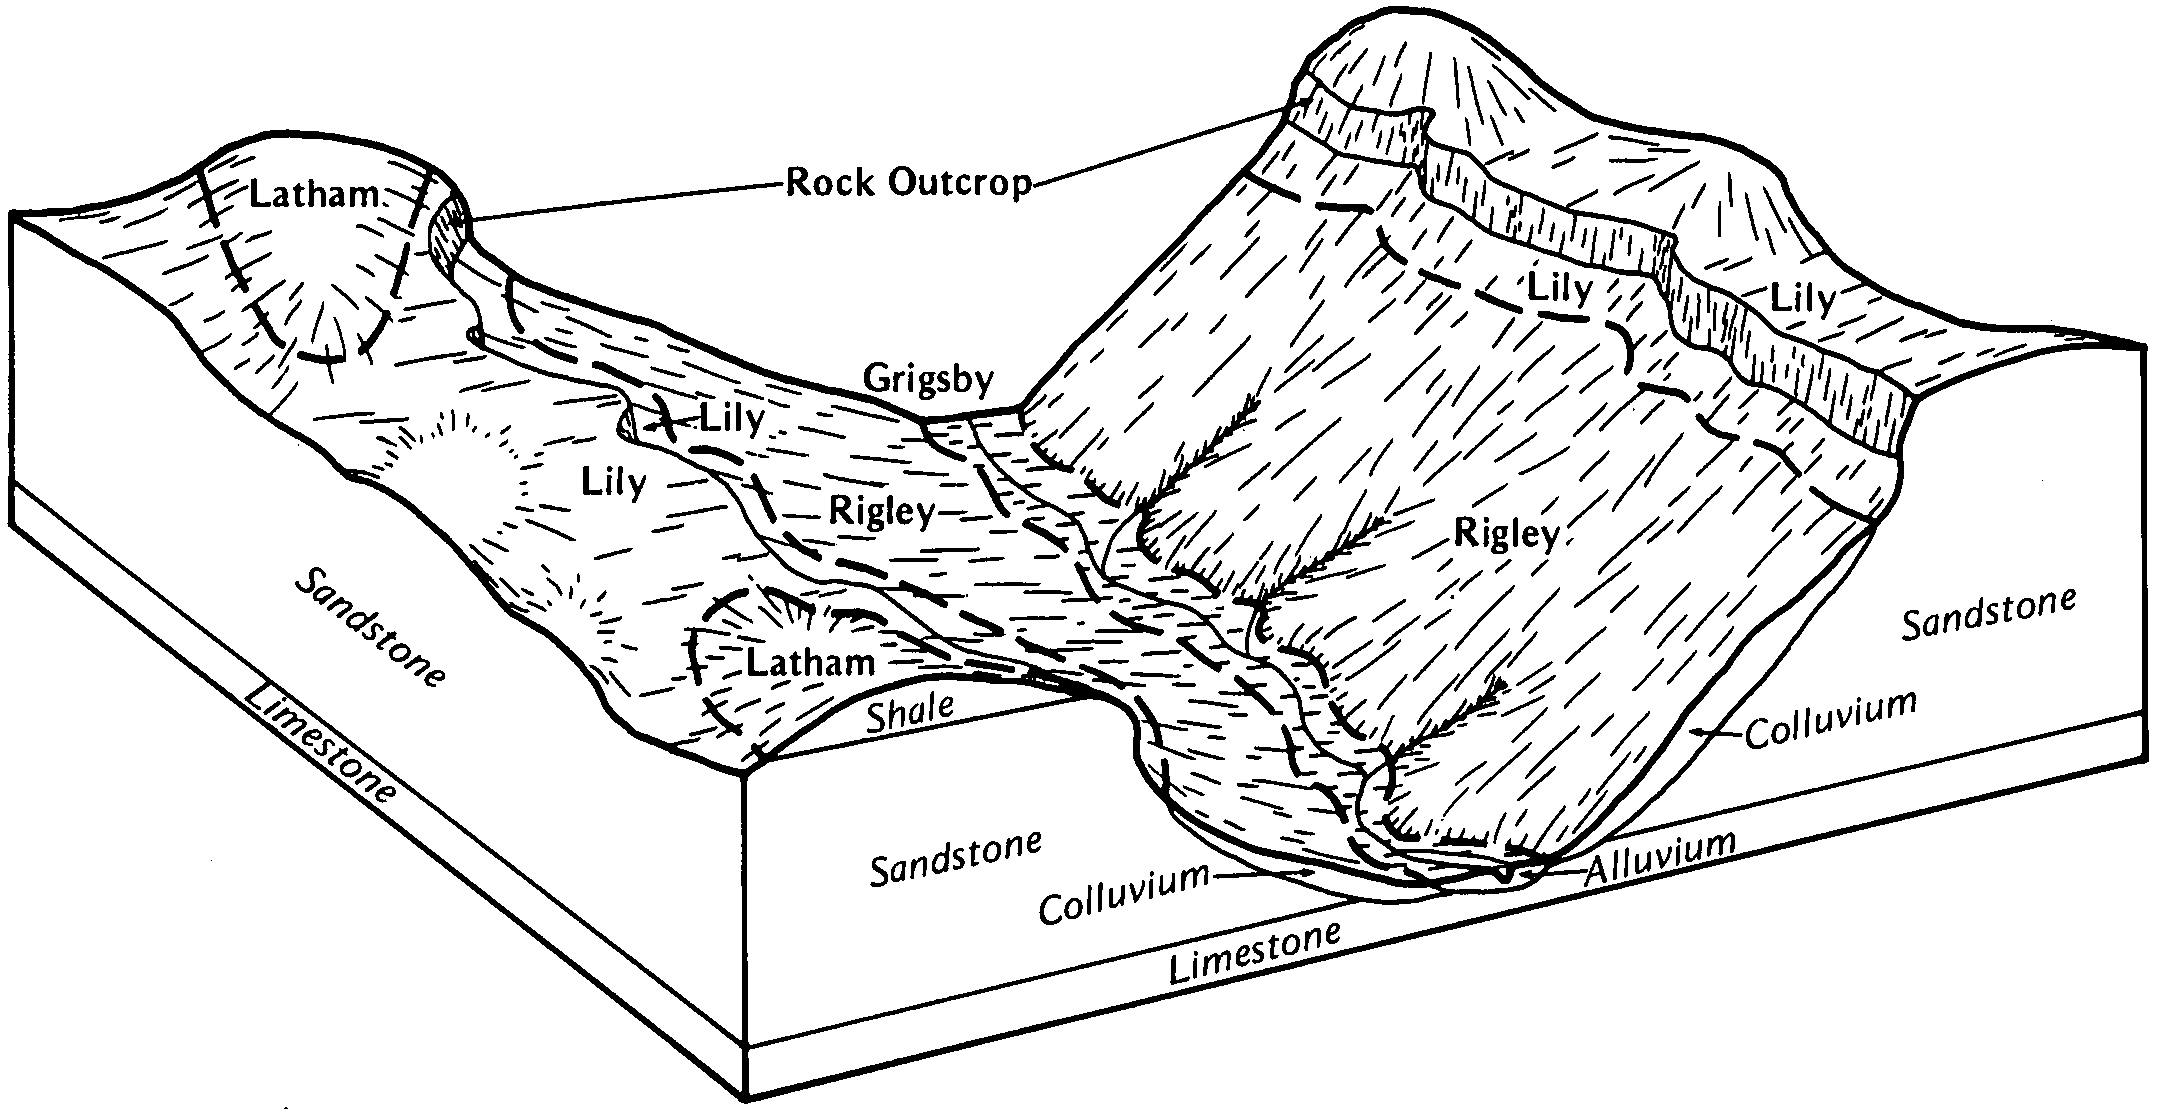
- KY-2012-01-27-25 | Carter County - April 1983
Pattern of soils, topography, and underlying material in the Rigley-Lily-Rock outcrop map unit (Soil Survey of Carter County, Kentucky; April 1983).
- KY-2012-01-27-46 | Clinton County - May 1994
Pattern of soils and parent material in the Waynesboro-Nolin-Grigsby general soil map unit (Soil Survey of Clinton County, Kentucky; May 1994).
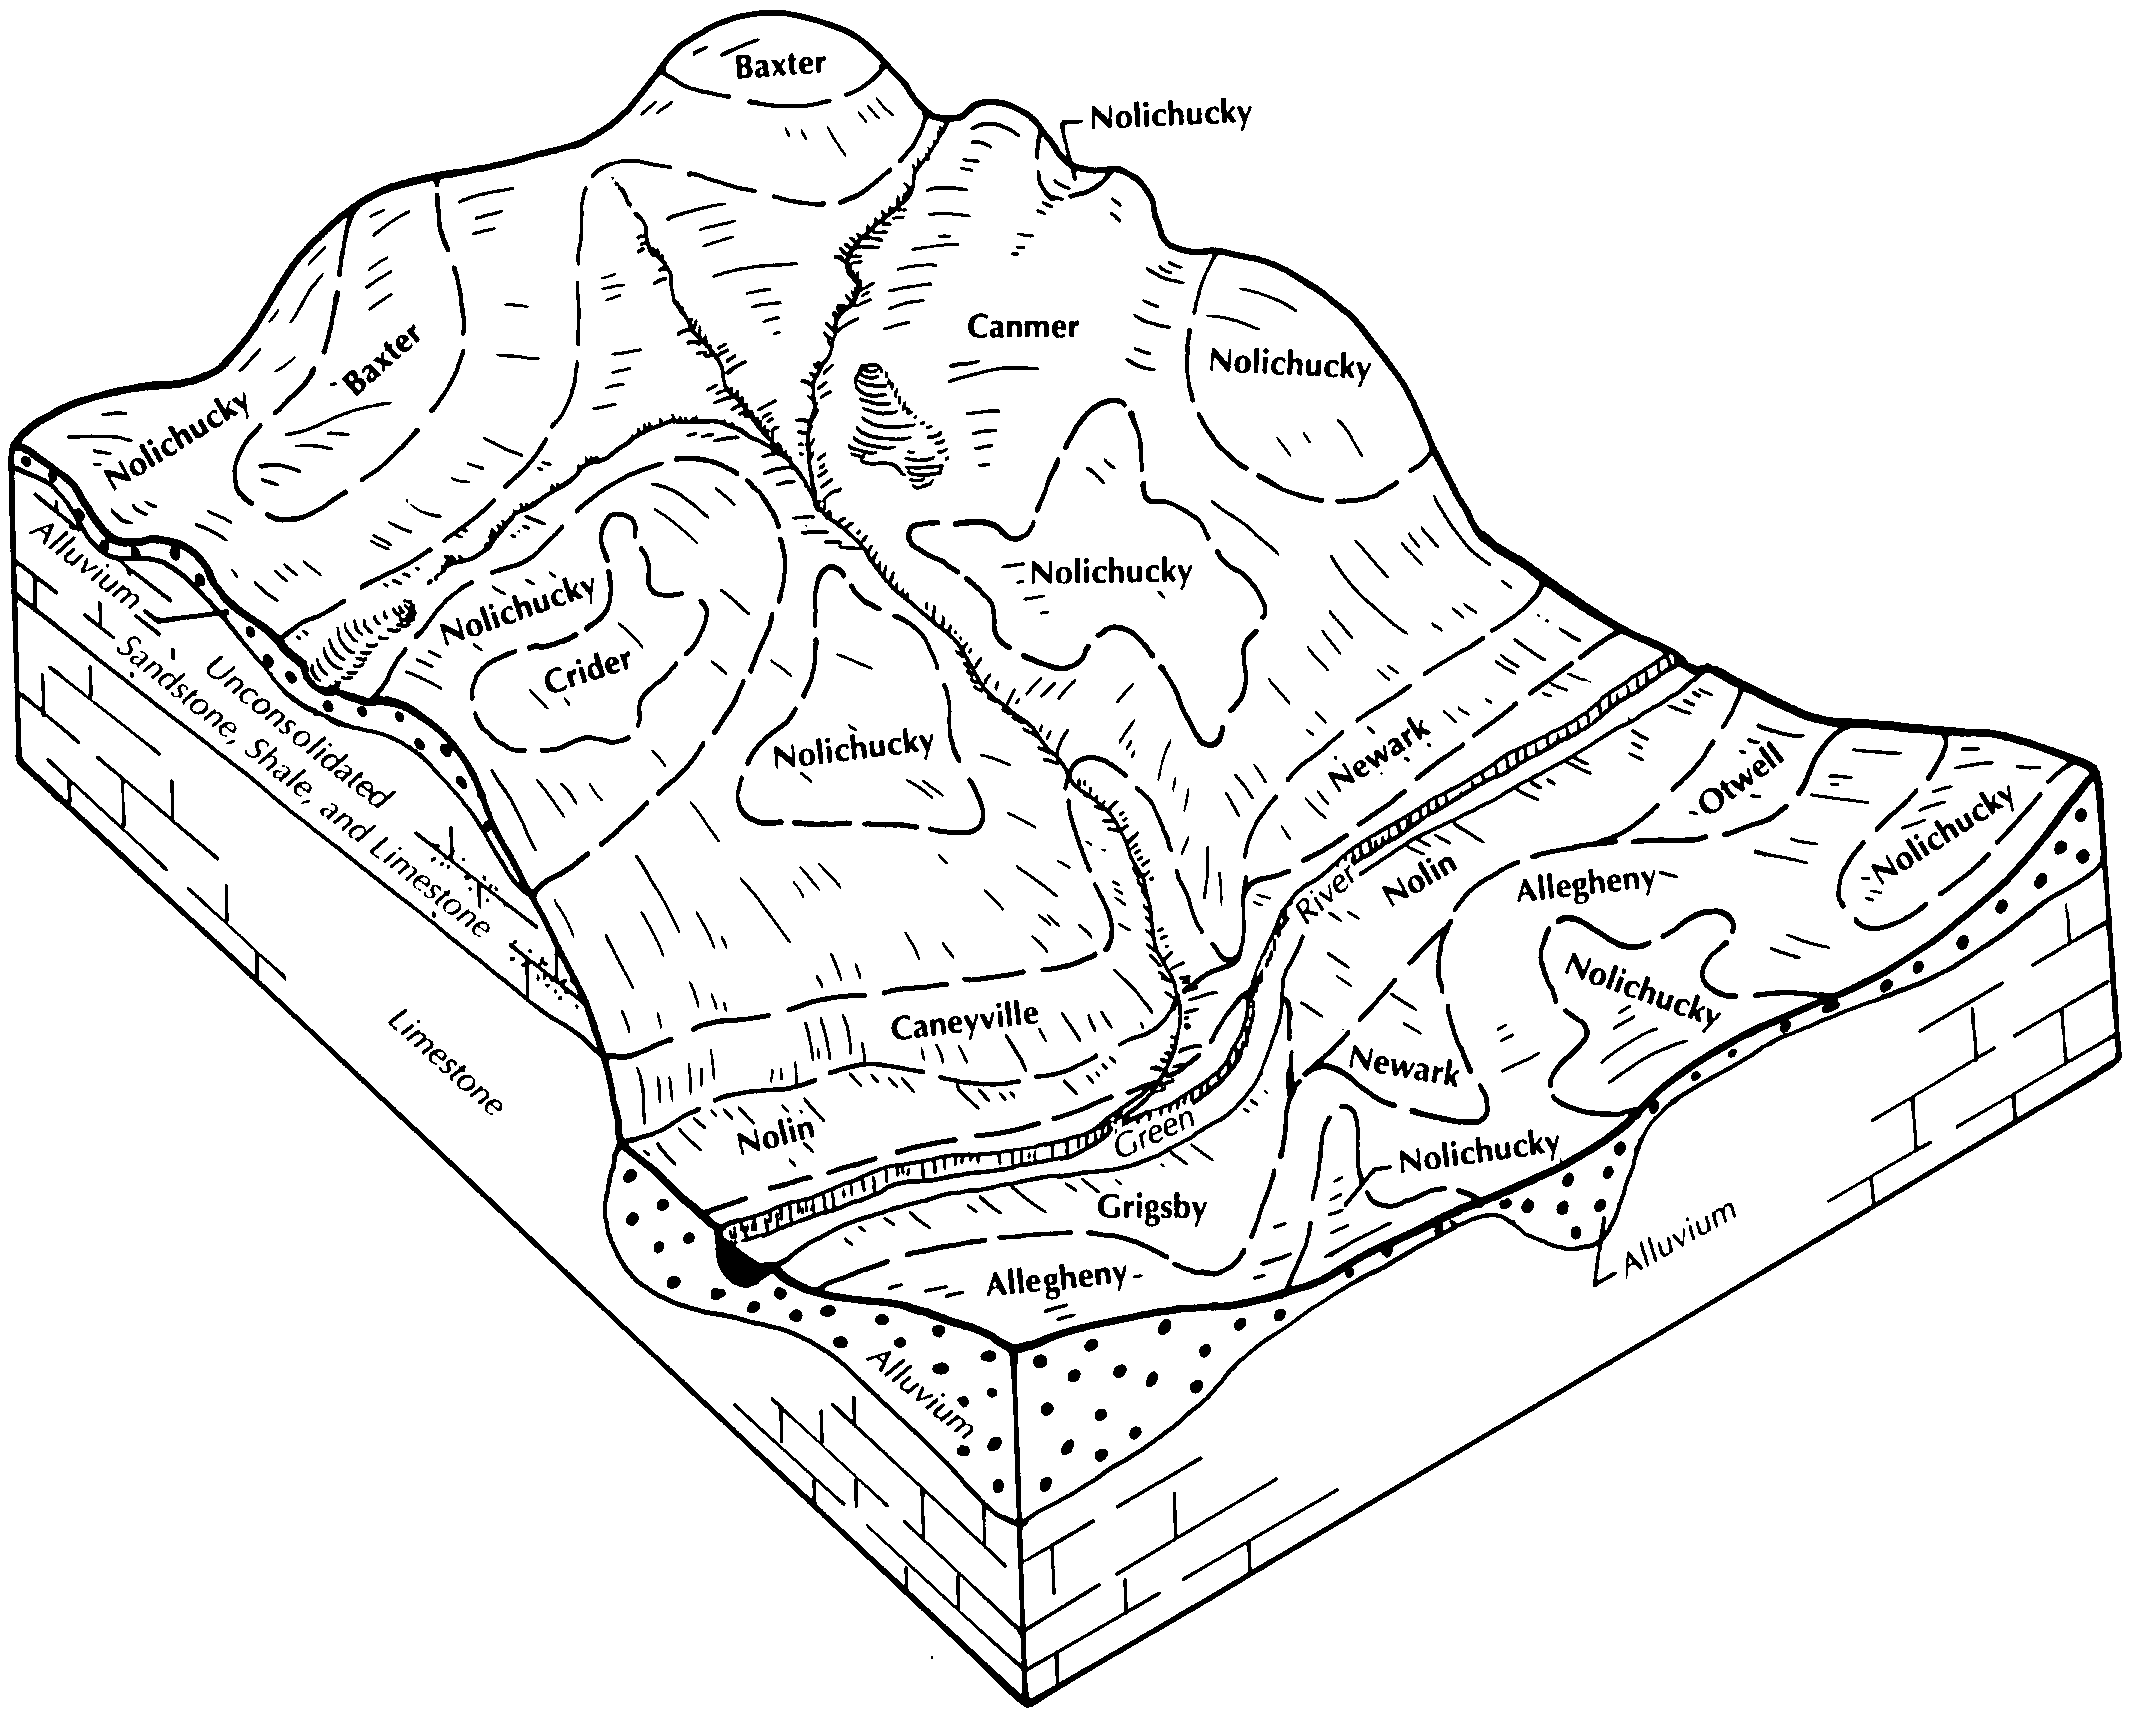
- KY-2012-01-30-20 | Hart County - May 1993
Typical pattern of soils and underlying material in the Nolichucky-Canmer general soil map unit (Soil Survey of Hart County, Kentucky; May 1993).
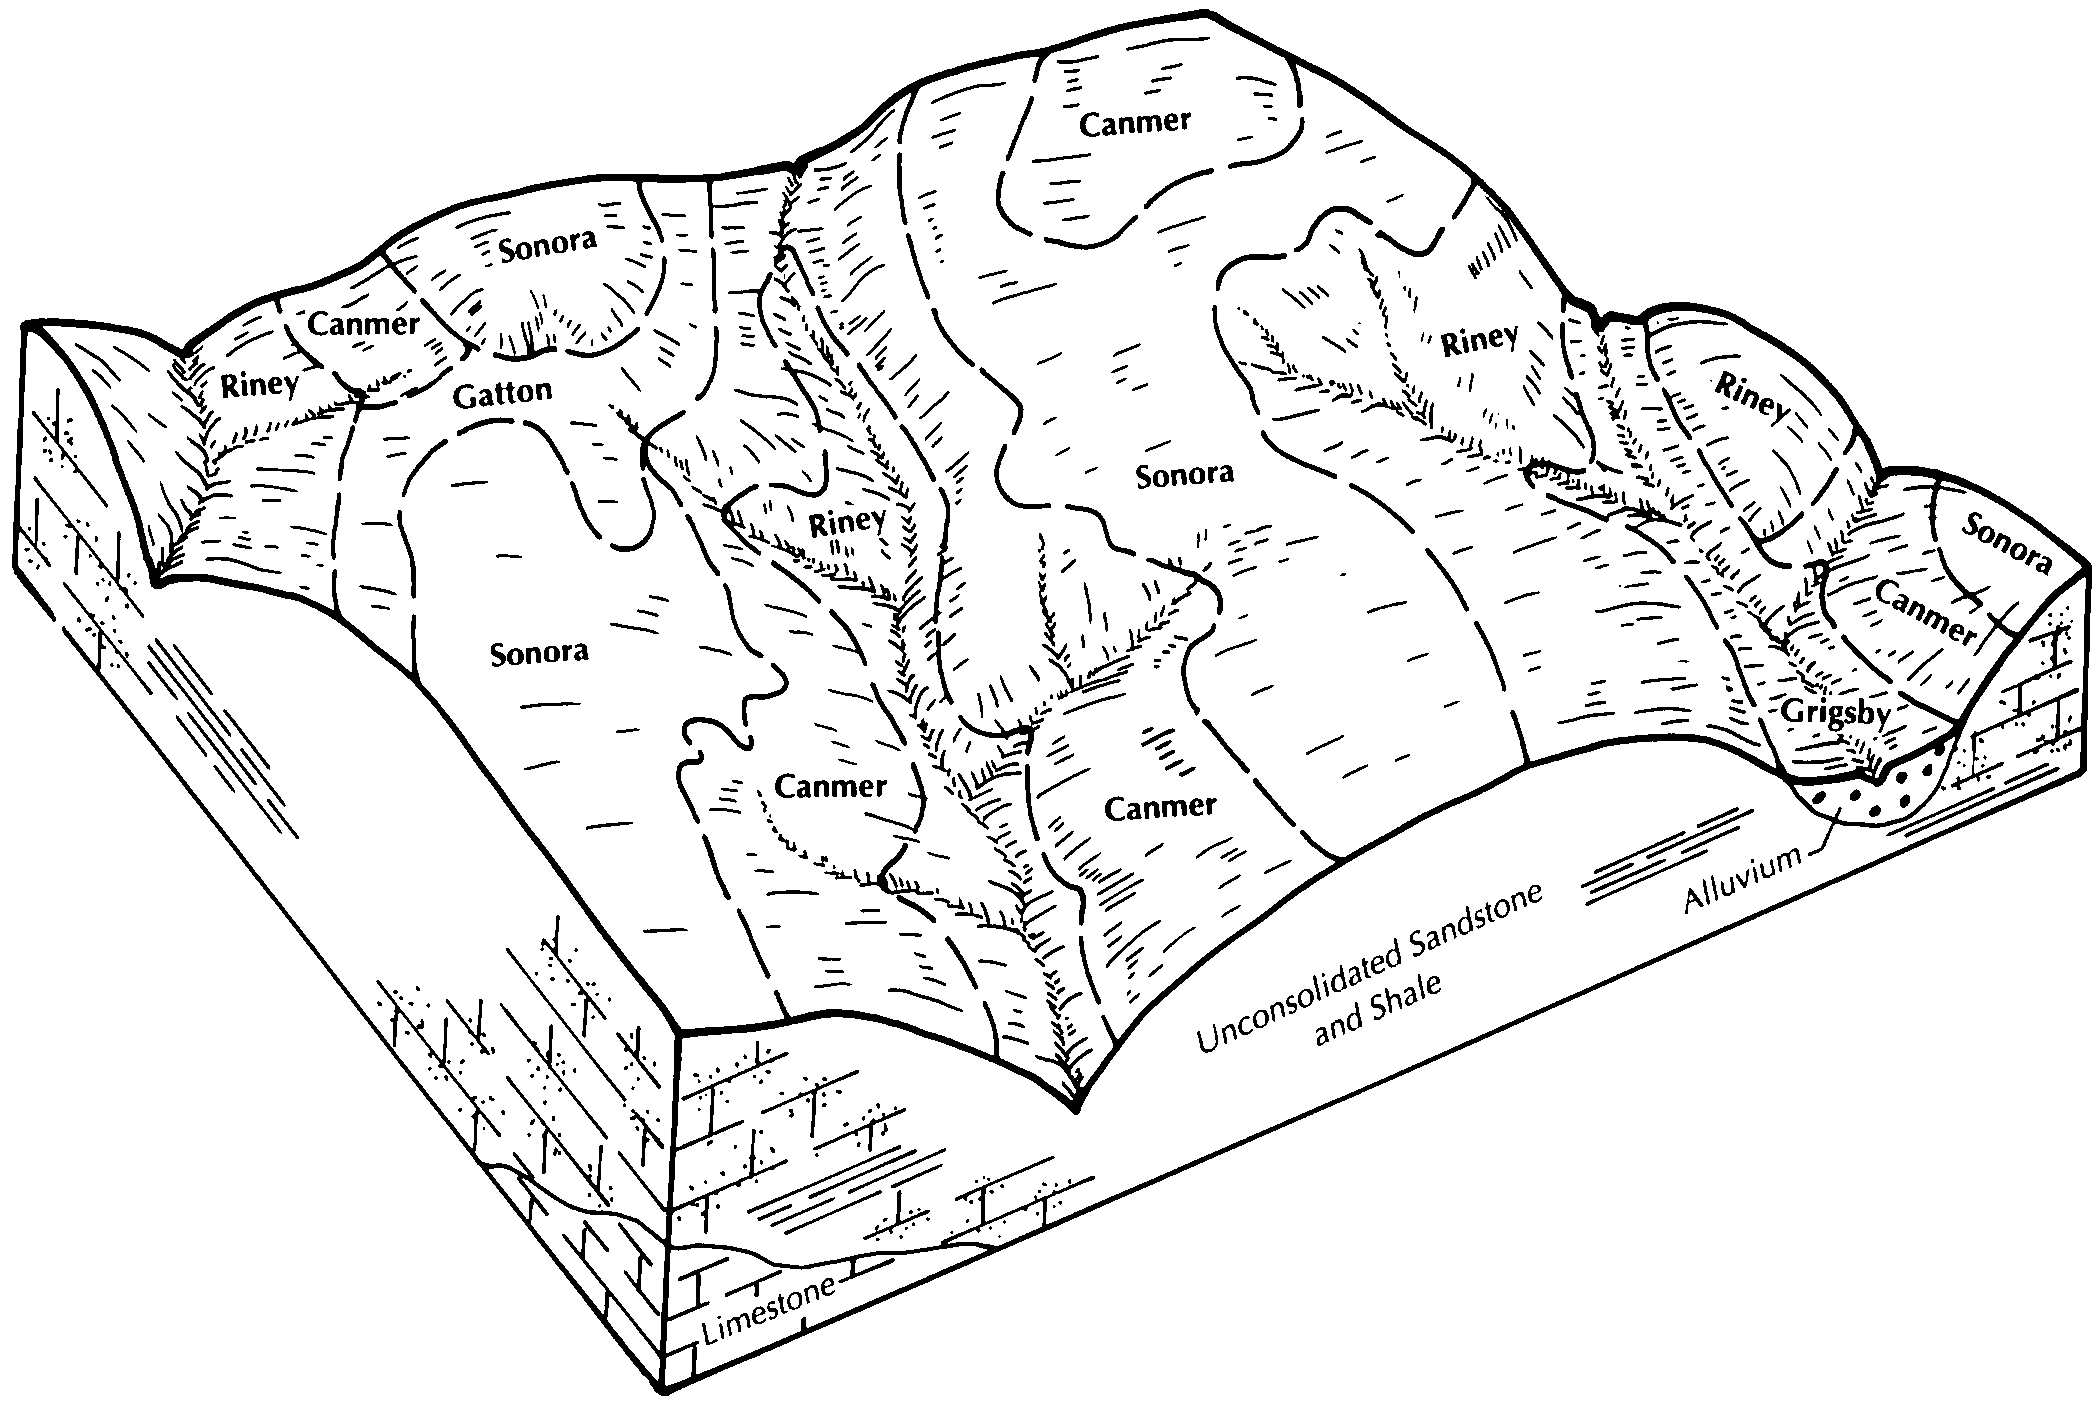
- KY-2012-01-30-22 | Hart County - May 1993
Typical pattern of soils and underlying material in the Riney-Sonora-Canmer general soil map unit (Soil Survey of Hart County, Kentucky; May 1993).
- KY-2012-01-31-14 | Jackson and Owsley Counties - April 1989
Typical pattern of soils and parent material in the Shelocta-Bledsoe-Gilpin map unit (Soil Survey of Jackson and Owsley Counties, Kentucky; April 1989).
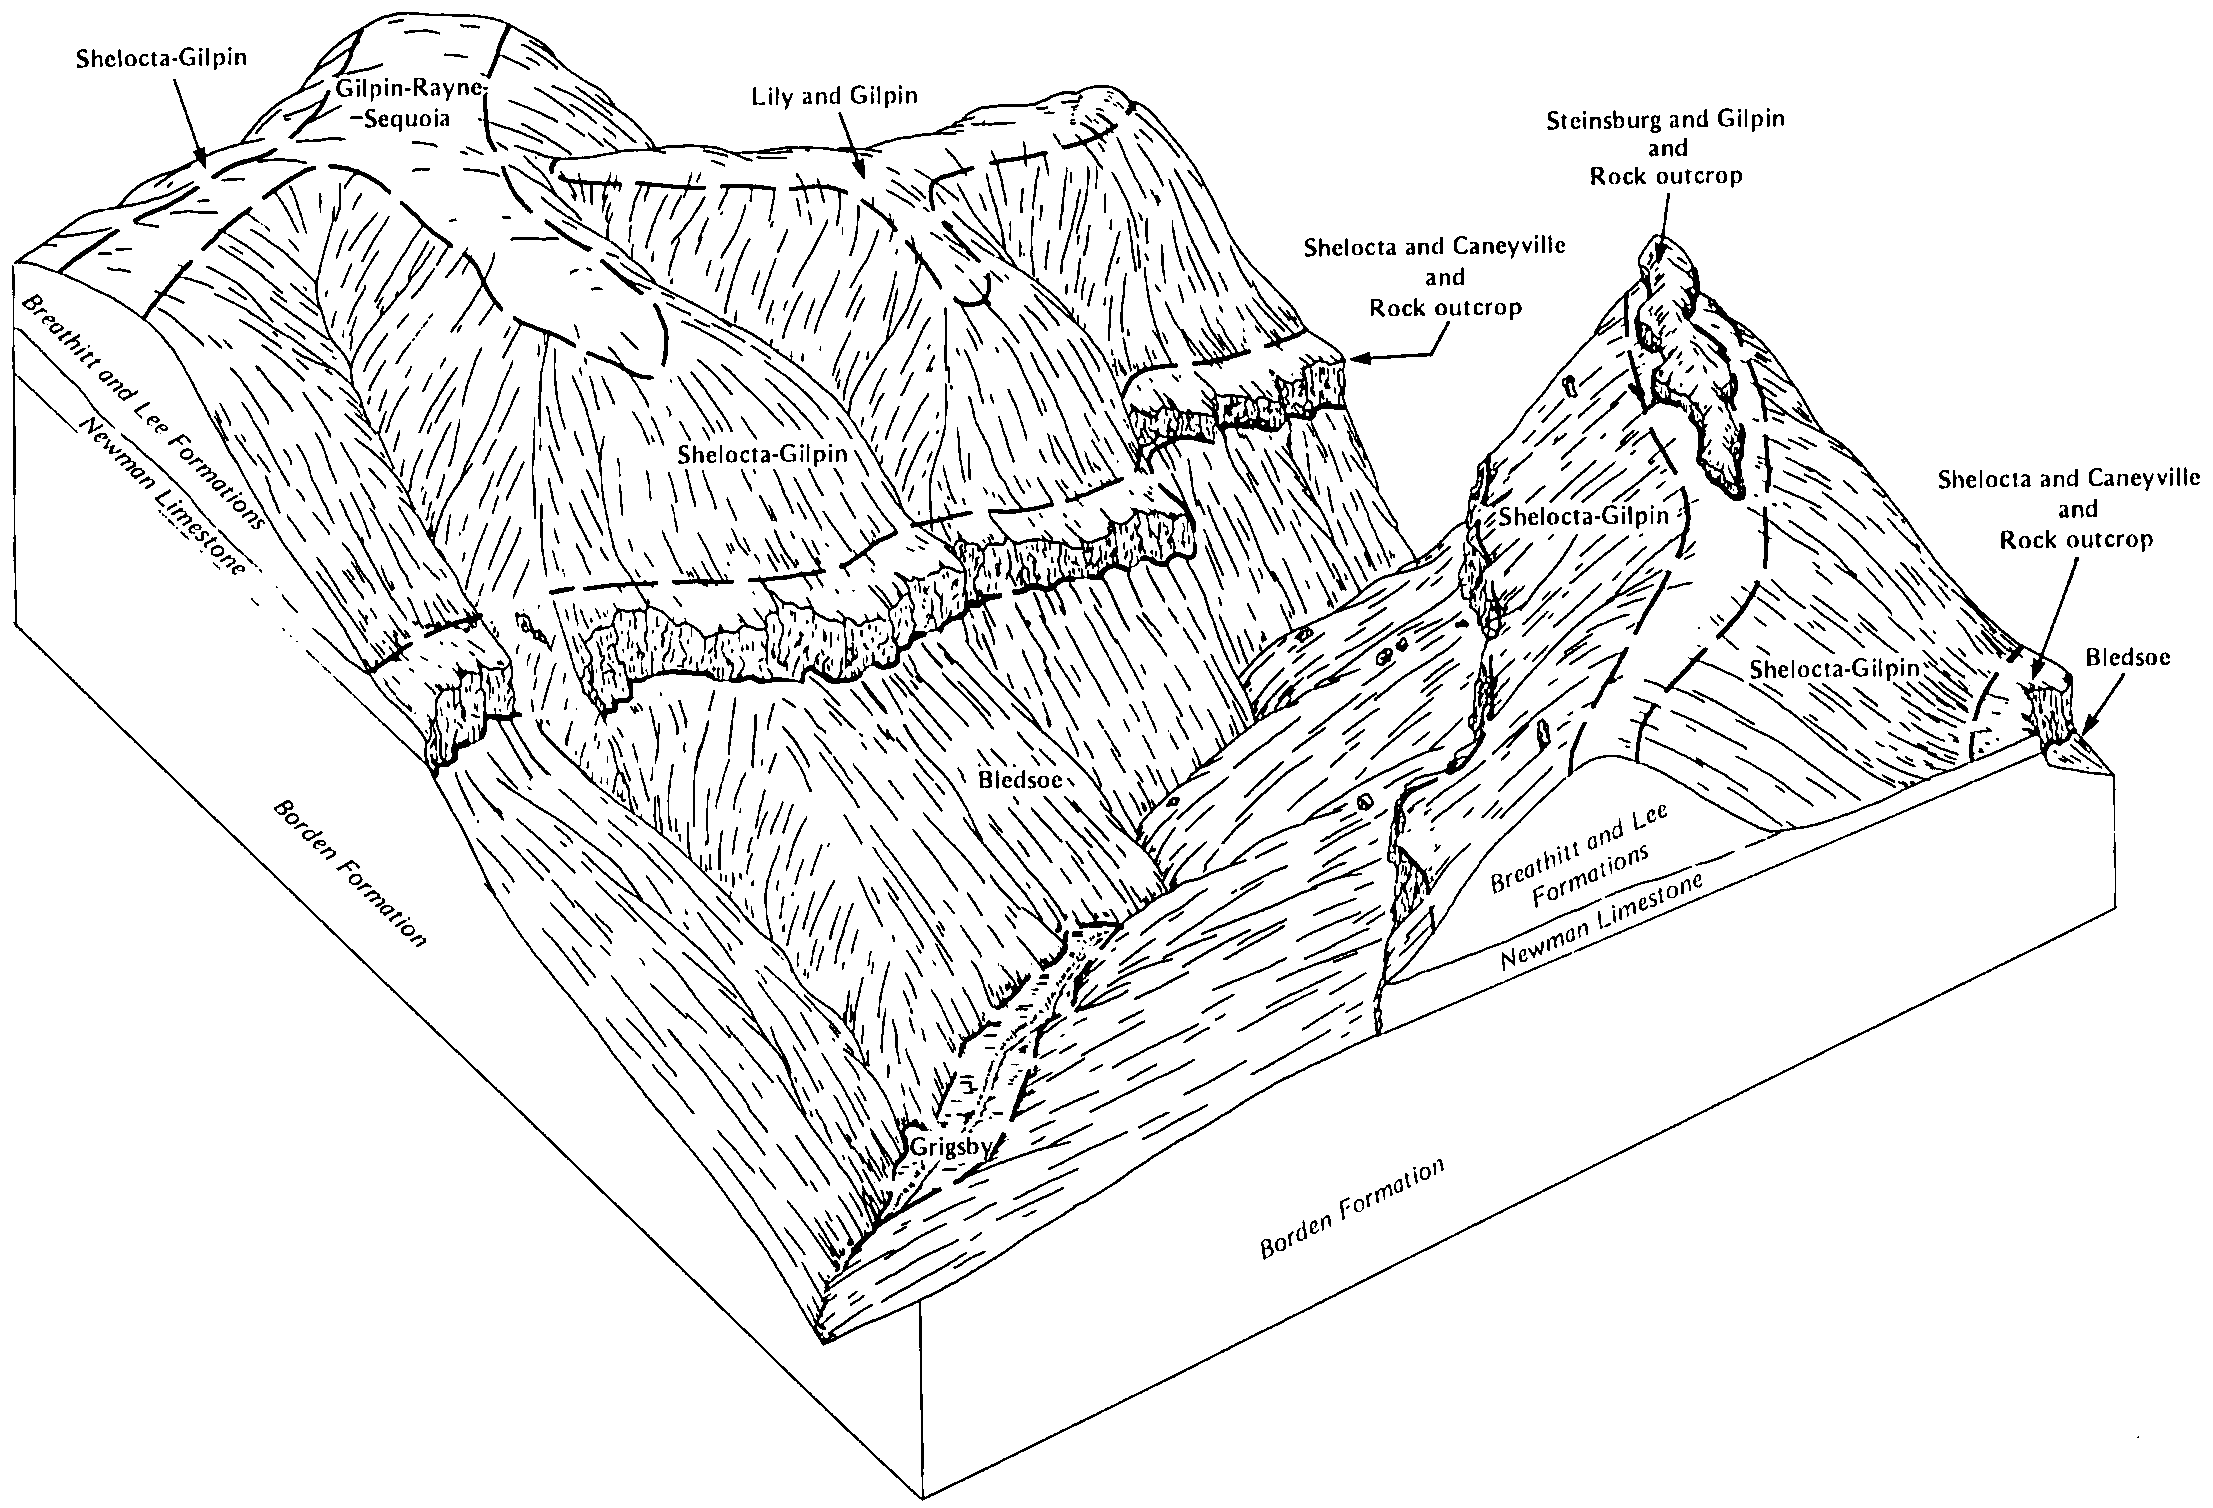
- KY-2012-02-01-38 | Pike County - June 1990
Along the major tributaries in Pike County, the soils on the mountains are in the Marrowbone-Fedscreek-Kimper-Dekalb general soil map unit and those in the valleys are in the Yeager-Grigsby-Potomac-Hayter map unit (Soil Survey of Pike County, Kentucky; June 1990).
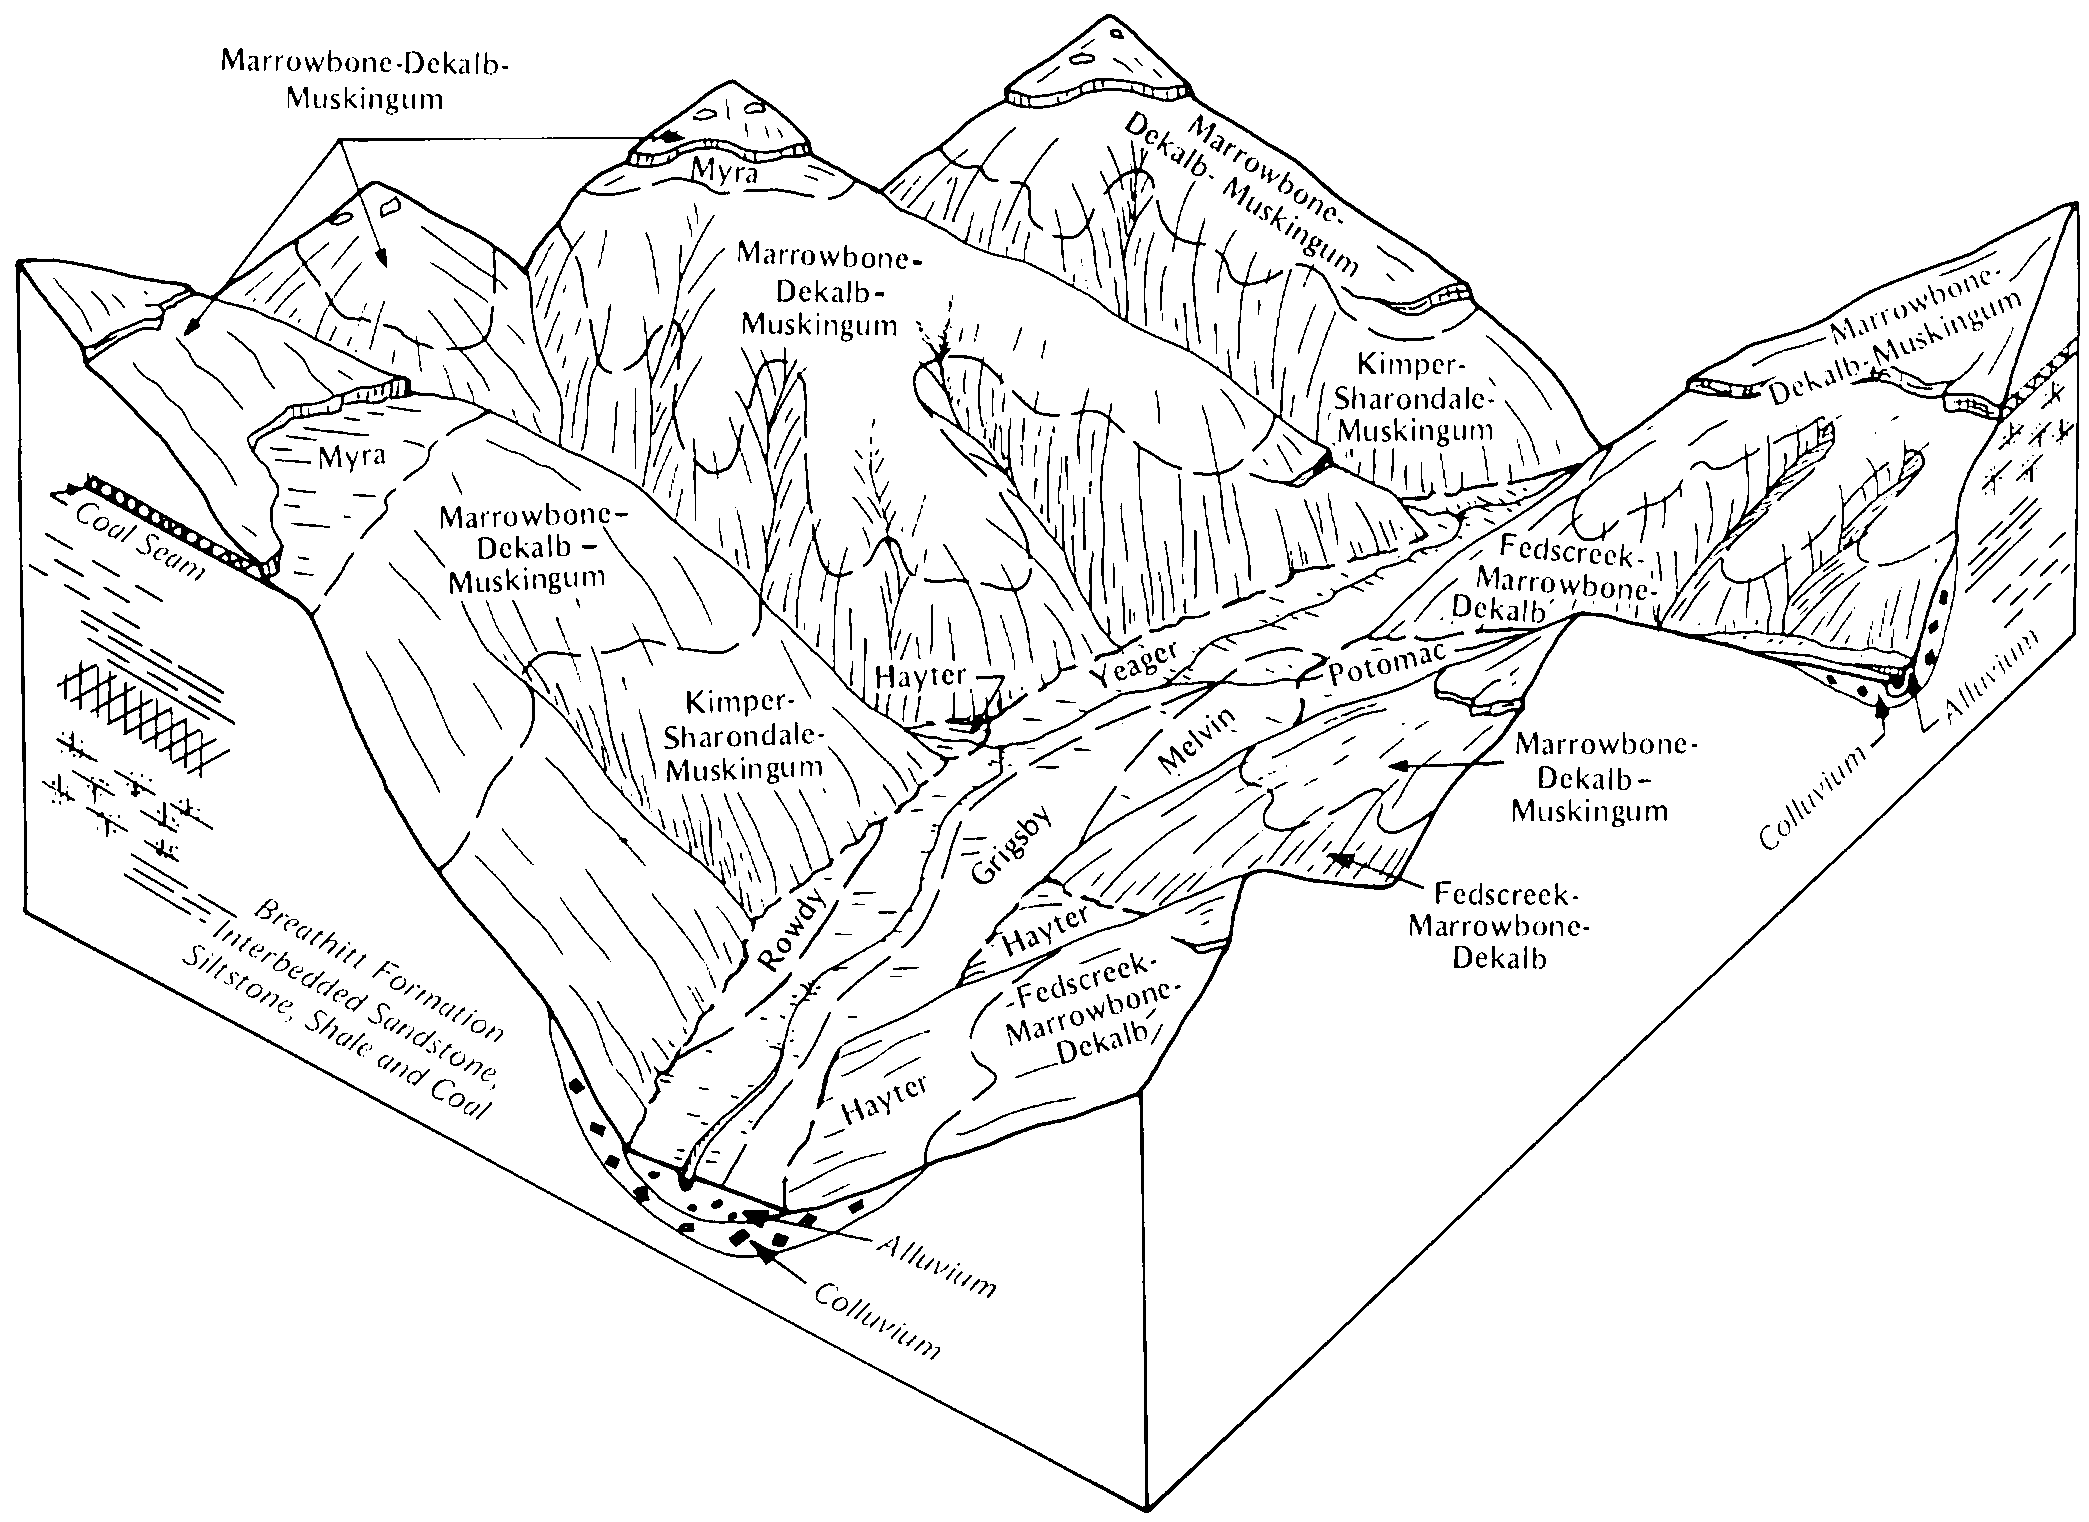
- KY-2012-02-01-39 | Pike County - June 1990
Along Elkhorn Creek and Pine Mountain, the upper faulted mountains are in the Kimper-Sharondale-Berks-Shelocta general soil map unit, the lower mountains are in the Marrowbone-Fedscreek-Kimper-Dekalb map unit, and the valley is in the Yeager-Grigsby-Potomac-Hayter map unit (Soil Survey of Pike County, Kentucky; June 1990).
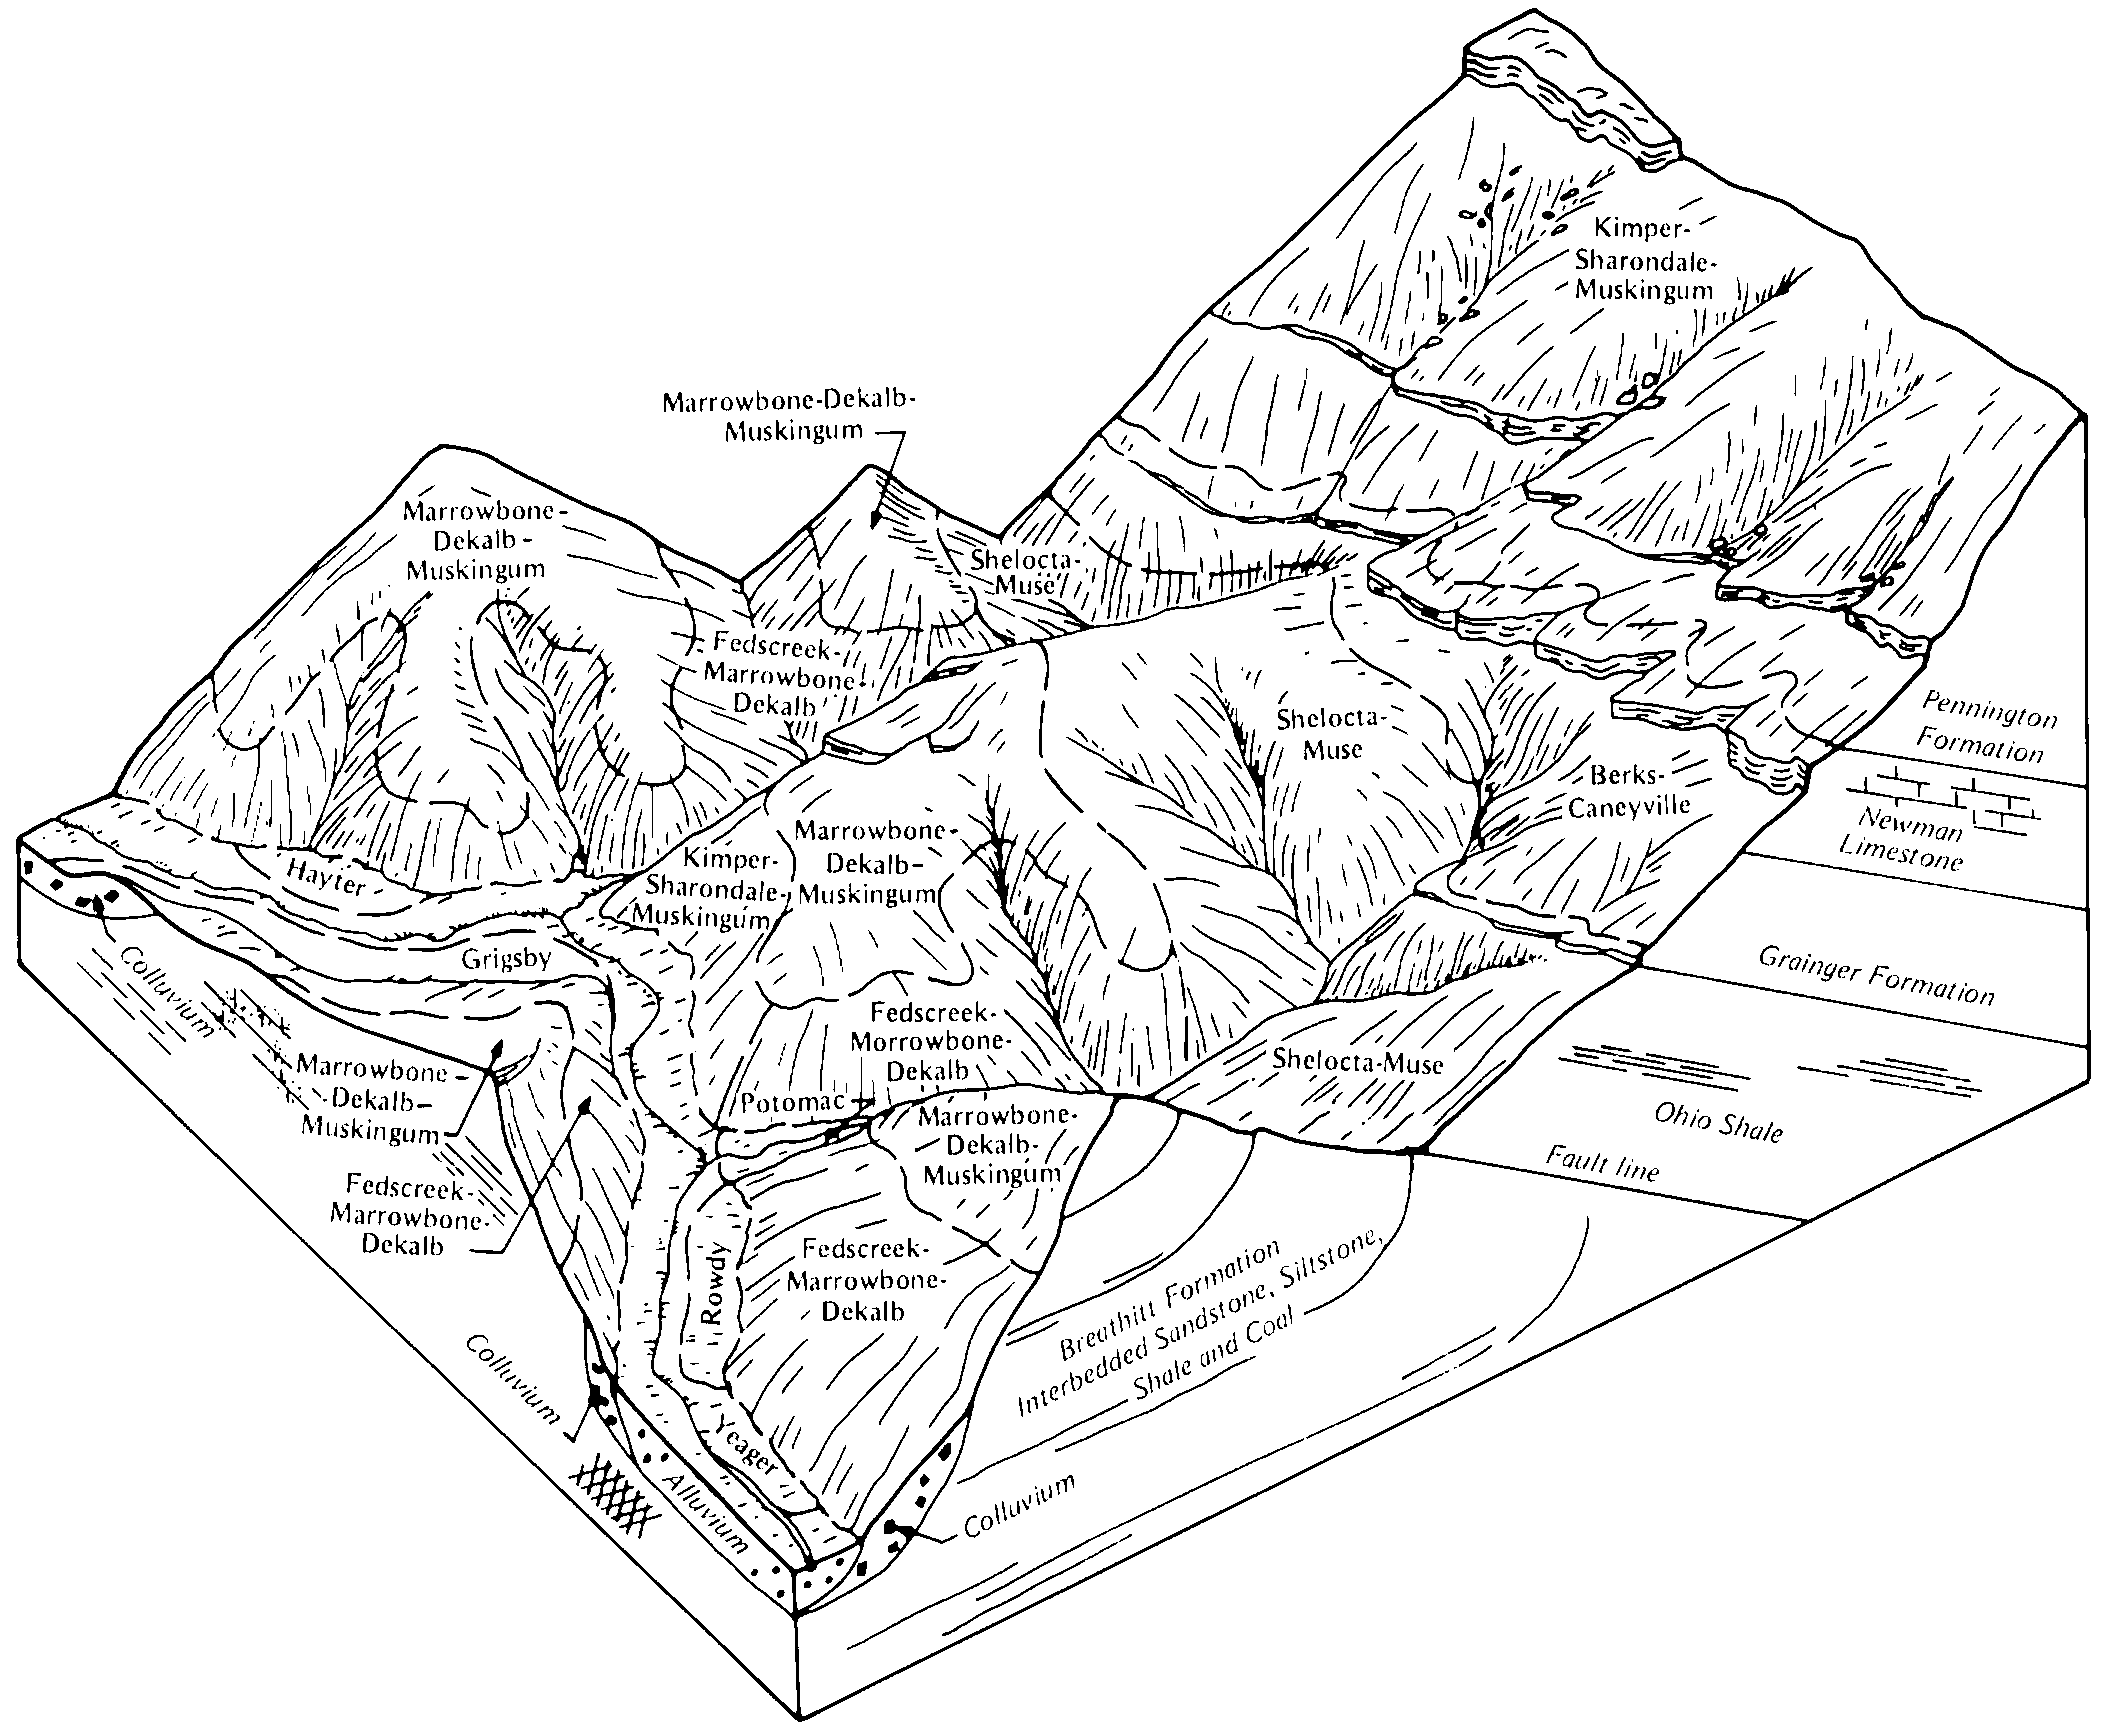
- KY-2012-02-01-40 | Powell and Wolfe Counties - September 1993
Typical pattern of soils and parent material in the Jessietown-Muse-Rohan general soil map unit (Soil Survey of Powell and Wolfe Counties, Kentucky; September 1993).
- KY-2012-02-01-43 | Powell and Wolfe Counties - September 1993
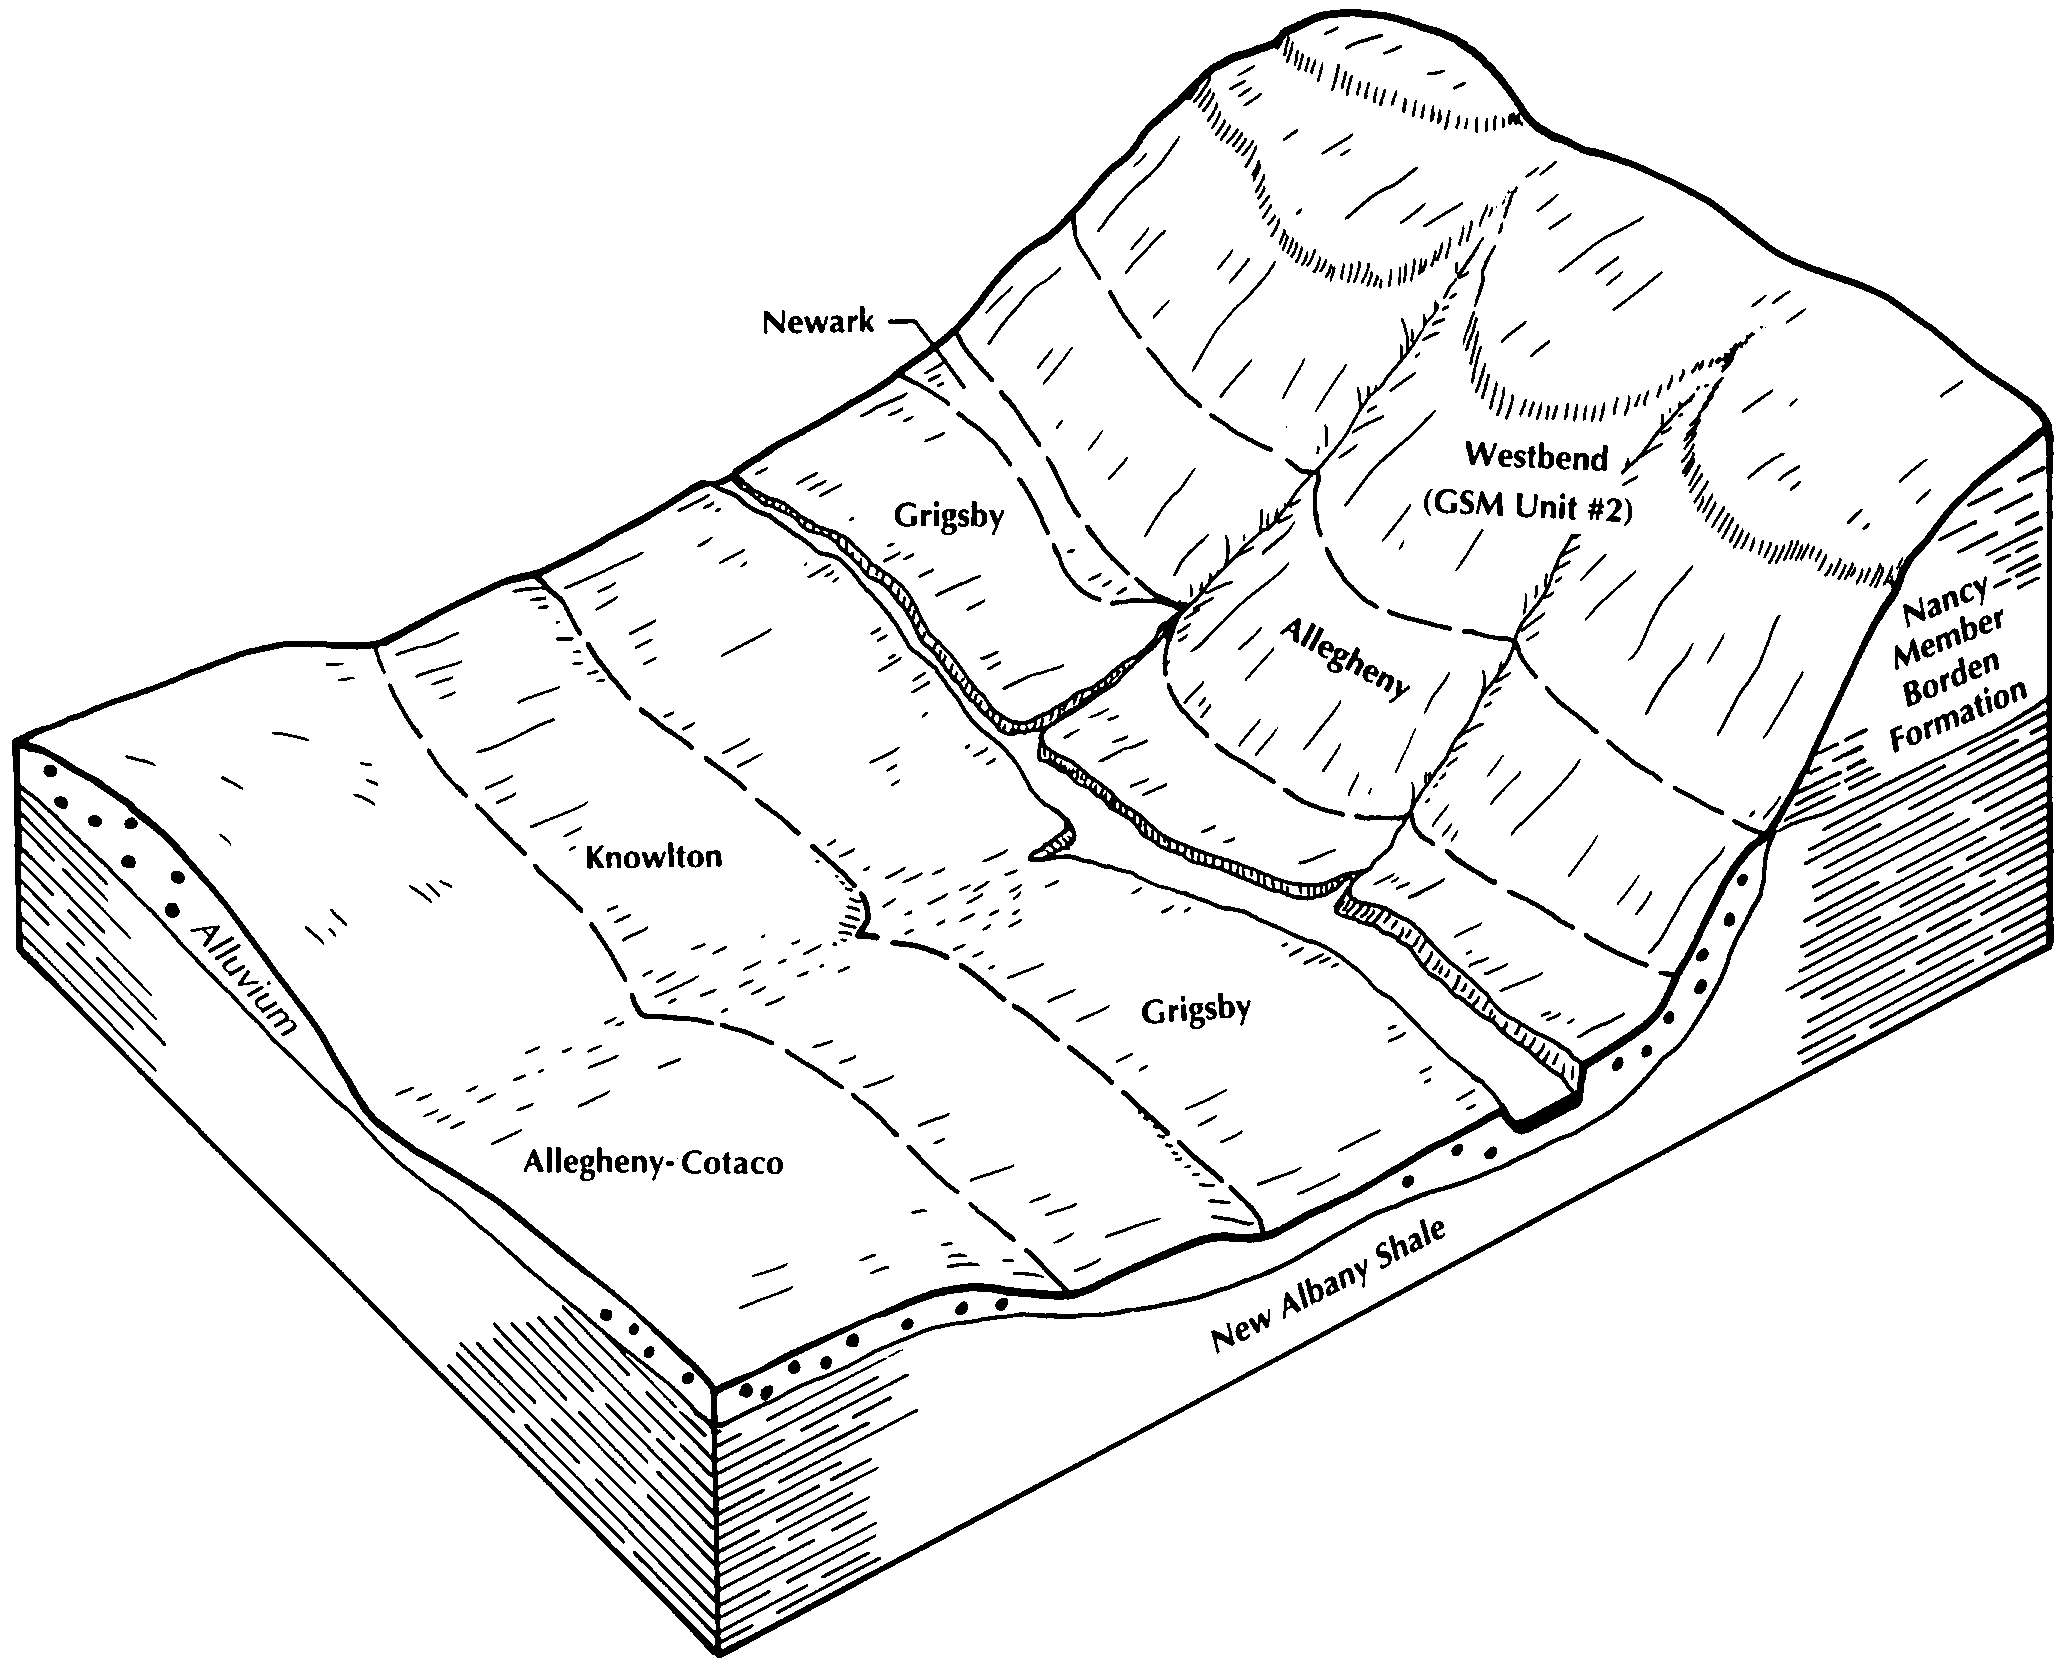
Typical pattern of soils and parent material in the Grigsby-Allegheny-Knowlton general soil map unit (Soil Survey of Powell and Wolfe Counties, Kentucky; September 1993).
- VA-2010-11-05-31 | Russell County - 2007
Diagram of a sequence of landform positions in the Appalachian Plateau area of Russell County. The soils named on the land surface are shown in their natural relationship to each other and in their relationship to landform position (Soil Survey of Russell County, Virginia; 2007).
- VA-2010-11-05-32 | Russell County - 2007
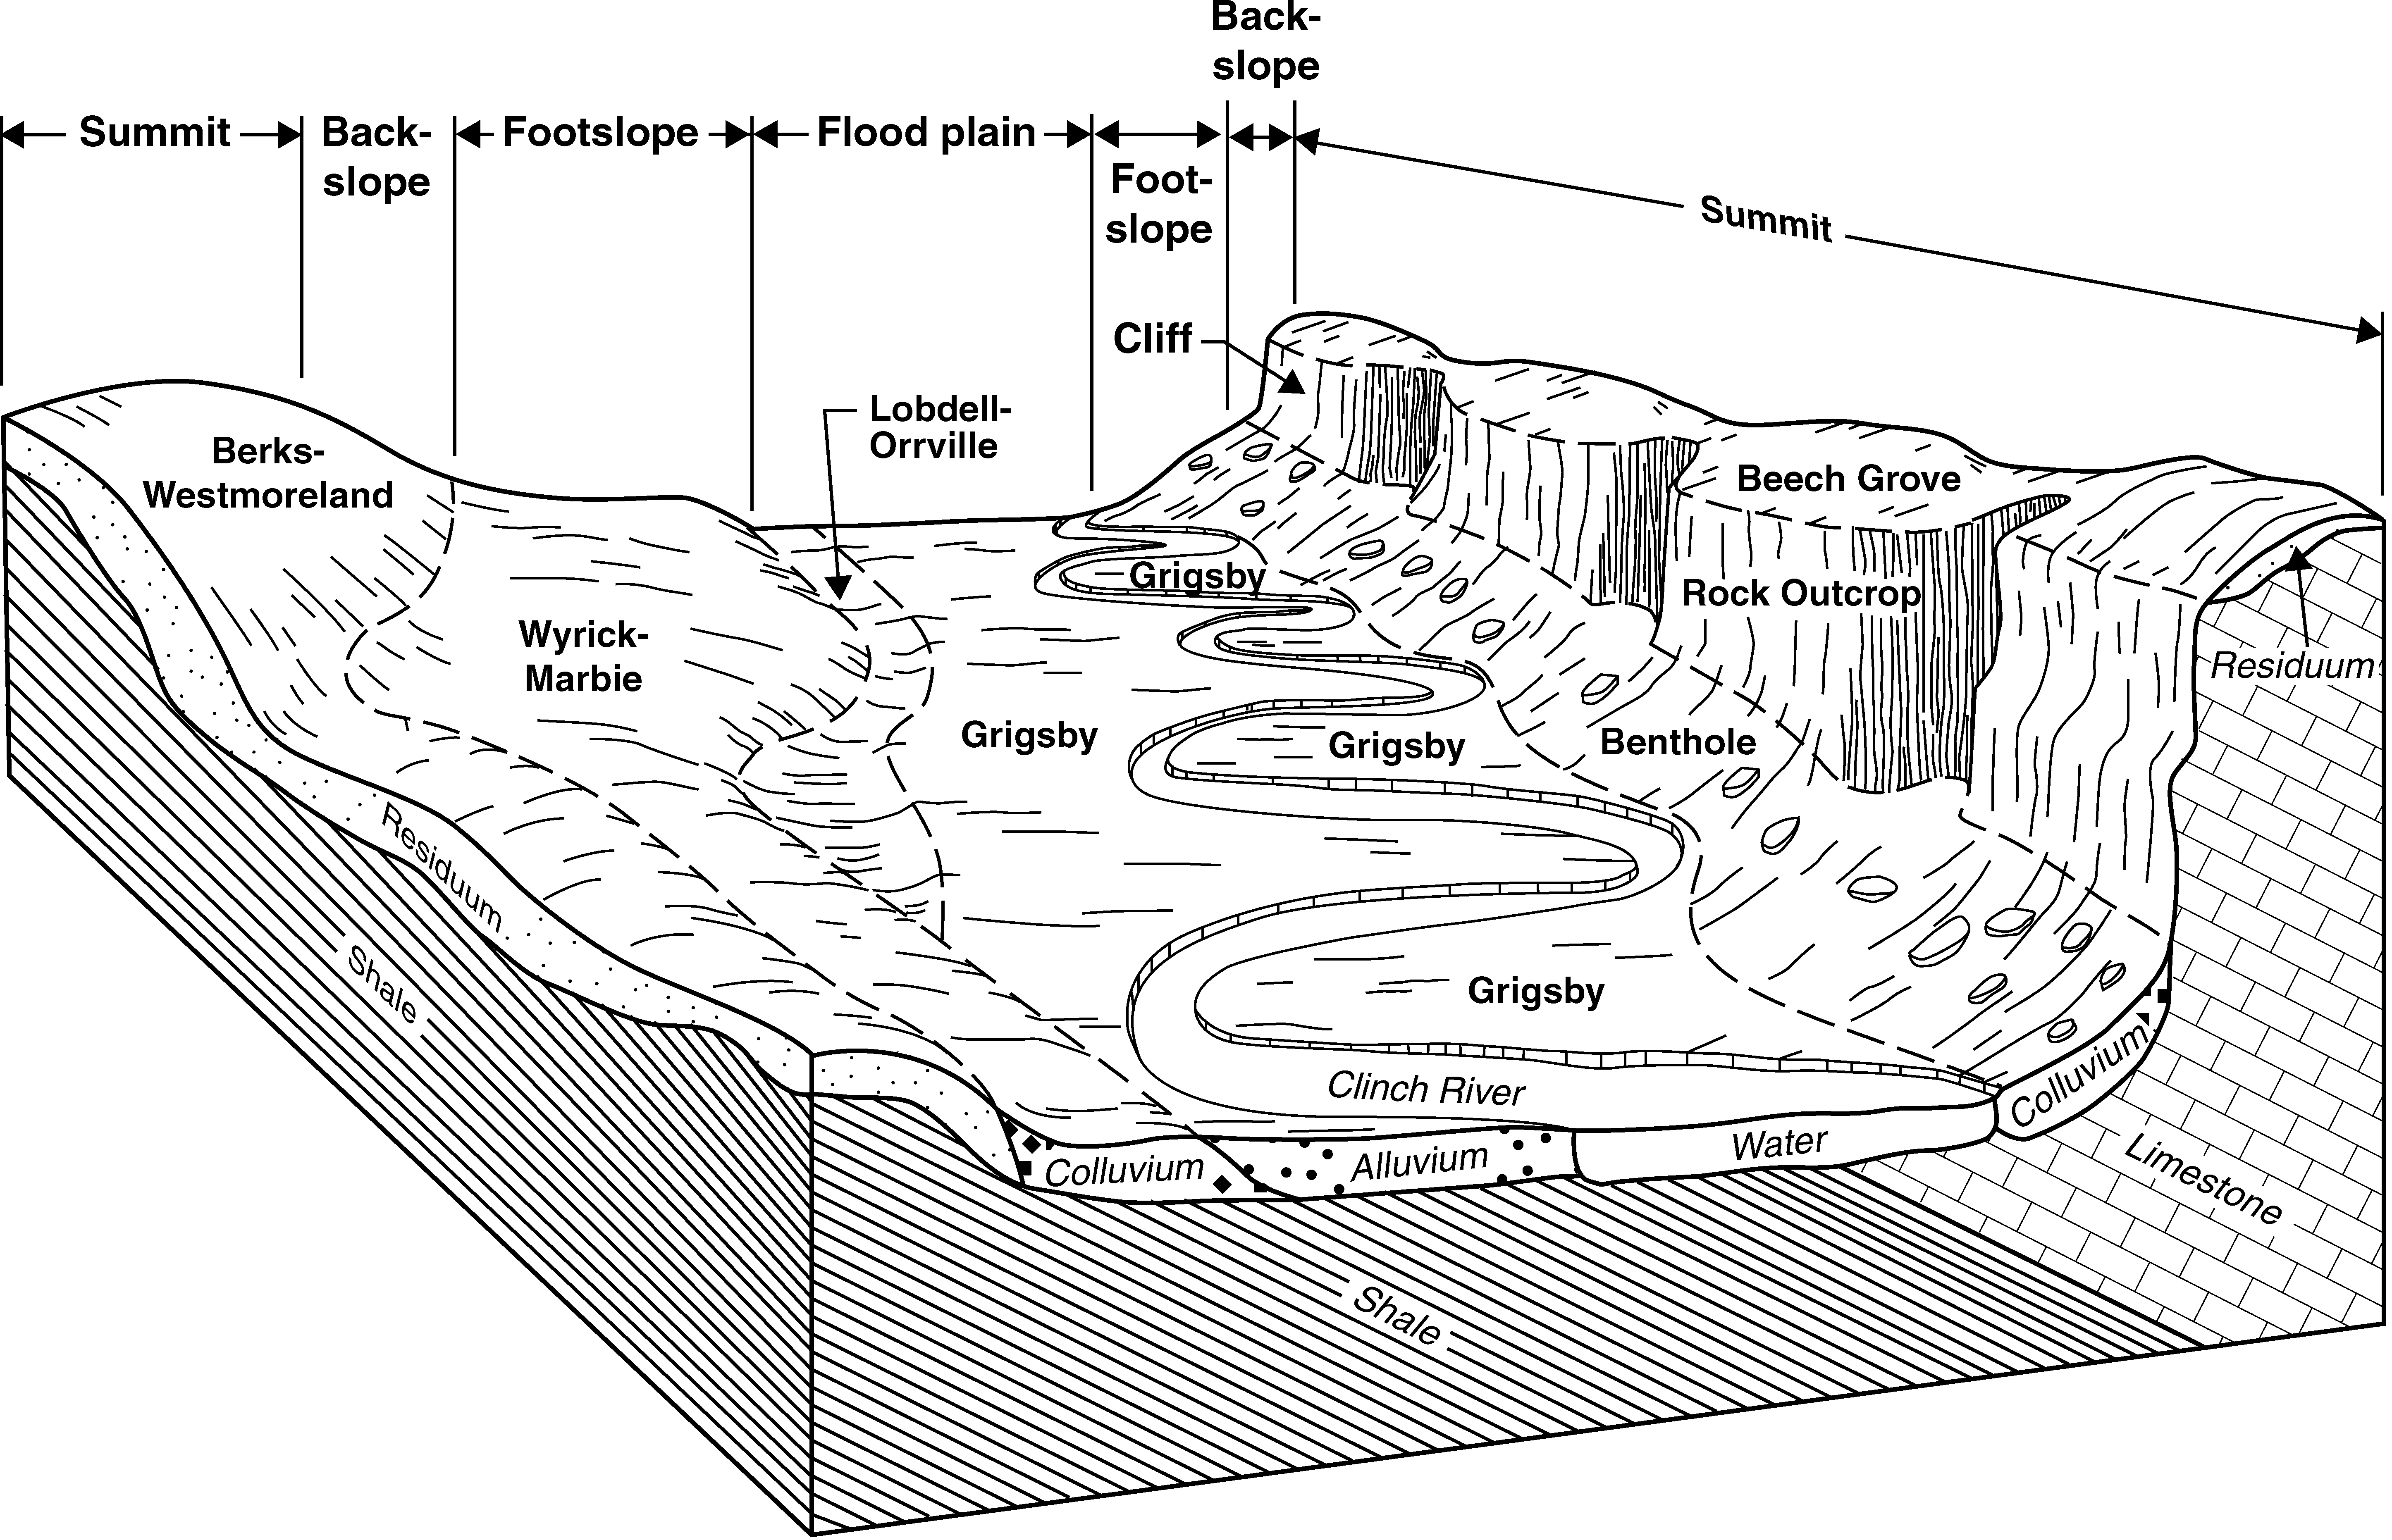
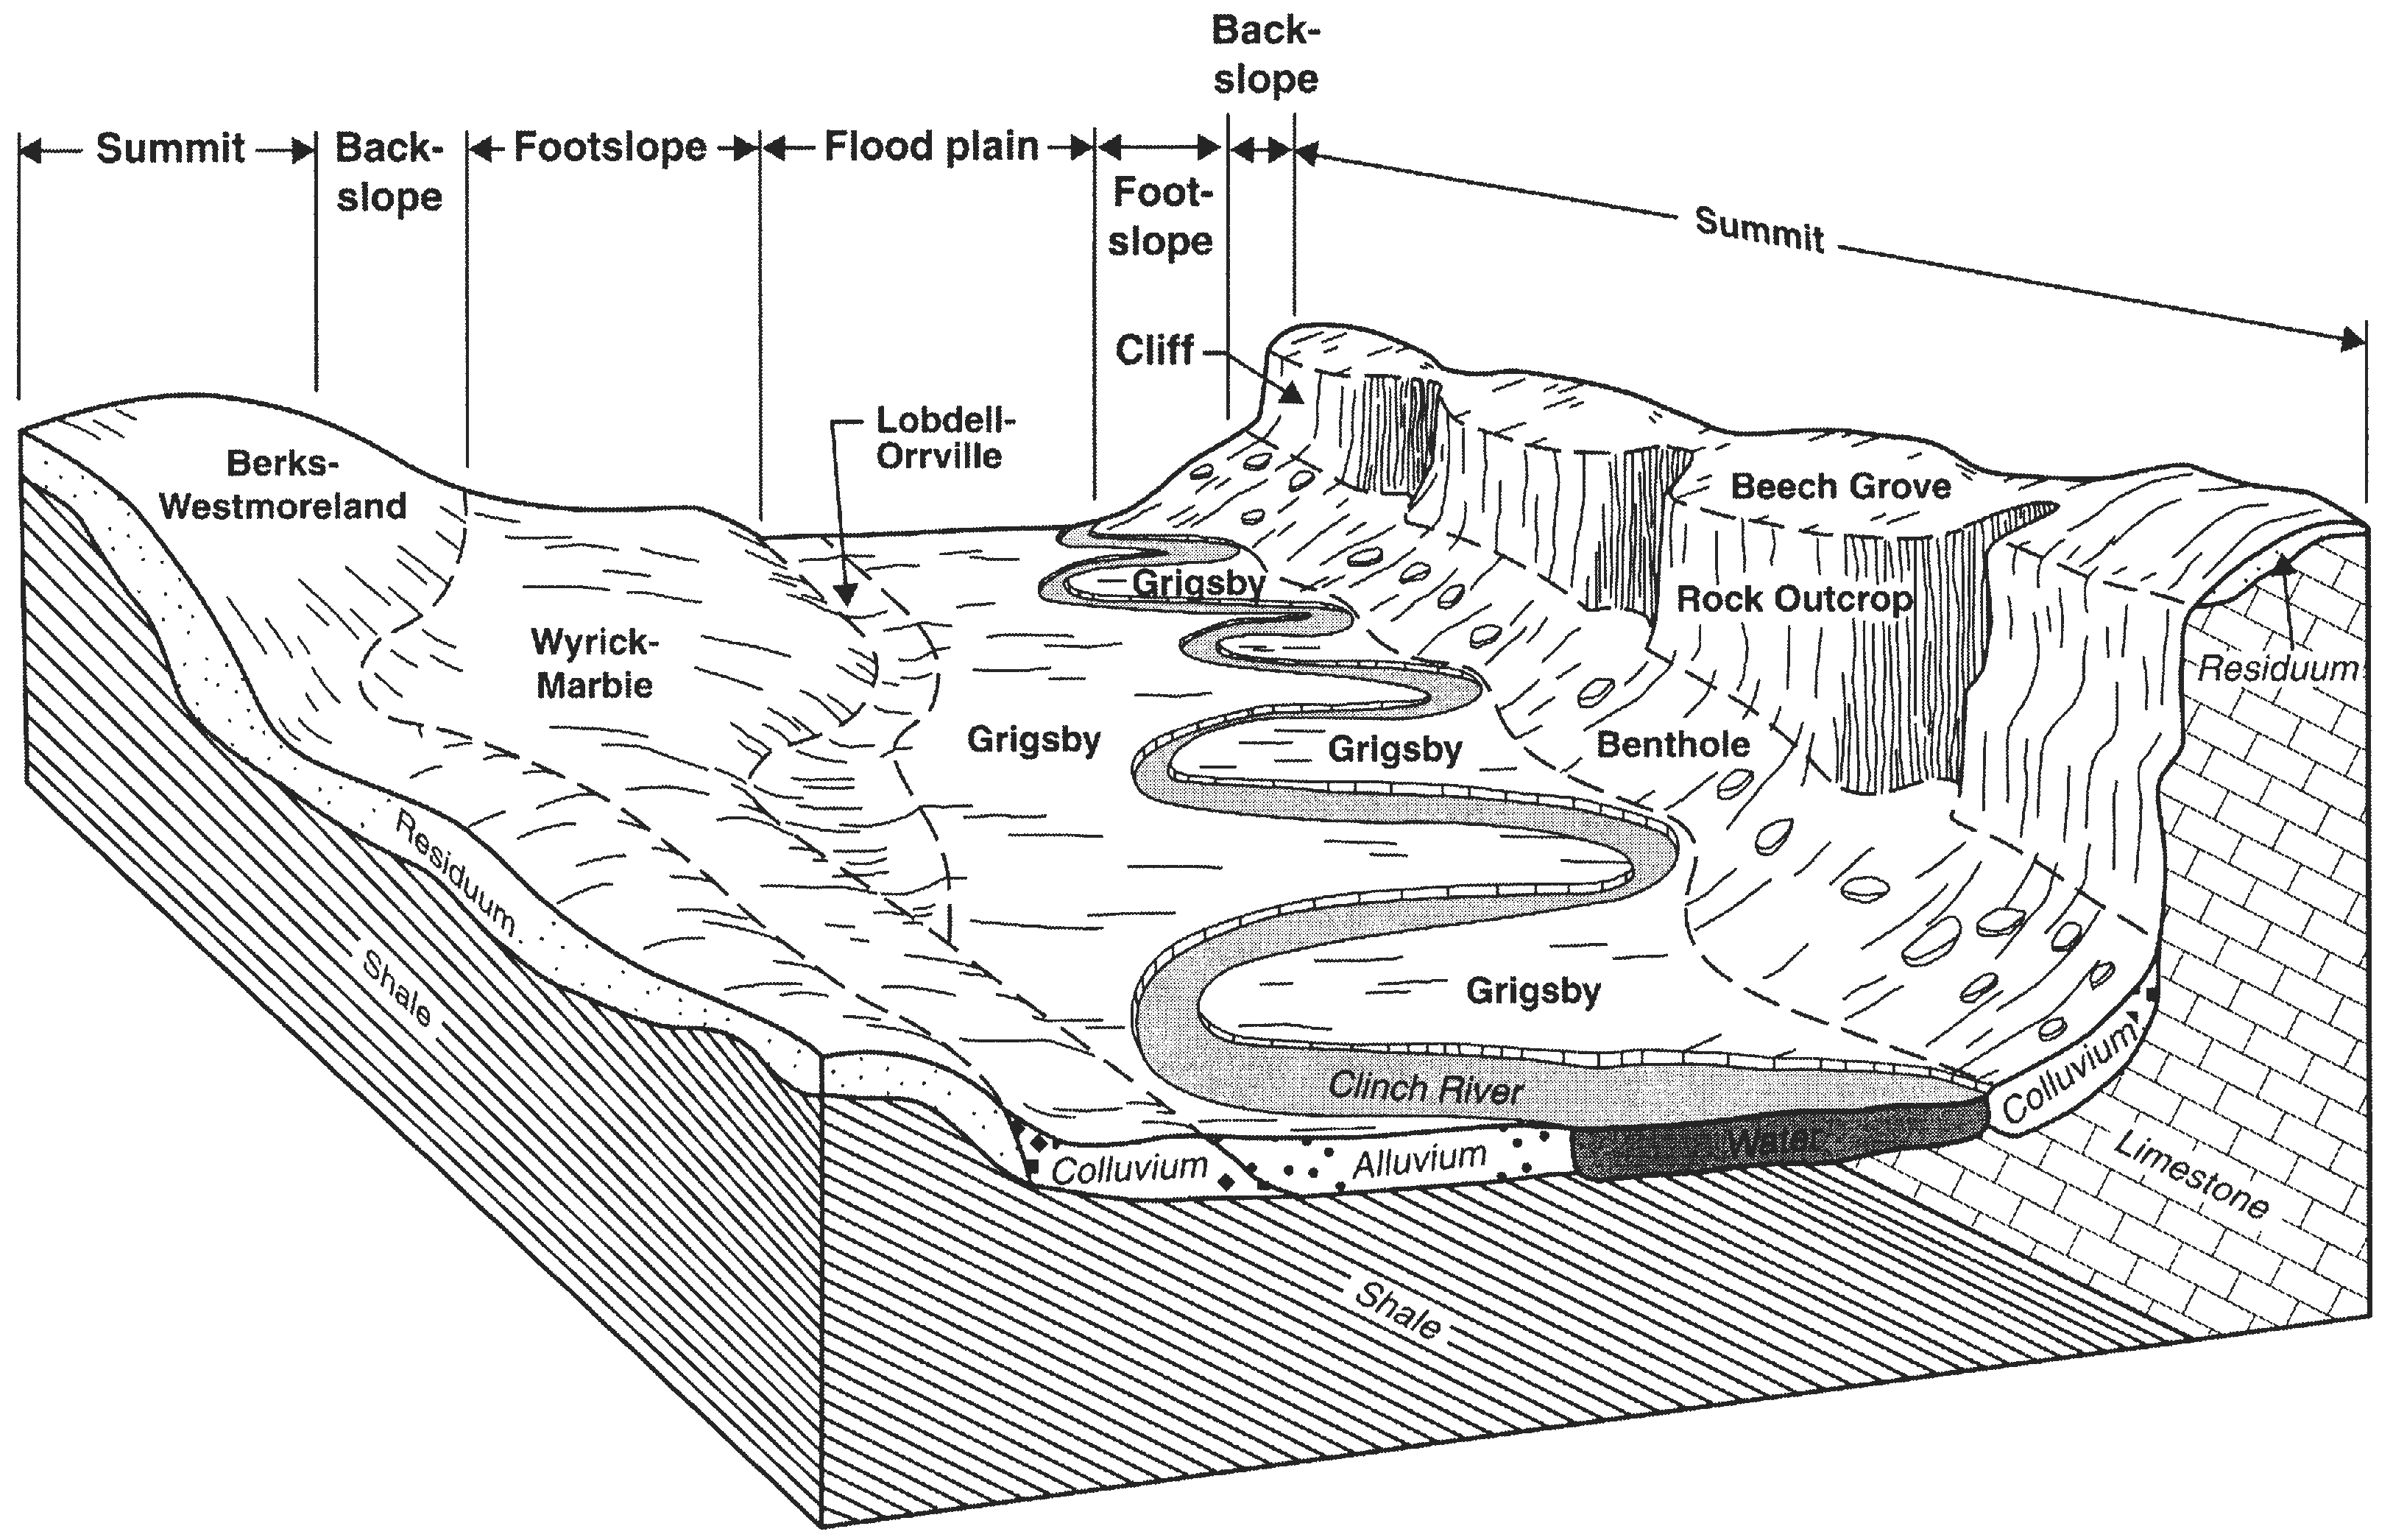
Diagram of a sequence of landform positions along the Clinch River in areas underlain with limestone and shale in Russell County. The soils named on the land surface are shown in their natural relationship to each other and in their relationship to landform position (Soil Survey of Russell County, Virginia; 2007).
- VA-2012-05-11-11 | Russell County - 2007
Diagram of a sequence of landform positions in the Appalachian Plateau area of Russell County. The soils named on the land surface are shown in their natural relationship to each other and in their relationship to landform position (Soil Survey of Russell County, Virginia; 2007).
- VA-2012-05-11-12 | Russell County - 2007
Diagram of a sequence of landform positions along the Clinch River in areas underlain with limestone and shale in Russell County. The soils named on the land surface are shown in their natural relationship to each other and in their relationship to landform position (Soil Survey of Russell County, Virginia; 2007).
- WV-2010-11-08-10 | Lincoln County - 2007
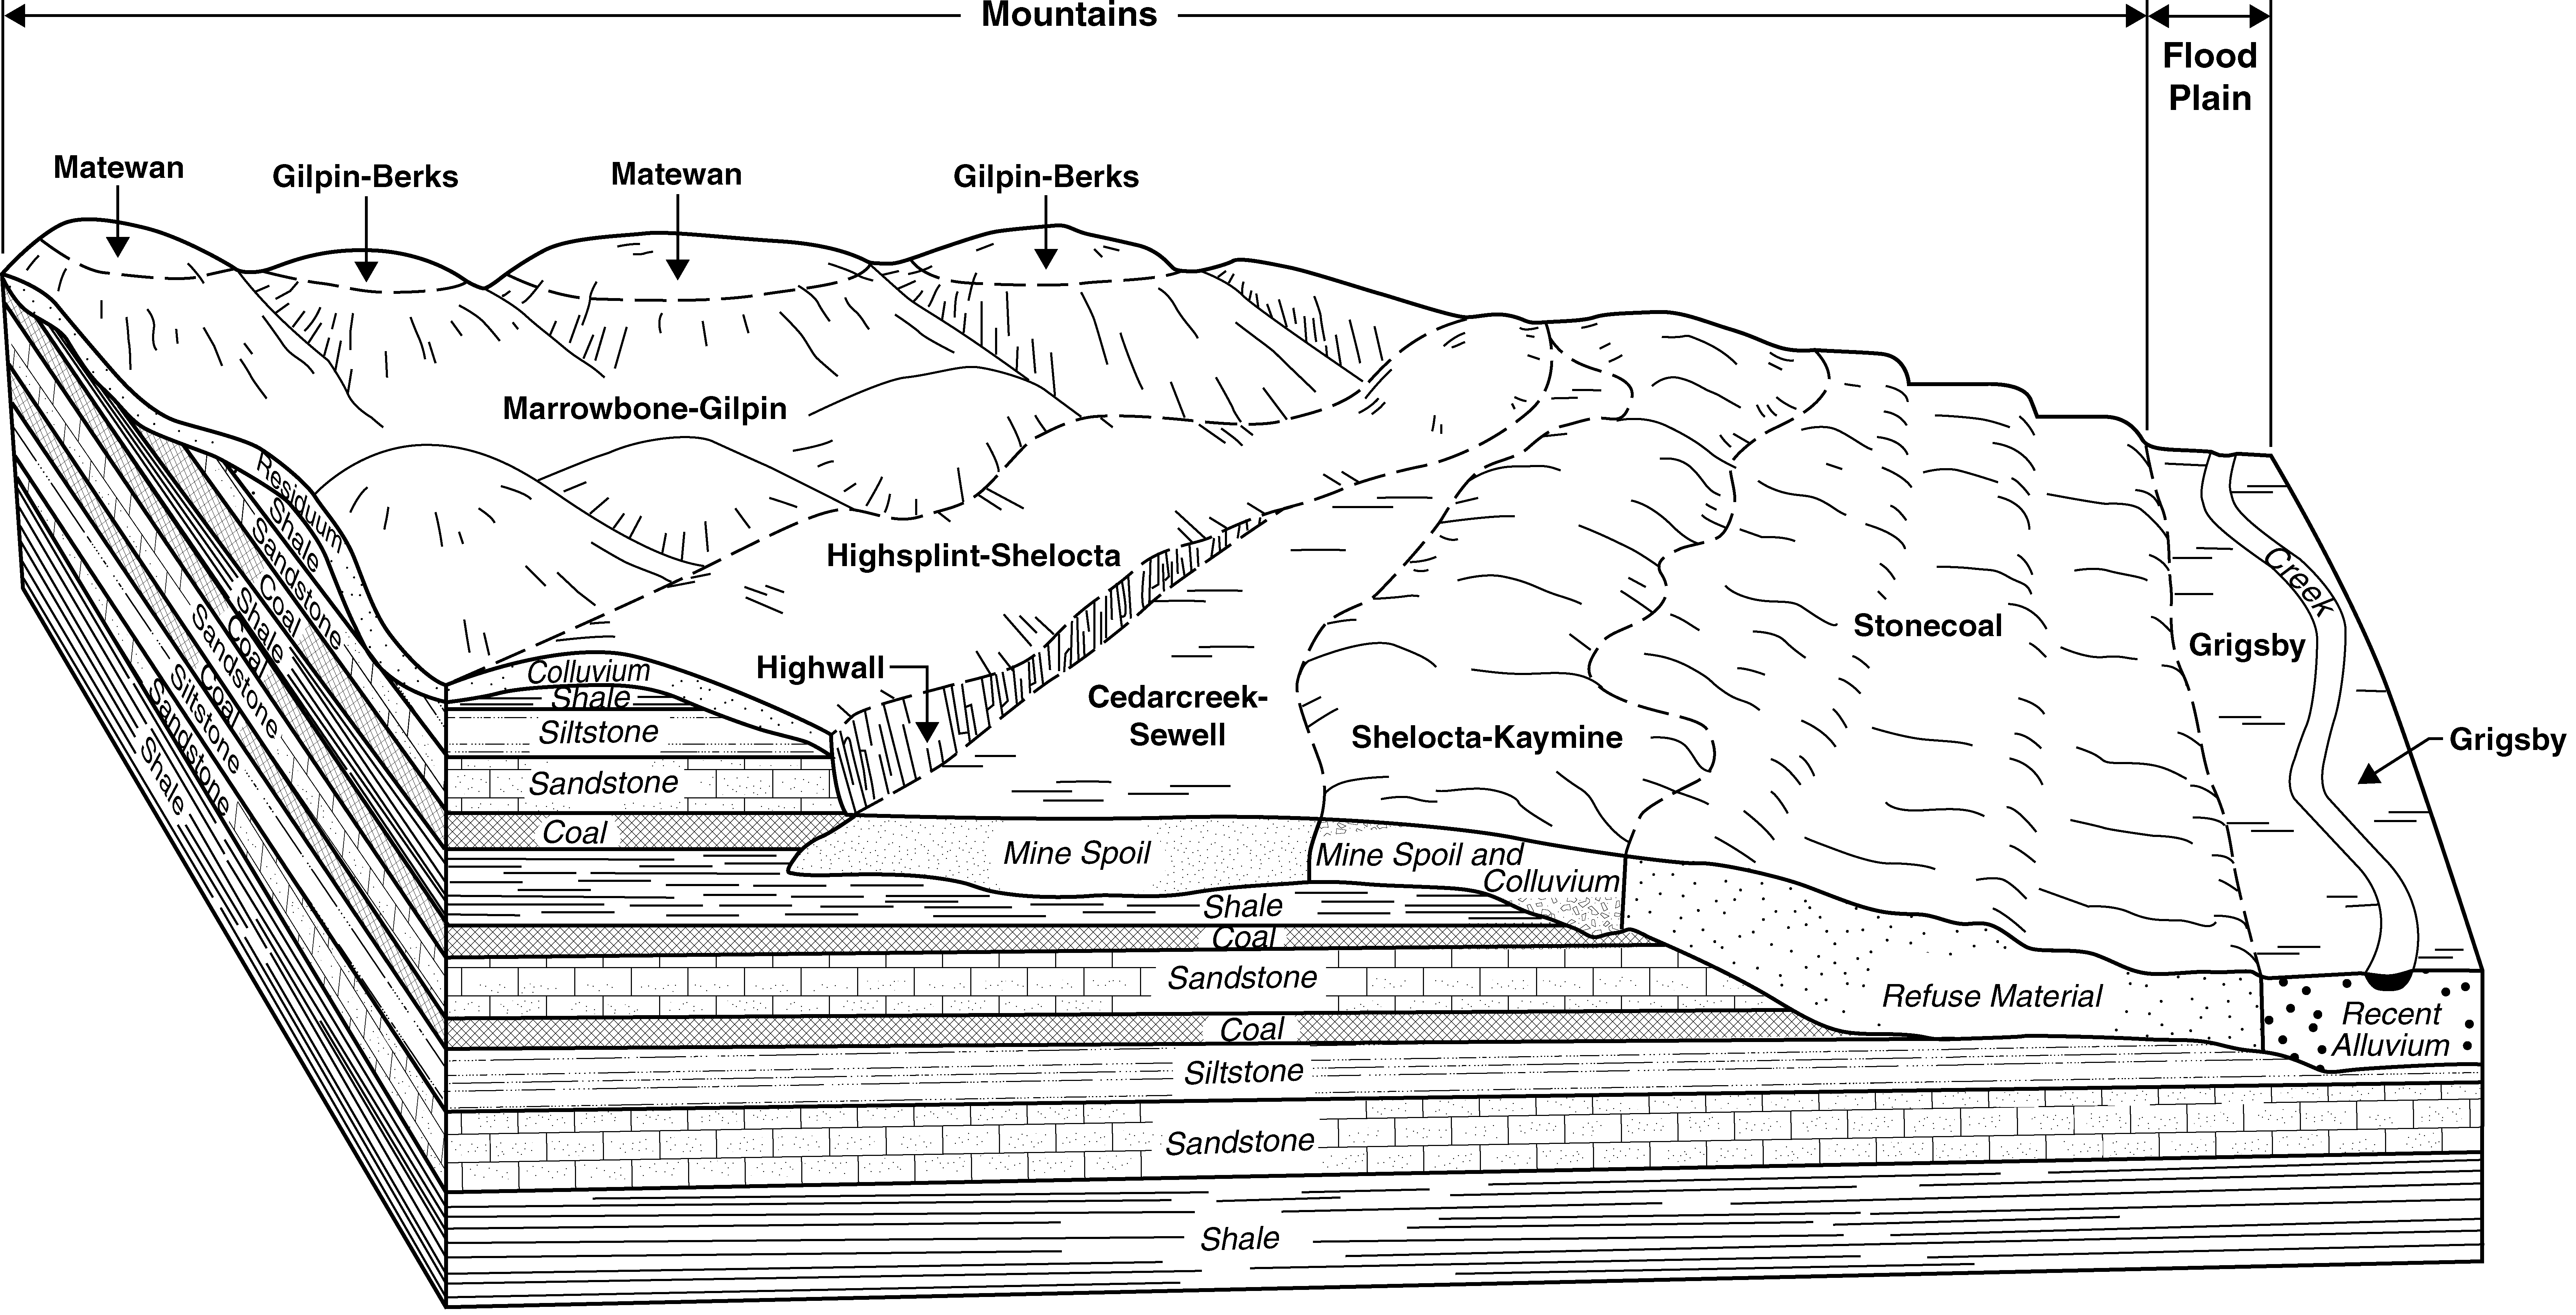
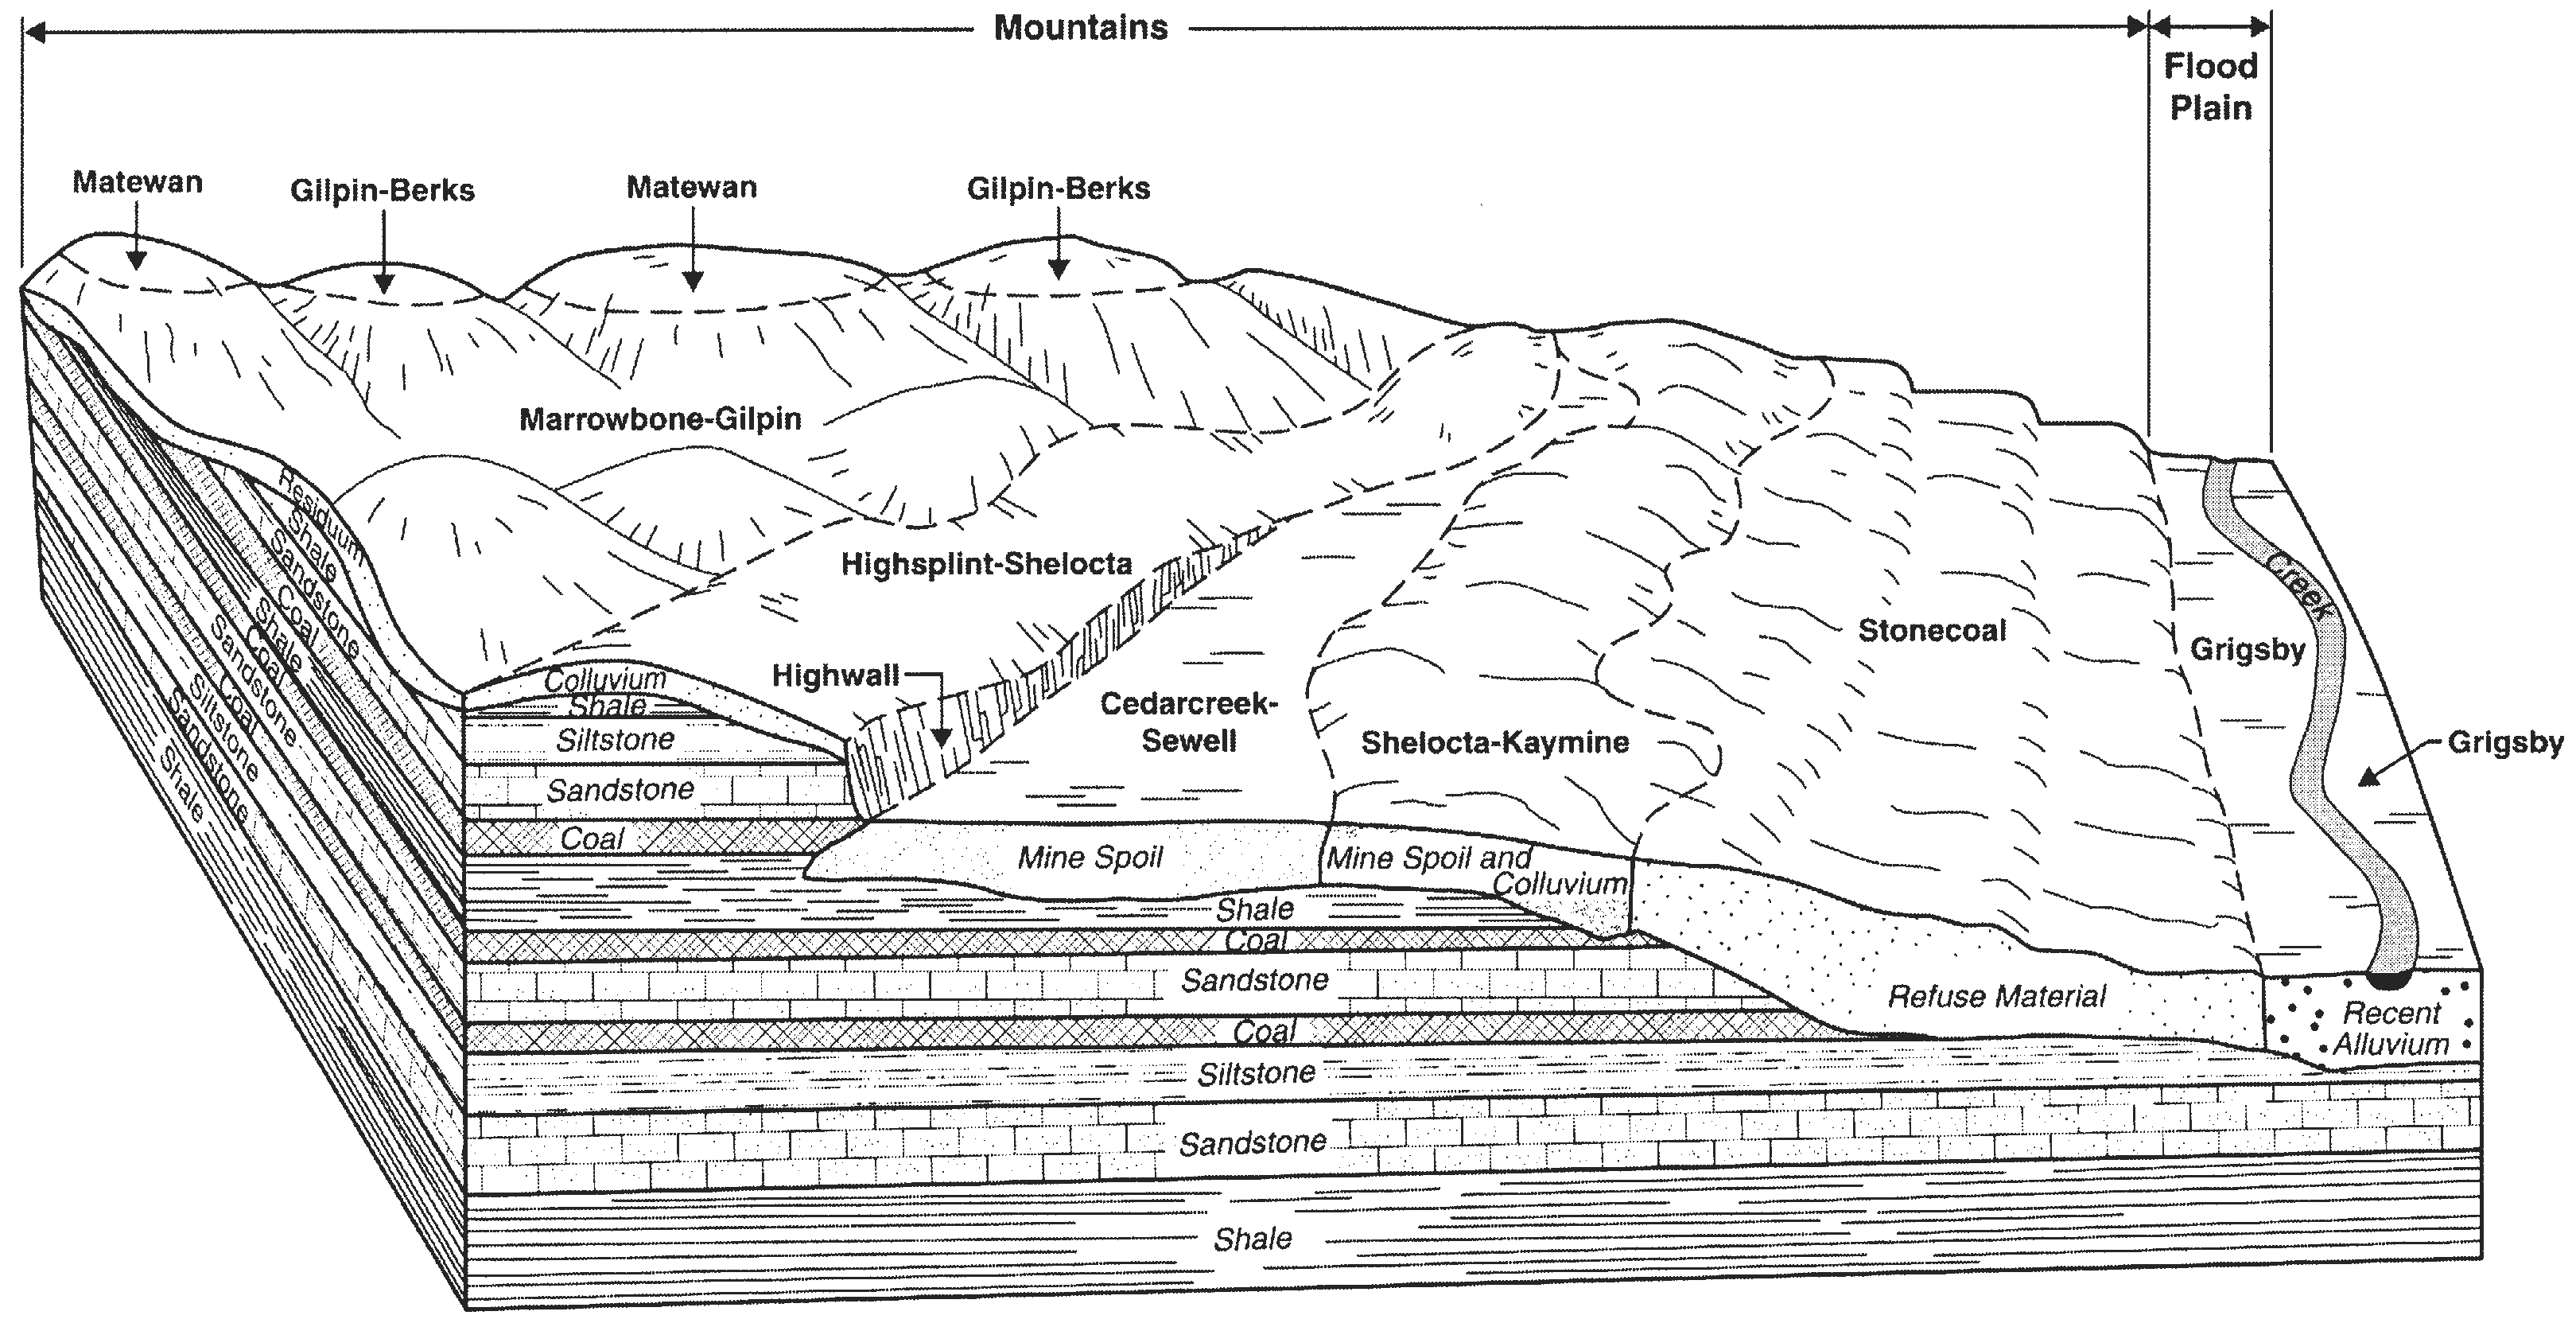
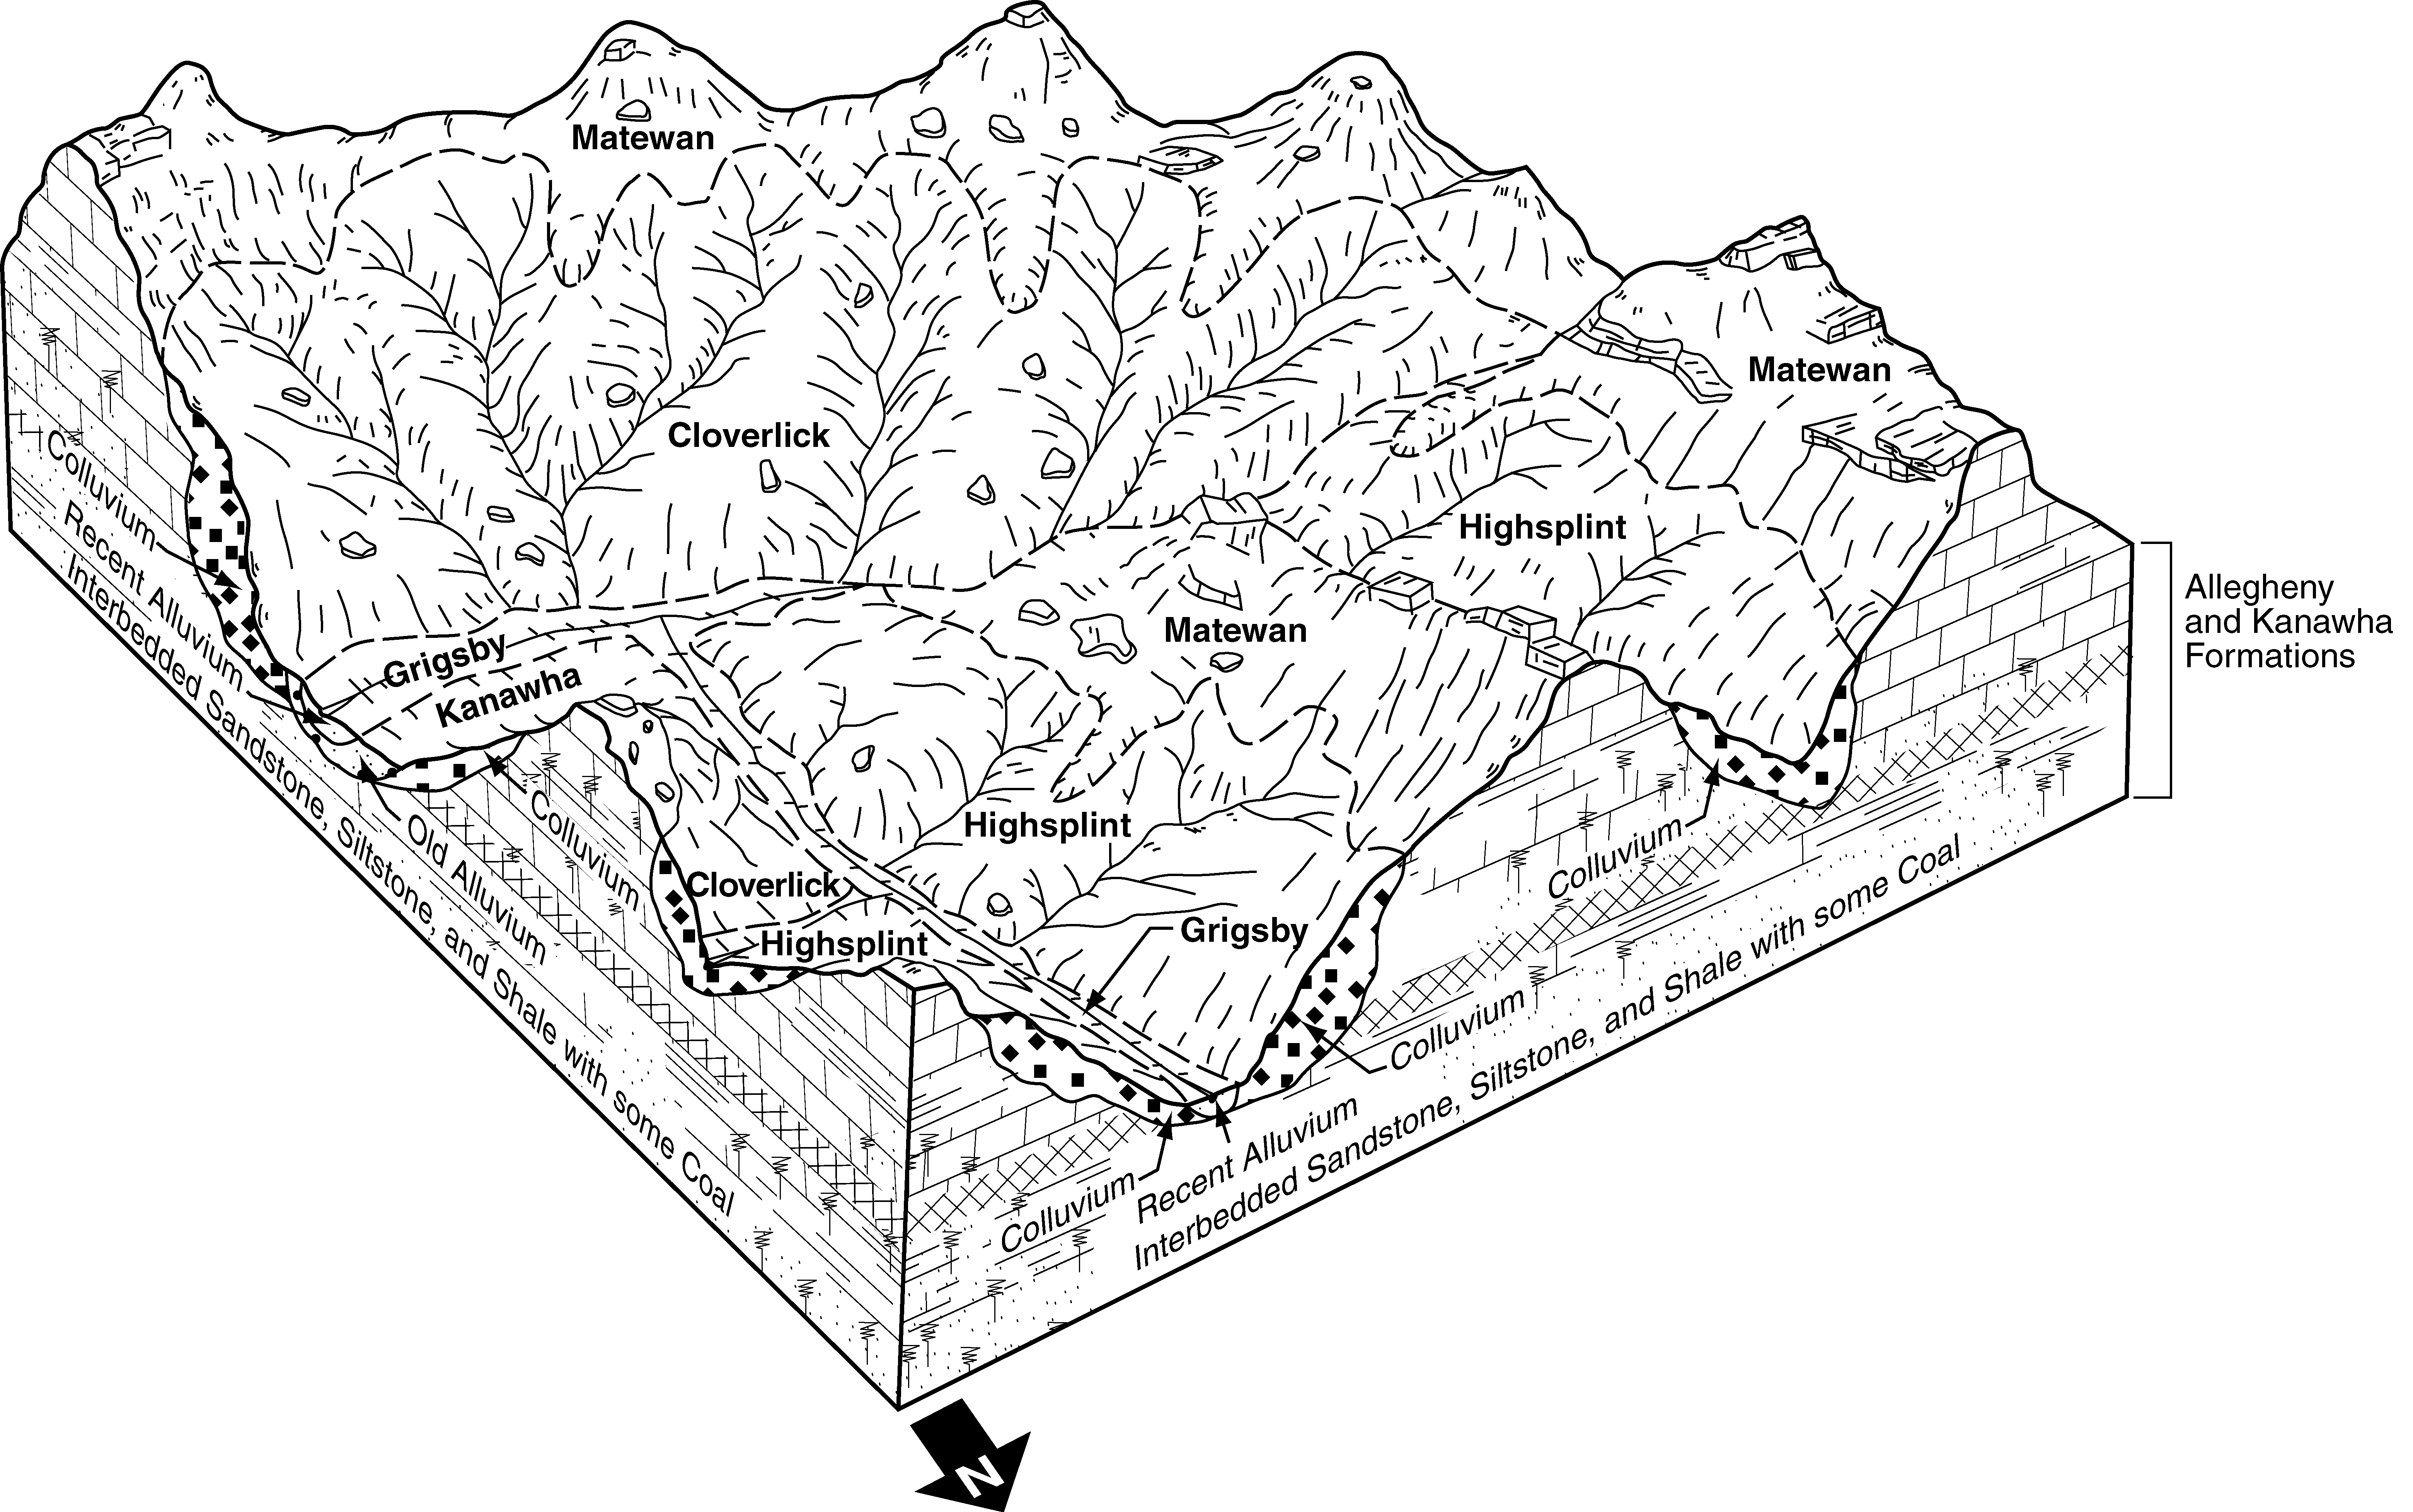
Typical pattern of soils and parent material in an area of the Highsplint-Matewan-Cloverlick general soil map unit (Soil Survey of Lincoln County, West Virginia; 2007).