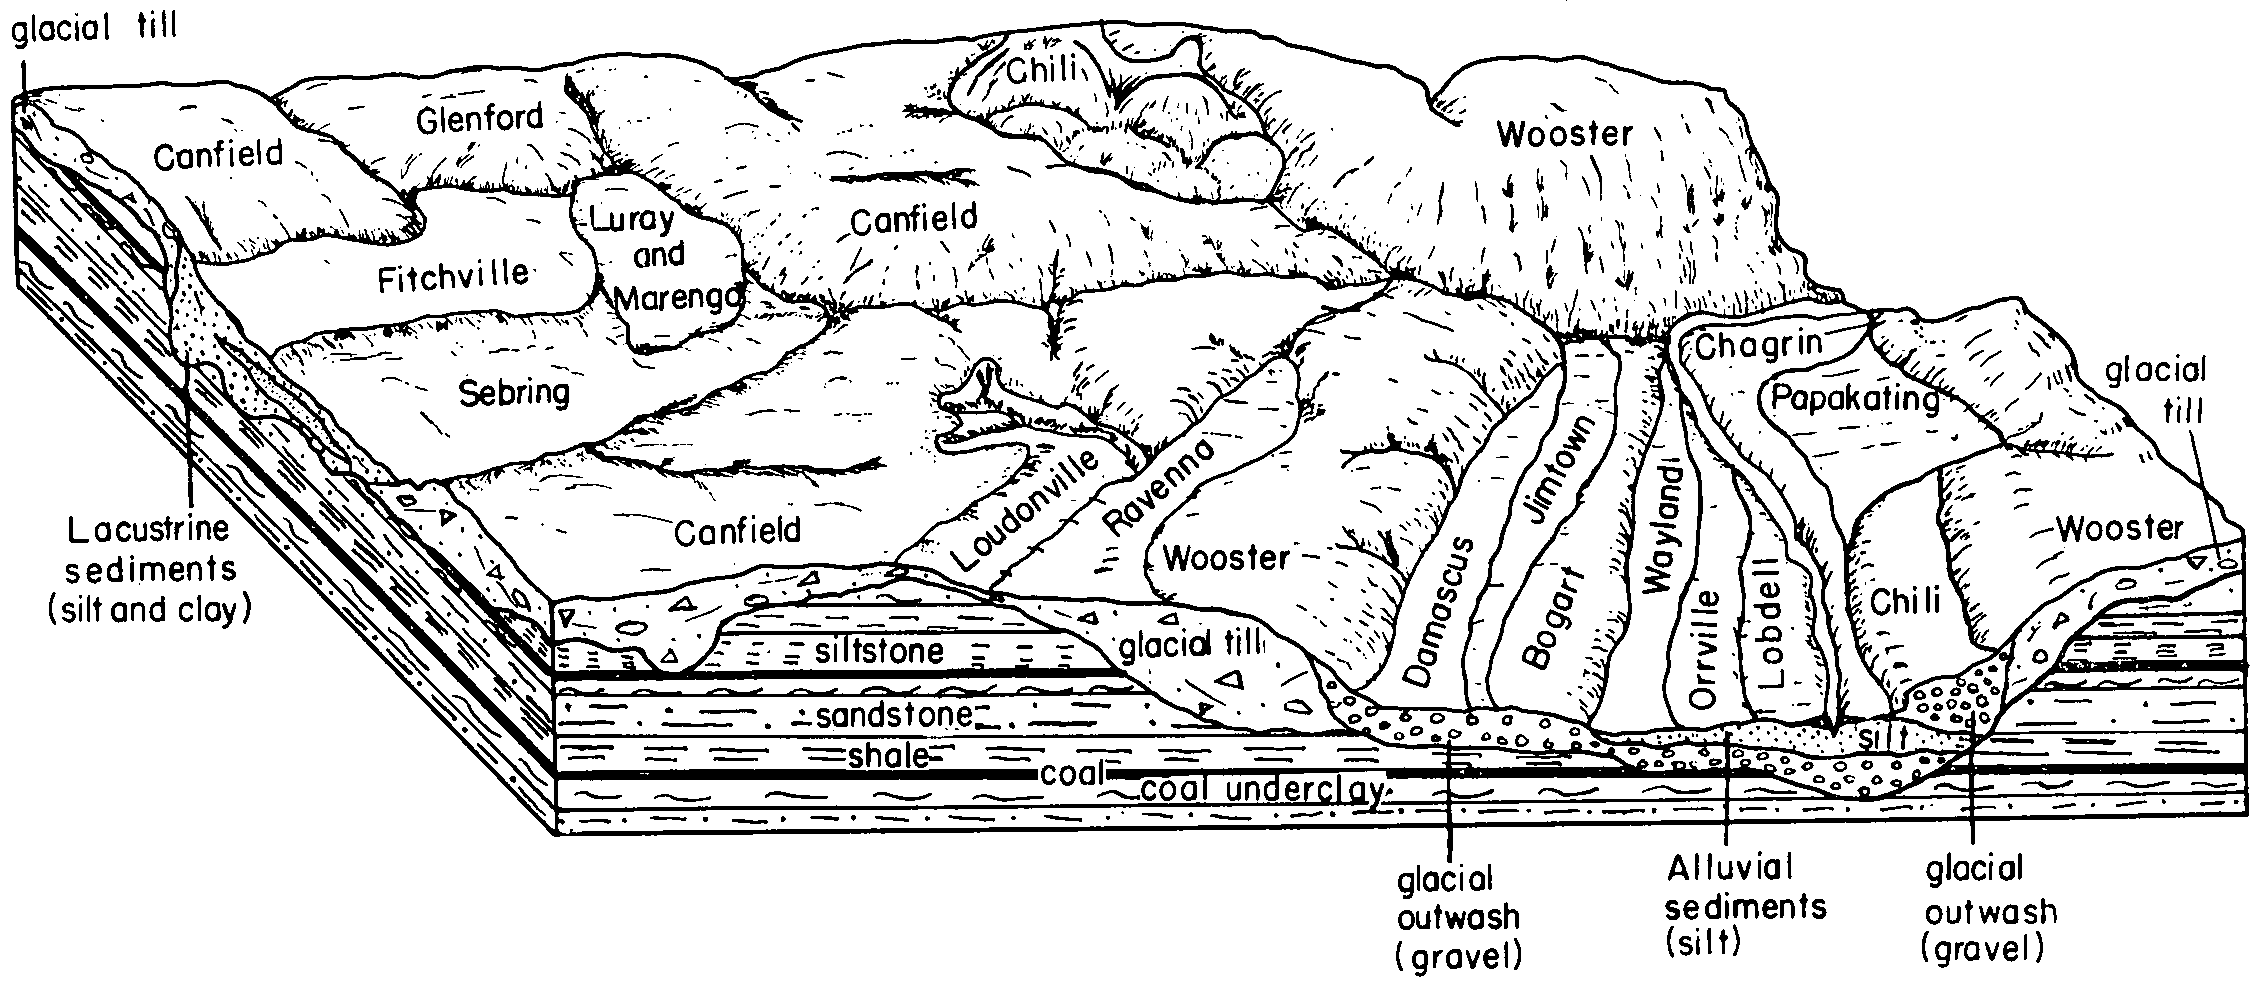
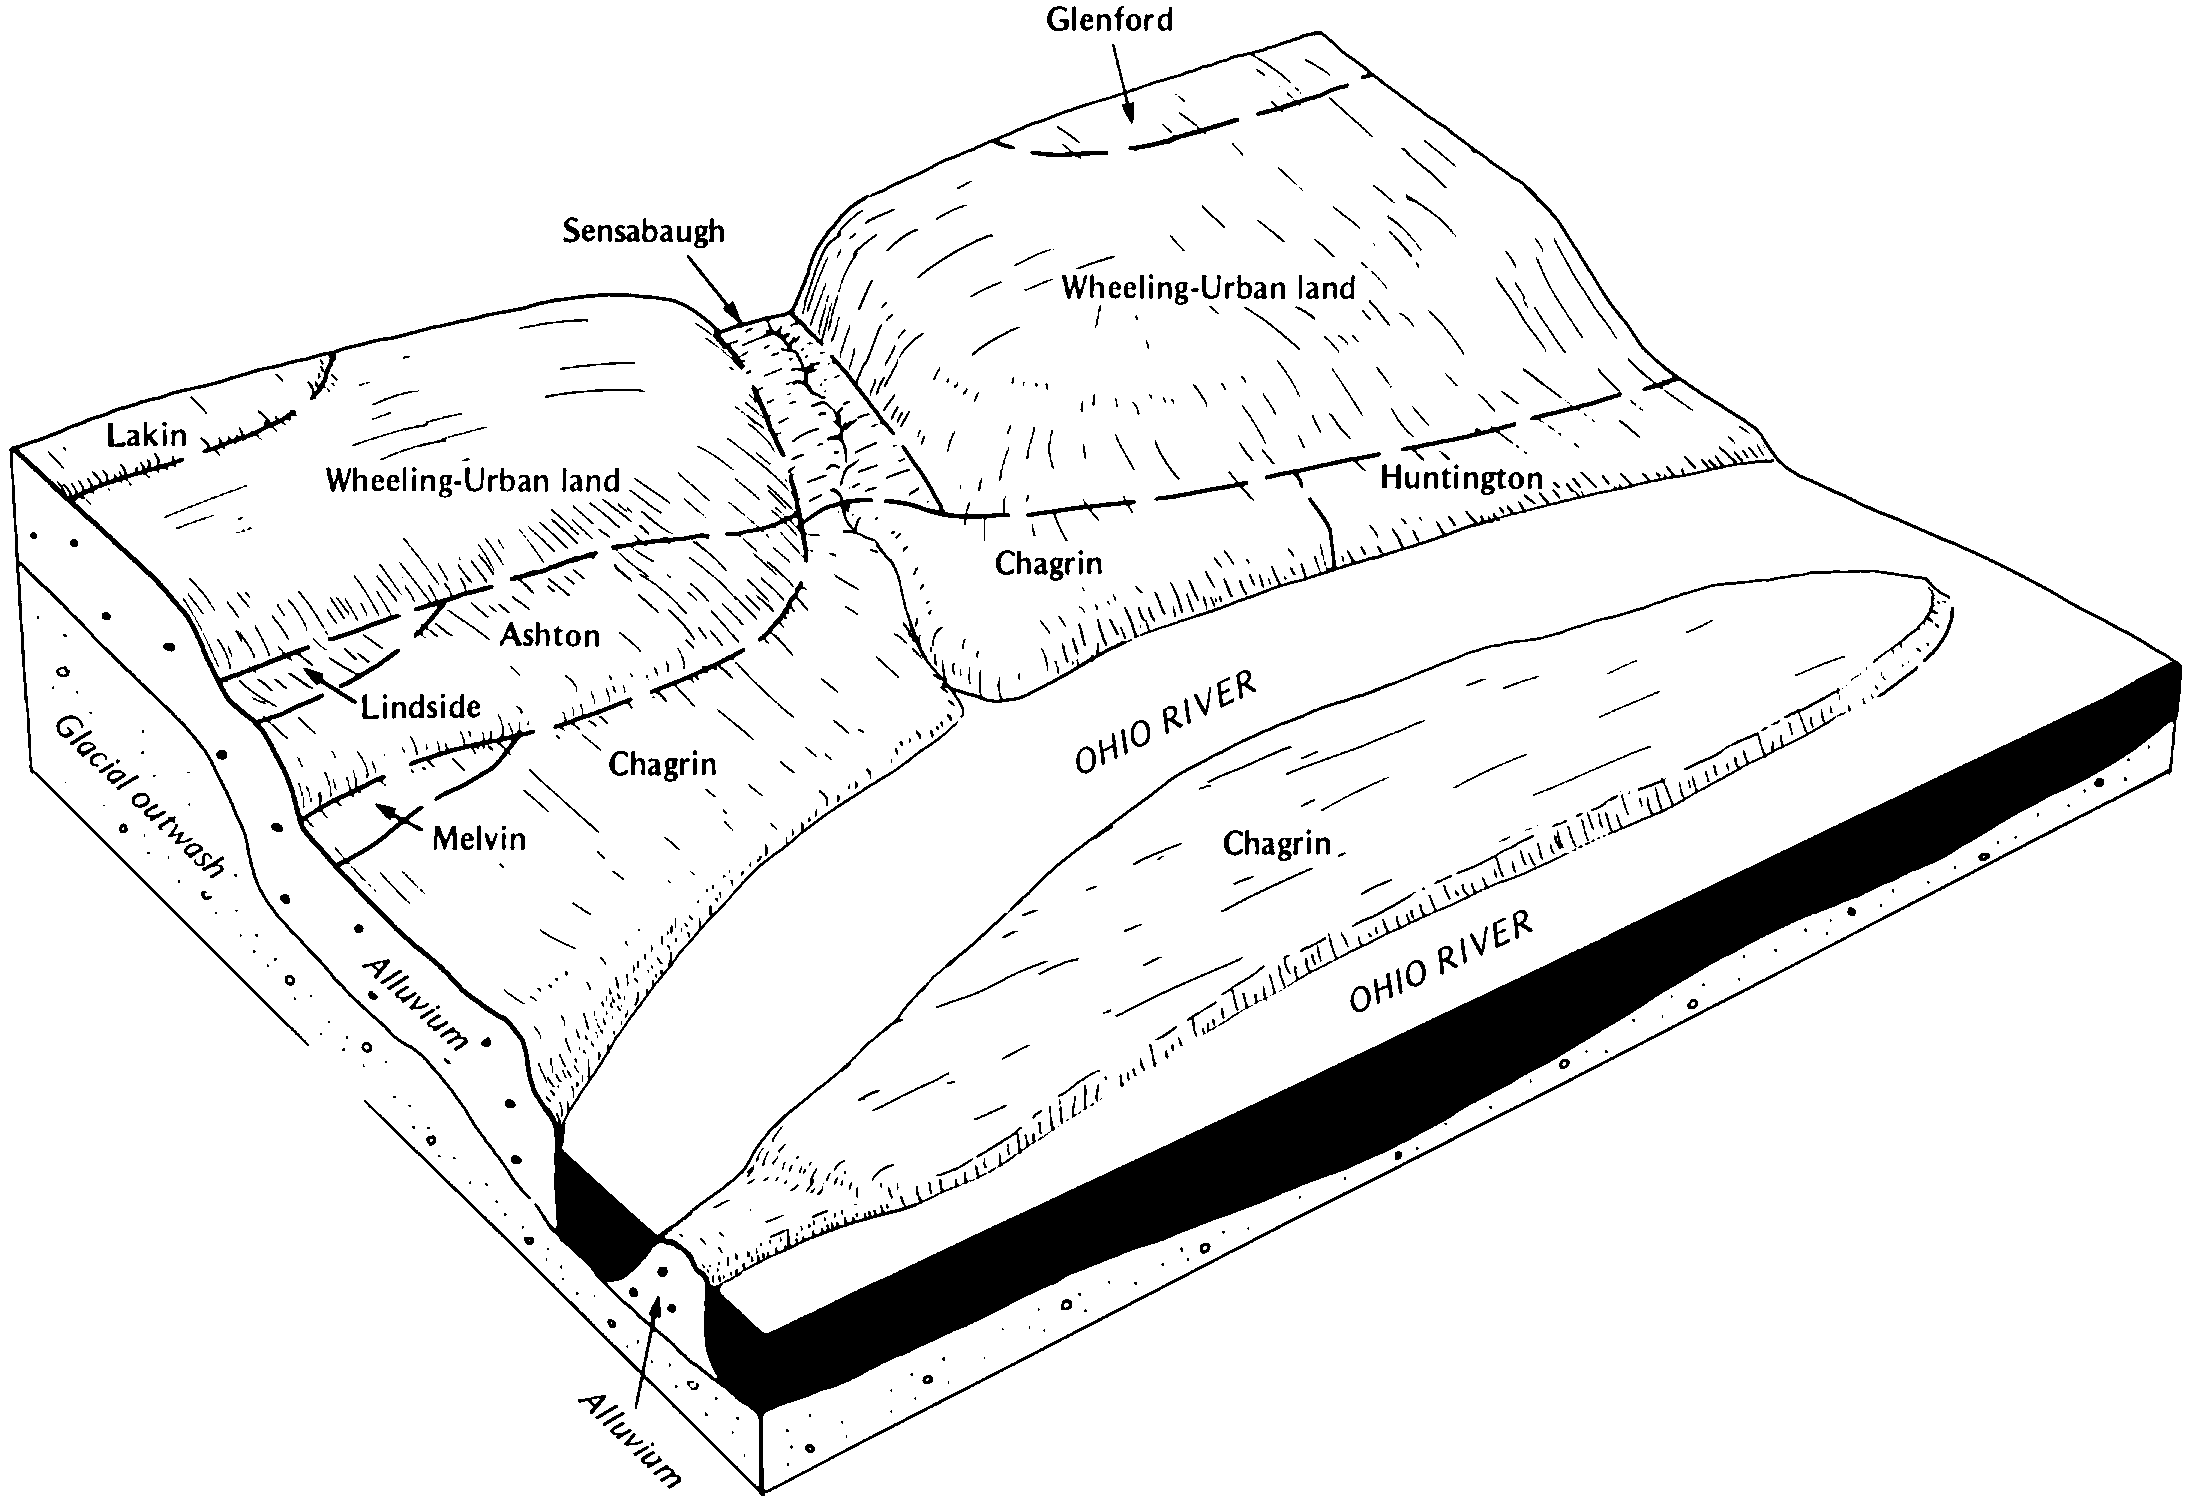
| Glenford silt loam, 2 to 6 percent slopes | GfB | 1266 | 288161 | 2vwvr | oh005 | 1976 | 1:15840 |
Glenford silt loam, 6 to 12 percent slopes | GfC | 540 | 288162 | 2vwvt | oh005 | 1976 | 1:15840 |
Glenford silt loam, 0 to 2 percent slopes | GfA | 413 | 288160 | 2vwvq | oh005 | 1976 | 1:15840 |
Glenford silt loam, 2 to 6 percent slopes | GfB | 528 | 298893 | 2vwvr | oh007 | 2001 | 1:12000 |
Glenford silt loam, 0 to 2 percent slopes | GfA | 397 | 298892 | 2vwvq | oh007 | 2001 | 1:12000 |
Glenford silt loam, 6 to 12 percent slopes | GfC | 110 | 298894 | 2vwvt | oh007 | 2001 | 1:12000 |
Glenford silt loam, 12 to 18 percent slopes | GfD | 63 | 298895 | 2vwvx | oh007 | 2001 | 1:12000 |
Glenford silt loam, 3 to 8 percent slopes | GmB | 890 | 537362 | 2s5h4 | oh009 | 1981 | 1:15840 |
Glenford silt loam, 0 to 3 percent slopes | GmA | 520 | 537361 | 2s5h3 | oh009 | 1981 | 1:15840 |
Glenford silt loam, 8 to 15 percent slopes | GmC | 520 | 537363 | 2s5h5 | oh009 | 1981 | 1:15840 |
Glenford silt loam, 2 to 6 percent slopes | GfB | 7 | 1008298 | 12v6r | oh009 | 1981 | 1:15840 |
Glenford silt loam, 3 to 8 percent slopes | GfB | 5454 | 537985 | 2s5h4 | oh019 | 1981 | 1:15840 |
Glenford silt loam, 8 to 15 percent slopes | GfC | 4662 | 537986 | 2s5h5 | oh019 | 1981 | 1:15840 |
Glenford silt loam, 2 to 6 percent slopes | GeB | 467 | 1670021 | 1t1sn | oh019 | 1981 | 1:15840 |
Glenford silt loam, 6 to 12 percent slopes | GeC | 76 | 1670715 | 1t2j1 | oh019 | 1981 | 1:15840 |
Glenford silt loam, 6 to 15 percent slopes | GhC | 18 | 1670022 | 1t1sp | oh019 | 1981 | 1:15840 |
Glenford silt loam, 18 to 25 percent slopes, moderately eroded | GpE2 | 227 | 168793 | 5nmy | oh025 | 1972 | 1:20000 |
Glenford silt loam, 2 to 6 percent slopes | GpB | 209 | 168791 | 5nmw | oh025 | 1972 | 1:20000 |
Glenford silt loam, 6 to 12 percent slopes, moderately eroded | GpC2 | 75 | 168792 | 5nmx | oh025 | 1972 | 1:20000 |
Urban land-Glenford complex, 2 to 6 percent slopes | UGpB | 21 | 3404766 | 317mf | oh025 | 1972 | 1:20000 |
Glenford-Urban land complex, 2 to 6 percent slopes | GpUB | 3 | 3404765 | 317md | oh025 | 1972 | 1:20000 |
Glenford silt loam, 6 to 12 percent slopes | GrC | 474 | 298783 | 2vwvt | oh029 | 2005 | 1:12000 |
Glenford silt loam, 2 to 6 percent slopes | GrB | 384 | 298782 | 2vwvr | oh029 | 2005 | 1:12000 |
Glenford silt loam, 3 to 8 percent slopes | GnB | 4438 | 536642 | 2s5h4 | oh031 | 1996 | 1:15840 |
Glenford silt loam, 8 to 15 percent slopes | GnC | 4374 | 536643 | 2s5h5 | oh031 | 1996 | 1:15840 |
Glenford silt loam, 0 to 3 percent slopes | GnA | 1508 | 536641 | 2s5h3 | oh031 | 1996 | 1:15840 |
Glenford silt loam, occasionally flooded | GpA | 248 | 536644 | l0f3 | oh031 | 1996 | 1:15840 |
Markland-Glenford complex, 15 to 35 percent slopes, eroded | McD2 | 30 | 2108962 | 28sk1 | oh031 | 1996 | 1:15840 |
Glenford silt loam, 6 to 15 percent slopes, eroded | GnC2 | 18 | 2108960 | 28sjz | oh031 | 1996 | 1:15840 |
Glenford silt loam, 2 to 6 percent slopes | GfB | 1 | 709010 | rss9 | oh033 | 1975 | 1:15840 |
Glenford silt loam, 2 to 6 percent slopes | GfB | 768 | 287305 | 2vwvr | oh035 | 1978 | 1:15840 |
Glenford silt loam, 6 to 12 percent slopes | GfC | 244 | 287306 | 2vwvt | oh035 | 1978 | 1:15840 |
Glenford silt loam, 3 to 8 percent slopes | GnB | 2772 | 172263 | 2s5h4 | oh045 | 1998 | 1:12000 |
Glenford silt loam, 6 to 15 percent slopes, eroded | GnC2 | 1400 | 172264 | 5s7x | oh045 | 1998 | 1:12000 |
Glenford silt loam, 2 to 6 percent slopes | GfB | 551 | 287558 | 2vwvr | oh055 | 1979 | 1:15840 |
Glenford silt loam, 6 to 12 percent slopes | GfC | 168 | 287559 | 2vwvt | oh055 | 1979 | 1:15840 |
Glenford silt loam, 0 to 3 percent slopes | GnA | 1606 | 536906 | 2s5h3 | oh059 | 1998 | 1:15840 |
Glenford silt loam, 3 to 8 percent slopes | GnB | 1128 | 536907 | 2s5h4 | oh059 | 1998 | 1:15840 |
Glenford-Urban land complex, 0 to 2 percent slopes | GpA | 1028 | 536908 | l0pm | oh059 | 1998 | 1:15840 |
Glenford silt loam, 8 to 15 percent slopes | GsC | 1215 | 536745 | 2s5h5 | oh067 | 1993 | 1:15840 |
Glenford silt loam, 3 to 8 percent slopes | GsB | 918 | 536744 | 2s5h4 | oh067 | 1993 | 1:15840 |
Glenford silt loam, 3 to 8 percent slopes | GfB | 1315 | 1398073 | 2s5h4 | oh073 | 1986 | 1:15840 |
Glenford silt loam, 0 to 3 percent slopes | GfA | 1041 | 1398072 | 2s5h3 | oh073 | 1986 | 1:15840 |
Glenford silt loam, 6 to 15 percent slopes, eroded | GnC2 | 1 | 1398199 | 1hxy6 | oh073 | 1986 | 1:15840 |
Glenford silt loam, 2 to 6 percent slopes | GnB | 2260 | 286907 | 2vwvr | oh075 | 1989 | 1:15840 |
Glenford silt loam, 6 to 12 percent slopes, eroded | GnC2 | 715 | 286908 | 2vwvv | oh075 | 1989 | 1:15840 |
Glenford silt loam, 0 to 2 percent slopes | GnA | 295 | 286906 | 2vwvq | oh075 | 1989 | 1:15840 |
Glenford silt loam, 6 to 15 percent slopes | GpC | 1 | 1677006 | 1t91z | oh075 | 1989 | 1:15840 |
Glenford silt loam, 3 to 8 percent slopes | GsB | 34 | 536083 | 2s5h4 | oh081 | 1987 | 1:15840 |
Glenford silt loam, 8 to 15 percent slopes | GsC | 10 | 536084 | 2s5h5 | oh081 | 1987 | 1:15840 |
Glenford silt loam, 2 to 6 percent slopes | GnB | 6220 | 613588 | nlh5 | oh083 | 1983 | 1:15840 |
Glenford silt loam, 0 to 2 percent slopes | GnA | 1393 | 613587 | nlh4 | oh083 | 1983 | 1:15840 |
Glenford silt loam, 6 to 12 percent slopes | GnC | 759 | 613589 | nlh6 | oh083 | 1983 | 1:15840 |
Glenford silt loam, 2 to 6 percent slopes | GfB | 843 | 286815 | 2vwvr | oh085 | 1976 | 1:15840 |
Glenford silt loam, 0 to 2 percent slopes | GfA | 483 | 286814 | 2vwvq | oh085 | 1976 | 1:15840 |
Glenford silt loam, 2 to 6 percent slopes | GfB | 4225 | 171031 | 5qz4 | oh089 | 1986 | 1:15840 |
Glenford silt loam, 0 to 2 percent slopes | GfA | 1685 | 171030 | 5qz3 | oh089 | 1986 | 1:15840 |
Glenford silt loam, 2 to 6 percent slopes | GfB | 521 | 816772 | 2vwvr | oh099 | 1966 | 1:15840 |
Glenford silt loam, 6 to 12 percent slopes, eroded | GfC2 | 137 | 816773 | 2vwvv | oh099 | 1966 | 1:15840 |
Glenford silt loam, 2 to 6 percent slopes | GfB | 1992 | 288349 | 2vwvr | oh103 | 1974 | 1:15840 |
Glenford silt loam, 0 to 2 percent slopes | GfA | 290 | 288348 | 2vwvq | oh103 | 1974 | 1:15840 |
Glenford silt loam, 6 to 12 percent slopes, eroded | GfC2 | 276 | 288350 | 2vwvv | oh103 | 1974 | 1:15840 |
Glenford silt loam, 6 to 12 percent slopes | GfC | 1 | 1412558 | 2vwvt | oh103 | 1974 | 1:15840 |
Glenford silt loam, 3 to 8 percent slopes | GnB | 407 | 537439 | 2s5h4 | oh115 | 1992 | 1:15840 |
Glenford silt loam, 3 to 8 percent slopes | GfB | 6869 | 537893 | 2s5h4 | oh119 | 1989 | 1:15840 |
Glenford silt loam, 8 to 15 percent slopes | GfC2 | 4285 | 537894 | 2s5h5 | oh119 | 1989 | 1:15840 |
Markland-Glenford complex, 15 to 35 percent slopes, eroded | McD2 | 2383 | 537915 | l1r3 | oh119 | 1989 | 1:15840 |
Glenford silt loam, 0 to 3 percent slopes | GfA | 1392 | 537892 | 2s5h3 | oh119 | 1989 | 1:15840 |
Urban land-Glenford complex, 2 to 8 percent slopes | UsB | 750 | 537943 | l1s0 | oh119 | 1989 | 1:15840 |
Glenford silt loam, 1 to 8 percent slopes | GnB | 3651 | 537541 | l1c1 | oh127 | 1984 | 1:15840 |
Glenford silt loam, 2 to 6 percent slopes | GoB | 140 | 1541663 | 1nr72 | oh127 | 1984 | 1:15840 |
Glenford silt loam, 2 to 6 percent slopes | GfB | 1231 | 288456 | 2vwvr | oh133 | 1973 | 1:15840 |
Geeburg and Glenford silt loams, 18 to 50 percent slopes | GeF | 914 | 288454 | 2vwvz | oh133 | 1973 | 1:15840 |
Glenford silt loam, 6 to 12 percent slopes, eroded | GfC2 | 421 | 288457 | 2vwvv | oh133 | 1973 | 1:15840 |
Glenford silt loam, 0 to 2 percent slopes | GfA | 145 | 288455 | 2vwvq | oh133 | 1973 | 1:15840 |
Glenford silt loam, 12 to 18 percent slopes, eroded | GfD2 | 103 | 288458 | 2vwvy | oh133 | 1973 | 1:15840 |
Glenford silt loam, 2 to 6 percent slopes | GfB | 2012 | 170757 | 2vwvr | oh139 | 1971 | 1:15840 |
Glenford silt loam, 0 to 2 percent slopes | GfA | 447 | 170756 | 2vwvq | oh139 | 1971 | 1:15840 |
Glenford silt loam, 6 to 12 percent slopes | GfC | 245 | 170758 | 2vwvt | oh139 | 1971 | 1:15840 |
Glenford silt loam, 2 to 6 percent slopes | GnB | 873 | 170880 | 5qt8 | oh141 | 1997 | 1:15840 |
Glenford silt loam, 0 to 2 percent slopes | GnA | 738 | 170879 | 5qt7 | oh141 | 1997 | 1:15840 |
Glenford silt loam, 2 to 6 percent slopes | GtB | 6547 | 169562 | 5pfr | oh143 | 1983 | 1:15840 |
Glenford silt loam, 2 to 6 percent slopes | GhB | 2 | 1592189 | 1qfsy | oh147 | 1978 | 1:15840 |
Glenford silt loam, 2 to 6 percent slopes | GfB | 2809 | 288004 | 2vwvr | oh151 | 1967 | 1:15840 |
Glenford silt loam, 6 to 12 percent slopes | GfC | 1638 | 288005 | 2vwvt | oh151 | 1967 | 1:15840 |
Glenford silt loam, 0 to 2 percent slopes | GfA | 765 | 288003 | 2vwvq | oh151 | 1967 | 1:15840 |
Glenford silt loam, 12 to 18 percent slopes, eroded | GfD2 | 367 | 288007 | 2vwvy | oh151 | 1967 | 1:15840 |
Glenford silt loam, 6 to 12 percent slopes, eroded | GfC2 | 218 | 288006 | 2vwvv | oh151 | 1967 | 1:15840 |
Glenford silt loam, 3 to 8 percent slopes | GhB | 25 | 1595465 | 1qk6m | oh151 | 1967 | 1:15840 |
Oshtemo-Glenford complex, 25 to 75 percent slopes | OtF | 2799 | 825401 | 2s4v5 | oh153 | 1969 | 1:20000 |
Glenford silt loam, 2 to 6 percent slopes | GfB | 2093 | 825353 | 2vwvr | oh153 | 1969 | 1:20000 |
Glenford silt loam, 6 to 12 percent slopes, eroded | GfC2 | 1028 | 825354 | 2vwvv | oh153 | 1969 | 1:20000 |
Glenford-Urban land complex, 2 to 6 percent slopes | GoB | 724 | 825356 | 2vwvs | oh153 | 1969 | 1:20000 |
Glenford silt loam, 12 to 18 percent slopes, eroded | GfD2 | 648 | 825355 | 2vwvy | oh153 | 1969 | 1:20000 |
Glenford silt loam, 0 to 2 percent slopes | GfA | 286 | 825352 | 2vwvq | oh153 | 1969 | 1:20000 |
Glenford-Urban land complex, 6 to 12 percent slopes | GoC | 141 | 825357 | 2vwvw | oh153 | 1969 | 1:20000 |
Glenford silt loam, 2 to 6 percent slopes | GfB | 2720 | 287053 | 2vwvr | oh155 | 1986 | 1:15840 |
Glenford silt loam, 6 to 12 percent slopes | GfC | 520 | 287054 | 2vwvt | oh155 | 1986 | 1:15840 |
Glenford-Urban land complex, 2 to 6 percent slopes | GnB | 285 | 287055 | 2vwvs | oh155 | 1986 | 1:15840 |
Glenford silt loam, 8 to 15 percent slopes | GfC | 7550 | 536310 | 2s5h5 | oh157 | 1981 | 1:15840 |
Glenford silt loam, 3 to 8 percent slopes | GfB | 4125 | 536309 | 2s5h4 | oh157 | 1981 | 1:15840 |
Glenford silt loam, 6 to 15 percent slopes | GeC | 69 | 1589388 | 1qbwl | oh157 | 1981 | 1:15840 |
Glenford silt loam, 2 to 6 percent slopes | GdB | 50 | 1589414 | 1qbxf | oh157 | 1981 | 1:15840 |
Glenford silt loam, 6 to 12 percent slopes, eroded | GdC2 | 15 | 1589415 | 1qbxg | oh157 | 1981 | 1:15840 |
Glenford silt loam, 6 to 12 percent slopes | GdC | 5 | 1589430 | 1qbxy | oh157 | 1981 | 1:15840 |
Glenford silt loam, 3 to 8 percent slopes | GnB | 609 | 536402 | 2s5h4 | oh163 | 1998 | 1:15840 |
Glenford silt loam, 0 to 3 percent slopes | GnA | 561 | 536401 | 2s5h3 | oh163 | 1998 | 1:15840 |
Glenford silt loam, 3 to 8 percent slopes | GnB | 483 | 536500 | 2s5h4 | oh167 | 1973 | 1:15840 |
Glenford silt loam, 0 to 3 percent slopes | GnA | 255 | 536499 | 2s5h3 | oh167 | 1973 | 1:15840 |
Glenford silt loam, 2 to 6 percent slopes | GfB | 8270 | 287195 | 2vwvr | oh169 | 1981 | 1:15840 |
Glenford silt loam, 6 to 12 percent slopes, eroded | GfC2 | 1903 | 287197 | 2vwvv | oh169 | 1981 | 1:15840 |
Glenford silt loam, 6 to 12 percent slopes | GfC | 860 | 287196 | 2vwvt | oh169 | 1981 | 1:15840 |
Glenford silt loam, 0 to 2 percent slopes | GfA | 441 | 287194 | 2vwvq | oh169 | 1981 | 1:15840 |
Glenford silt loam, 12 to 18 percent slopes | GfD | 398 | 287198 | 2vwvx | oh169 | 1981 | 1:15840 |
Glenford silt loam, 2 to 6 percent slopes | GfB | 2188 | 169613 | 5phd | oh175 | 1980 | 1:15840 |
Glenford silt loam, 2 to 6 percent slopes | GfB | 851 | 2633059 | 2vwvr | pa049 | 2012 | 1:12000 |
Glenford silt loam, 6 to 12 percent slopes | GfC | 147 | 2633060 | 2vwvt | pa049 | 2012 | 1:12000 |
Glenford silt loam, 3 to 8 percent slopes | GdB | 16693 | 542157 | 2s5h4 | pa611 | 1979 | 1:15840 |
Glenford silt loam, 8 to 15 percent slopes | GdC | 6539 | 542158 | 2s5h5 | pa611 | 1979 | 1:15840 |
Glenford silt loam, 0 to 3 percent slopes | GdA | 1795 | 542156 | 2s5h3 | pa611 | 1979 | 1:15840 |
Glenford silt loam, 8 to 15 percent slopes | GnC | 64 | 1720652 | 2s5h5 | wv051 | 2007 | 1:12000 |
Glenford silt loam, 3 to 8 percent slopes | GnB | 56 | 1720651 | 2s5h4 | wv051 | 2007 | 1:12000 |
Glenford silt loam, 3 to 8 percent slopes | GsB | 188 | 513712 | 2s5h4 | wv103 | 1988 | 1:24000 |
Glenford silt loam, 3 to 8 percent slopes | GxB | 322 | 1384213 | 2s5h4 | wv600 | 2005 | 1:24000 |
Glenford silt loam, 8 to 15 percent slopes | GxC | 189 | 1384214 | 2s5h5 | wv600 | 2005 | 1:24000 |
Glenford silt loam, 0 to 3 percent slopes | Gy | 176 | 514698 | 2s5h3 | wv612 | 1984 | 1:20000 |