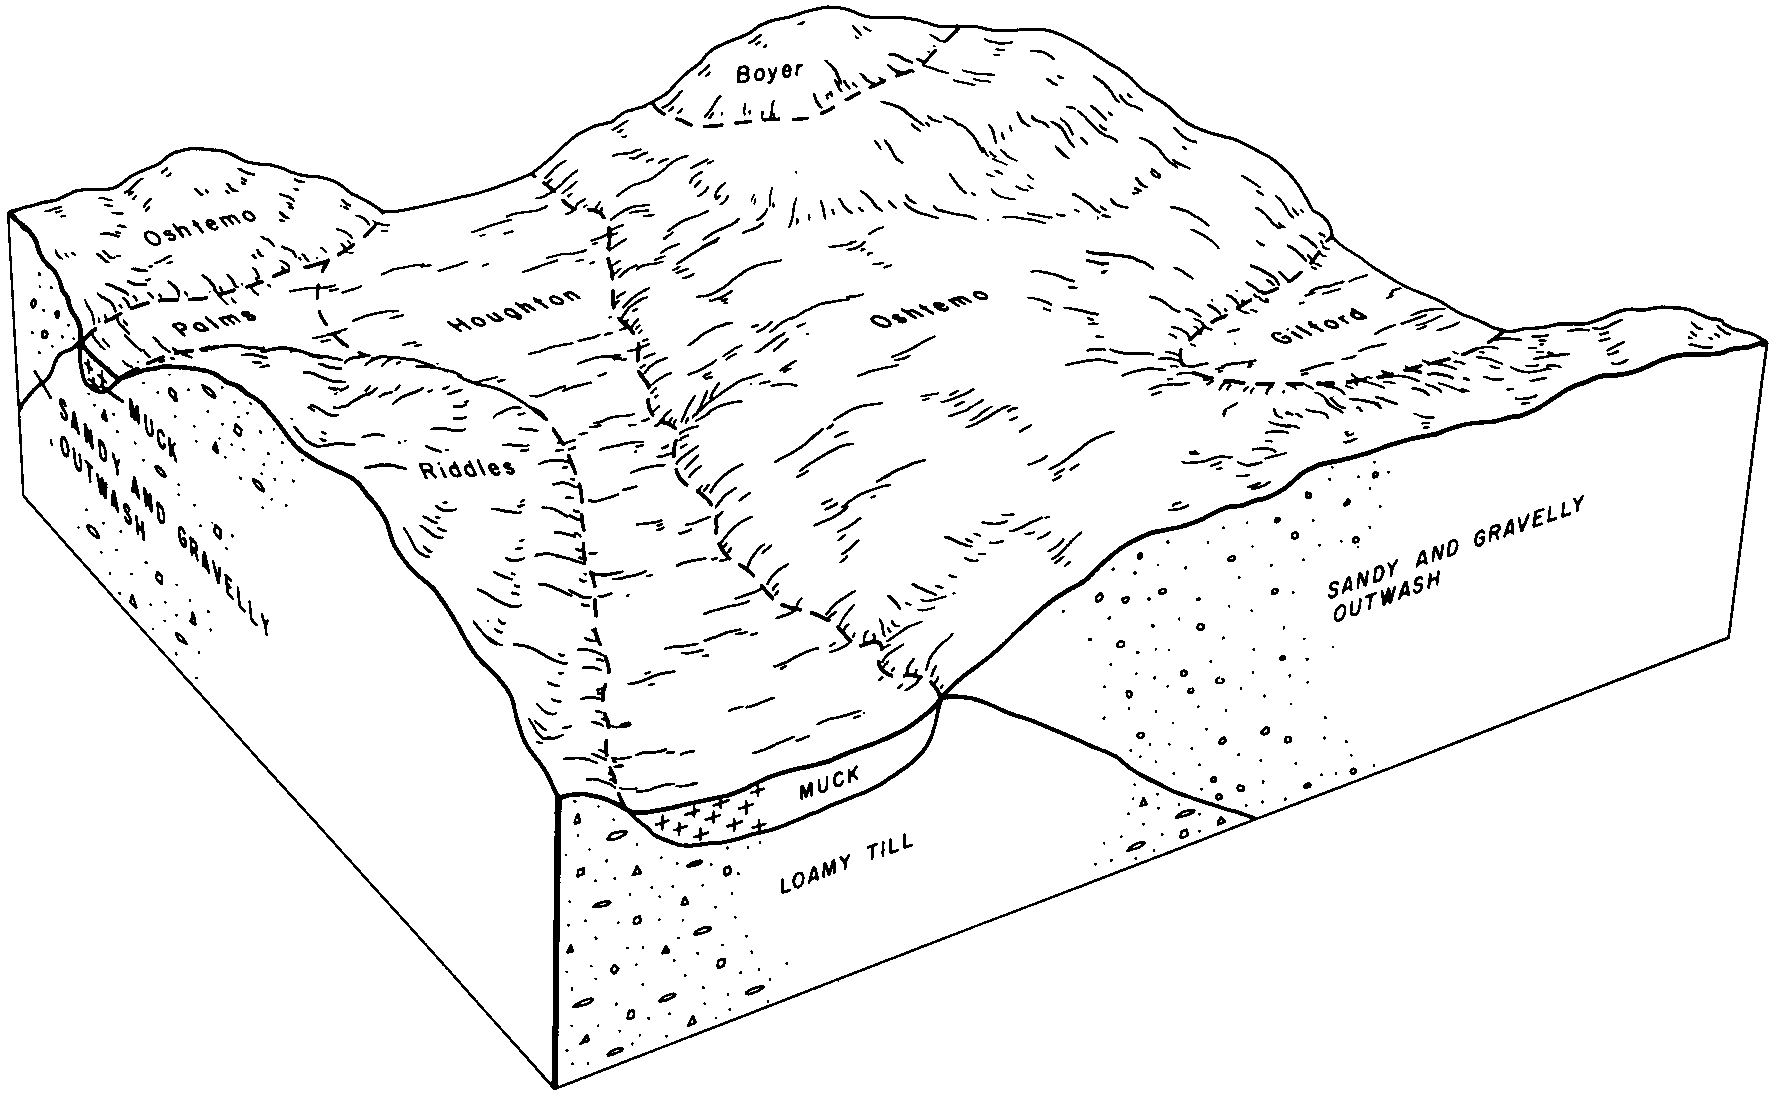
| Gilford fine sandy loam, 0 to 2 percent slopes | 473 | 862 | 408782 | fqcj | ia115 | 1984 | 1:15840 |
Gilford fine sandy loam, 0 to 2 percent slopes | 201A | 151 | 796312 | vqmh | il015 | 2005 | 1:12000 |
Gilford fine sandy loam, 0 to 2 percent slopes | 201A | 974 | 731157 | sjtq | il017 | 2003 | 1:12000 |
Gilford fine sandy loam, 0 to 2 percent slopes, rarely flooded | 7201A | 854 | 1445211 | 1khvq | il017 | 2003 | 1:12000 |
Gilford fine sandy loam, 0 to 2 percent slopes | 201A | 1705 | 2108726 | 2ytd5 | il031 | 2008 | 1:12000 |
Gilford fine sandy loam, 0 to 2 percent slopes | 201A | 4749 | 1143990 | 2ytd5 | il063 | 2005 | 1:12000 |
Gilford fine sandy loam, 0 to 2 percent slopes | 201A | 1834 | 244667 | 86lh | il073 | 2001 | 1:12000 |
Gilford fine sandy loam, 0 to 2 percent slopes | 201A | 18797 | 175559 | 2ytd5 | il075 | 1980 | 1:15840 |
Gilford fine sandy loam, 0 to 2 percent slopes | 201A | 31196 | 980368 | 2ytd5 | il091 | 2003 | 1:12000 |
Gilford fine sandy loam, 0 to 2 percent slopes | 201A | 4818 | 1381651 | 1hcqd | il103 | 2004 | 1:12000 |
Gilford fine sandy loam, 0 to 2 percent slopes | 201A | 6977 | 177771 | 5yzk | il125 | 1989 | 1:15840 |
Gilford sandy loam, undrained, 0 to 2 percent slopes | 1201A | 415 | 177751 | 5yyx | il125 | 1989 | 1:15840 |
Gilford fine sandy loam, 0 to 2 percent slopes | 201A | 874 | 793044 | vm72 | il195 | 2003 | 1:12000 |
Gilford fine sandy loam, 0 to 2 percent slopes | 201A | 3146 | 198283 | 2ytd5 | il197 | 2002 | 1:12000 |
Gilford fine sandy loam, undrained, 0 to 2 percent slopes | 1201A | 179 | 618752 | nrvr | il197 | 2002 | 1:12000 |
Gilford sandy loam, till plain, 0 to 2 percent slopes | GejA | 151 | 164693 | 3129d | in003 | 1965 | 1:15840 |
Gilford-Urban land complex, till plain, 0 to 2 percent slopes | YgvA | 14 | 3404512 | 2zy3m | in003 | 1965 | 1:15840 |
Gilford loam, till plain, 0 to 2 percent slopes | GdzA | 3497 | 3404655 | 3129h | in017 | 1979 | 1:15840 |
Gilford loam, outwash plain, 0 to 1 percent slopes | GdyA | 2910 | 3404654 | 3129b | in017 | 1979 | 1:15840 |
Gilford fine sandy loam, outwash plain, 0 to 1 percent slopes | GdoA | 1422 | 3404658 | 3129k | in017 | 1979 | 1:15840 |
Gilford sandy loam, till plain, 0 to 2 percent slopes | GejA | 1375 | 3404657 | 3129d | in017 | 1979 | 1:15840 |
Gilford sandy loam, outwash plain, 0 to 1 percent slopes | GefA | 958 | 3404656 | 31299 | in017 | 1979 | 1:15840 |
Gilford sandy loam, till plain, 0 to 2 percent slopes | GejA | 4318 | 165368 | 3129d | in039 | 1997 | 1:12000 |
Gilford sandy loam, 0 to 2 percent slopes, gravelly subsoil | GczA | 4265 | 3404627 | 2w5lx | in039 | 1997 | 1:12000 |
Gilford mucky sandy loam, till plain, 0 to 2 percent slopes | GebA | 989 | 165369 | 3129f | in039 | 1997 | 1:12000 |
Gilford mucky sandy loam, 0 to 1 percent slopes, gravelly subsoil | GdnA | 717 | 3404628 | 2w5ly | in039 | 1997 | 1:12000 |
Urban land-Gilford complex, 0 to 1 percent slopes | UeqA | 578 | 165504 | 5k6v | in039 | 1997 | 1:12000 |
Gilford fine sandy loam, 0 to 2 percent slopes, gravelly subsoil | Gf | 10843 | 162567 | 2w5lw | in049 | 1984 | 1:15840 |
Gilford fine sandy loam, till plain, 0 to 2 percent slopes | GdtA | 7072 | 3404652 | 3129j | in049 | 1984 | 1:15840 |
Gilford sandy loam, till plain, 0 to 2 percent slopes | GejA | 1195 | 3404653 | 3129d | in049 | 1984 | 1:15840 |
Gilford fine sandy loam, loamy substratum, 0 to 2 percent slopes | Gh | 491 | 162568 | 30kbr | in049 | 1984 | 1:15840 |
Gilford fine sandy loam, outwash plain, 0 to 1 percent slopes | GdoA | 330 | 3404651 | 3129k | in049 | 1984 | 1:15840 |
Gilford fine sandy loam, outwash plain, 0 to 1 percent slopes | GdoA | 12297 | 3404630 | 3129k | in073 | 1985 | 1:15840 |
Gilford fine sandy loam, till plain, 0 to 2 percent slopes | GdtA | 3429 | 3404629 | 3129j | in073 | 1985 | 1:15840 |
Gilford fine sandy loam, 0 to 2 percent slopes | Gf | 1159 | 161354 | 30kbn | in073 | 1985 | 1:15840 |
Gilford sandy loam, till plain, 0 to 2 percent slopes | GejA | 4151 | 160864 | 3129d | in085 | 1985 | 1:20000 |
Gilford mucky sandy loam, till plain, 0 to 2 percent slopes | GebA | 1565 | 160865 | 3129f | in085 | 1985 | 1:20000 |
Gilford sandy loam, gravelly substratum, 0 to 2 percent slopes | Gf | 1096 | 3404631 | 30kbq | in085 | 1985 | 1:20000 |
Gilford mucky sandy loam, gravelly substratum, 0 to 2 percent slopes | Gm | 482 | 3404632 | 30kbs | in085 | 1985 | 1:20000 |
Gilford sandy loam, 0 to 2 percent slopes, gravelly subsoil | Gf | 6394 | 3404633 | 2w5lx | in087 | 1978 | 1:20000 |
Gilford sandy loam, till plain, 0 to 2 percent slopes | GejA | 3015 | 272599 | 3129d | in087 | 1978 | 1:20000 |
Gilford fine sandy loam, 0 to 1 percent slopes | Gd | 10215 | 272459 | 2w5lv | in089 | 1967 | 1:15840 |
Gilford mucky fine sandy loam | Gf | 2939 | 272460 | 94j1 | in089 | 1967 | 1:15840 |
Gilford loam | Gm | 2049 | 272461 | 94j2 | in089 | 1967 | 1:15840 |
Gilford fine sandy loam, 0 to 1 percent slopes | Gf | 42099 | 272662 | 2w5lv | in091 | 1979 | 1:15840 |
Gilford mucky sandy loam, till plain, 0 to 2 percent slopes | GebA | 6392 | 2451235 | 3129f | in099 | 1978 | 1:15840 |
Gilford mucky sandy loam, 0 to 1 percent slopes, gravelly subsoil | GdnA | 4406 | 3404635 | 2w5ly | in099 | 1978 | 1:15840 |
Gilford sandy loam, till plain, 0 to 2 percent slopes | GejA | 364 | 1702548 | 3129d | in099 | 1978 | 1:15840 |
Gilford sandy loam, 0 to 2 percent slopes, gravelly subsoil | GczA | 200 | 3404634 | 2w5lx | in099 | 1978 | 1:15840 |
Urban land-Gilford complex, 0 to 1 percent slopes | UeqA | 146 | 2485510 | 2pfcr | in099 | 1978 | 1:15840 |
Gilford sandy loam, till plain, 0 to 2 percent slopes | GejA | 1302 | 161962 | 3129d | in103 | 1977 | 1:20000 |
Barry-Gilford complex | Bh | 7697 | 163515 | 5h4p | in111 | 1990 | 1:15840 |
Gilford fine sandy loam, 0 to 1 percent slopes | Gf | 1942 | 163581 | 2w5lv | in111 | 1990 | 1:15840 |
Gilford fine sandy loam, outwash plain, 0 to 1 percent slopes | GdoA | 84 | 3404638 | 3129k | in111 | 1990 | 1:15840 |
Gilford fine sandy loam, till plain, 0 to 2 percent slopes | GdtA | 56 | 3404637 | 3129j | in111 | 1990 | 1:15840 |
Gilford sandy loam, till plain, 0 to 2 percent slopes | GejA | 1503 | 272534 | 3129d | in113 | 1974 | 1:15840 |
Gilford sandy loam, 0 to 1 percent slopes | Gf | 11531 | 160648 | 2w5lt | in127 | 1978 | 1:15840 |
Goodell-Gilford fine sandy loams, 0 to 1 percent slopes | GmnA | 12506 | 184933 | 66fl | in131 | 2001 | 1:12000 |
Maumee-Gilford complex, 0 to 1 percent slopes | MgyA | 5376 | 184947 | 66g1 | in131 | 2001 | 1:12000 |
Whitepost-Gilford fine sandy loams, 0 to 1 percent slopes | WmiA | 4247 | 184987 | 66hb | in131 | 2001 | 1:12000 |
Granby-Gilford complex, 0 to 1 percent slopes | GsaA | 1452 | 185004 | 66hw | in131 | 2001 | 1:12000 |
Gilford fine sandy loam, 0 to 1 percent slopes | GcwA | 511 | 184994 | 2w5lv | in131 | 2001 | 1:12000 |
Gilford-Monon fine sandy loams, 0 to 1 percent slopes | GdvA | 280 | 184996 | 66hm | in131 | 2001 | 1:12000 |
Gilford fine sandy loam, outwash plain, 0 to 1 percent slopes | GdoA | 268 | 3404649 | 3129k | in131 | 2001 | 1:12000 |
Gilford fine sandy loam, till plain, 0 to 2 percent slopes | GdtA | 3 | 3404648 | 3129j | in131 | 2001 | 1:12000 |
Gilford sandy loam, 0 to 2 percent slopes, gravelly subsoil | GczA | 7982 | 200313 | 2w5lx | in141 | 2001 | 1:12000 |
Urban land-Gilford complex, 0 to 1 percent slopes | UeqA | 4938 | 612244 | nk2t | in141 | 2001 | 1:12000 |
Gilford mucky sandy loam, 0 to 1 percent slopes, gravelly subsoil | GdnA | 446 | 614146 | 2w5ly | in141 | 2001 | 1:12000 |
Gilford sandy loam, till plain, 0 to 2 percent slopes | GejA | 282 | 3404647 | 3129d | in141 | 2001 | 1:12000 |
Gilford sandy loam, 0 to 1 percent slopes | Gf | 10128 | 162613 | 2w5lt | in149 | 1980 | 1:15840 |
Gilford fine sandy loam, outwash plain, 0 to 1 percent slopes | GdoA | 38396 | 3404646 | 3129k | in181 | 1979 | 1:20000 |
Gilford fine sandy loam, 0 to 2 percent slopes | Gf | 2631 | 161849 | 30kbn | in181 | 1979 | 1:20000 |
Gilford-Monon fine sandy loams, 0 to 1 percent slopes | Gv | 2452 | 161850 | 5fdz | in181 | 1979 | 1:20000 |
Gilford sandy loam, 0 to 1 percent slopes | 20 | 6211 | 186159 | 2w5lt | mi021 | 1979 | 1:15840 |
Gilford sandy loam, 0 to 2 percent slopes, gravelly subsoil | 6 | 3289 | 186991 | 2w5lx | mi023 | 1984 | 1:15840 |
Gilford fine sandy loam, 0 to 2 percent slopes, gravelly subsoil | 63 | 4001 | 188720 | 2w5lw | mi025 | 1993 | 1:15840 |
Gilford sandy loam, 0 to 2 percent slopes, gravelly subsoil | 36 | 6309 | 186929 | 2w5lx | mi027 | 1988 | 1:15840 |
Gilford sandy loam, 0 to 2 percent slopes, gravelly subsoil | Gf | 6471 | 186372 | 2w5lx | mi037 | 1974 | 1:15840 |
Gilford sandy loam, 0 to 2 percent slopes, gravelly subsoil | Gf | 5348 | 186229 | 2w5lx | mi045 | 1974 | 1:15840 |
Gilford sandy loam | Gd | 4468 | 186852 | 68fh | mi049 | 1967 | 1:20000 |
Gilford sandy loam, 0 to 2 percent slopes, gravelly subsoil | Gd | 3356 | 187012 | 2w5lx | mi057 | 1975 | 1:12000 |
Gilford fine sandy loam, till plain, 0 to 2 percent slopes | 39 | 2701 | 188649 | 2t6mr | mi059 | 1991 | 1:15840 |
Gilford sandy loam, 0 to 2 percent slopes, gravelly subsoil | Gf | 9671 | 186728 | 2w5lx | mi065 | 1977 | 1:15840 |
Gilford loamy sand | Gf | 354 | 187966 | 69lf | mi067 | 1965 | 1:15840 |
Gilford sandy loam, 0 to 2 percent slopes, gravelly subsoil | Gg | 263 | 187967 | 2w5lx | mi067 | 1965 | 1:15840 |
Gilford fine sandy loam, 0 to 2 percent slopes, gravelly subsoil | 19 | 3640 | 186608 | 2w5lw | mi073 | 1983 | 1:15840 |
Gilford-Colwood complex | 18 | 20146 | 188757 | 6bdy | mi075 | 1979 | 1:15840 |
Gilford sandy loam, 0 to 2 percent slopes, gravelly subsoil | Gd | 4501 | 187063 | 2w5lx | mi077 | 1978 | 1:15840 |
Gilford fine sandy loam, 0 to 2 percent slopes, gravelly subsoil | 28 | 1917 | 187123 | 2w5lw | mi081 | 1984 | 1:15840 |
Mussey-Gilford sandy loams | Mw | 4234 | 192122 | 6fxh | mi087 | 1966 | 1:15840 |
Gilford sandy loam, till plain, 0 to 2 percent slopes | Gd | 1361 | 192024 | 2t6mq | mi087 | 1966 | 1:15840 |
Gilford sandy loam | Gs | 5 | 2508737 | 68vn | mi091 | 1957 | 1:20000 |
Gilford sandy loam, 0 to 2 percent slopes, gravelly subsoil | Gd | 7584 | 187563 | 2w5lx | mi093 | 1968 | 1:20000 |
Gilford sandy loam | Gd | 3311 | 187644 | 6981 | mi099 | 1967 | 1:20000 |
Gilford sandy loam, silty subsoil variant | Gf | 878 | 187645 | 6982 | mi099 | 1967 | 1:20000 |
Gilford sandy loam | 55 | 7707 | 187260 | 68vn | mi115 | 1980 | 1:15840 |
Gilford sandy loam, till plain, 0 to 2 percent slopes | 48 | 3732 | 188857 | 2t6mq | mi125 | 1980 | 1:15840 |
Gilford sandy loam, 0 to 2 percent slopes, gravelly subsoil | Gd | 2773 | 192663 | 2w5lx | mi139 | 1967 | 1:15840 |
Gilford sandy loam | 110 | 44 | 2399545 | 2ljxp | mi145 | 1991 | 1:15840 |
Gilford sandy loam, 0 to 2 percent slopes, gravelly subsoil | 143 | 7 | 2673608 | 2w5lx | mi145 | 1991 | 1:15840 |
Gilford sandy loam | Gd | 894 | 187415 | 690n | mi147 | 1969 | 1:20000 |
Gilford sandy loam, 0 to 2 percent slopes, gravelly subsoil | 13 | 8272 | 186266 | 2w5lx | mi149 | 1980 | 1:15840 |
Gilford sandy loam | Gm | 48 | 2508274 | 693d | mi151 | 1955 | 1:15840 |
Mussey-Gilford sandy loams | Mw | 6 | 2508301 | 6fxh | mi151 | 1955 | 1:15840 |
Gilford sandy loam, 0 to 2 percent slopes, gravelly subsoil | Gg | 8835 | 187797 | 2w5lx | mi155 | 1967 | 1:12000 |
Gilford stony sandy loam | Gh | 74 | 187798 | 69f0 | mi155 | 1967 | 1:12000 |
Gilford sandy loam | 42 | 10629 | 187500 | 693d | mi157 | 1984 | 1:15840 |
Gilford sandy loam, 0 to 1 percent slopes | 26 | 15190 | 186311 | 2w5lt | mi159 | 1984 | 1:15840 |
Gilford sandy loam, till plain, 0 to 2 percent slopes | Gf | 6148 | 191630 | 2t6mq | mi161 | 1974 | 1:20000 |
Gilford sandy loam | Gf | 6122 | 3015042 | 6bk7 | mi163 | 1974 | 1:12000 |
Gilford sandy loam, occasionally ponded, 0 to 2 percent slopes, occasionally flooded | 66093 | 1563 | 888758 | yttm | mo045 | 1992 | 1:24000 |
Gilford fine sandy loam | Gf | 739 | 168444 | 5n8p | oh039 | 1981 | 1:15840 |
Gilford fine sandy loam, 0 to 1 percent slopes | GdA | 1588 | 172142 | 5s3z | oh043 | 1998 | 1:12000 |
Gilford fine sandy loam | Gf | 8126 | 169083 | 5ny9 | oh051 | 1981 | 1:15840 |
Gilford mucky loam, till plain, 0 to 2 percent slopes | Gfo7A | 486 | 644395 | 3129c | oh063 | 1997 | 1:12000 |
Gilford fine sandy loam | Go | 2547 | 168992 | 5nvc | oh069 | 1968 | 1:15840 |
Gilford fine sandy loam | Gf | 2883 | 169844 | 5pqv | oh095 | 1978 | 1:15840 |
Gilford fine sandy loam | Ge | 684 | 169561 | 5pfq | oh143 | 1983 | 1:15840 |
Gilford mucky loam, till plain, 0 to 2 percent slopes | Gfo7A | 60 | 1592170 | 3129c | oh147 | 1978 | 1:15840 |
Gilford fine sandy loam, till plain, 0 to 2 percent slopes | Gft6A | 1576 | 168153 | 3129j | oh171 | 1975 | 1:15840 |
Gilford fine sandy loam, stratified substratum, 0 to 3 percent slopes | 7473A | 10999 | 423277 | g6g3 | wi021 | 1972 | 1:15840 |
Gilford sandy loam | 7473A | 1614 | 423786 | g6zj | wi055 | 1976 | 1:15840 |
Gilford loam | 7473A | 358 | 3403430 | g93s | wi133 | 2023 | 1:15840 |